Small and Medium Enterprises in India’s Economic Growth
| ✅ Paper Type: Free Essay | ✅ Subject: Economics |
| ✅ Wordcount: 2127 words | ✅ Published: 31 Jul 2018 |
Small and Medium Enterprises in Economic Growth of India: Directions towards Sustainable Development
- Manvendra Pratap Singh, Arpita Chakraborty, Dr. Mousumi Roy
Abstract
The inclusive growth is prerequisite in any of fast growing developing economies. Micro small and Medium Enterprise (MSME) play vital role in the socio-economic development of the country. In 2011-12, 36.18 mn enterprises were operational and employed around 80.5 mn people of country, second largest after agriculture sector (MSME Annual Report 2011-12). They accounts for 40 percent of India’s total exports, contributing 45 percent to Indian manufacturing output. With all the good things the darker side of MSME, it attracts only 2.33 employees per unit (on an average), they contributes mere 17 percent to the Indian GDP. This paper will highlight the reasons behind the shining India and Bharat. This paper will also focus on the facilities, scheme provided by the central or state government of country, its implementation and possible solutions for empowerment and spreading its boundaries beyond the country through international cooperation scheme.
Keywords: MSME, International Cooperation, regional Economics
Introduction
India’s economic growth is expected to pick up a faster pace in 2013-14 and record six per cent plus levels of gross domestic product (GDP), according to Mr C Rangarajan, Chairman, Prime Minister’s Economic Advisory Council (PMEAC). Country reported to expand at a better growth rate as compared to its three BRIC peers China, Russia and Brazil in May 2013, as per HSBC survey. India witnessed an improvement in its business climate on the back of increased foreign direct investment (FDI) and greater revenue receipts by the Government. The ‘BluFin Business Cycle Indicator (BCI)’, reflects macroeconomic developments on a monthly basis, stood at 165.3 points in July 2013, 5.3 percent higher compared to July 2012 which implies that business performance is comparatively better than previous year.
In economic development scenario, India is leading from all fronts i.e. 2013 FDI confidence Index stands 5th, 2013 Deliotte Manufacturing Competitive Index stands 4th, 2013 KPMG Change Readiness Index stands 65th. 2013 Global Innovation Index stands 66th. While on societal development front, India’s condition is not upright. As per the United Nations Development Programs (UNDP) Human development Index 2013 India stands 136th. In inequality Index, India stands 91st, in gender inequality 132nd, value of multidimensional poverty index is 0.283 on basis of year 2005/2006. A major cause of poverty among India’s rural, urban poor both individuals and communities, is lack of access to regular job opportunity, productive assets and financial resources. High level of inadequate health care, illiteracy and extremely limited access to social services are common among poor people. Seven states – Chhattisgarh, Bihar, Odisha, Rajasthan, Jharkhand, Madhya Pradesh and Uttar Pradesh – account for 61 per cent of India’s total poor. Chhattisgarh is the poorest state in the country with approximately 40 per cent of its population being below the poverty line (www.downtoearth.org ). According to NSSO 66th Survey 2010, around 52.9 percent of population engaged in primary sector (agriculture and allied sector) contributing 19 percent to gross value added (GVA) of country, 22.7 percent of working population engaged in secondary sector which contributes 28 percent in GVA and 24.4 percent of population engaged in tertiary sector (Services) contributes 53 percent in our GDP. Considering NSSO 66th Survey, around 75 percent working population engaged in primary and secondary sector of the economy, and resides countryside or in outskirts of cities. While considering the basic amenities in such areas are vulnerable i.e. health care centres, schools, sanitation facilities etc. These differences demarcate a thin line between Shining India (Cities) and Bharat (Villages, towns and outskirts of cities) in terms of societal development and economic parity.
Literature review
In dynamic economic world, business innovation and competitiveness helps Small and medium enterprises to grow leap and bound. According to the Global Manufacturing Competitiveness Index, 2013, Developing nations are emerging as potential manufacturing destinations like china ranked 1st as best manufacturing destinations while other developing nations are India, Brazil, Vietnam Indonesia etc. GMCI, 2013 report envisaged that in next five years the above mentioned nations will be key manufacturing hubs along with three leading manufacturing powers i.e. USA, Germany and Japan- remained ranked in top 10 most competitive nations today. Across the world, more than 95 percent of the enterprises are SMEs and employs 60 percent of total private employment (Ayyagari et al. 2011).
SMEs by number dominate the world stage, Japan has highest number of SMEs registered among the industrialized nation accounts for 99 percent of total enterprises (Edinburgh Group Report, 2011). India had 26.1 million SMEs (MSME, 4th census) and employed around 59.7 million people of the country, second largest employer after agriculture sector. In European Union, jointly 27 countries accounts for 99.8 percent of total enterprises, employs 67 percent of all workers and contributes 58 percent of gross value added. (Edinburgh Group Report, 2011).
The SMEs are lacking in knowledge and information base which reflected in poor work practices mainly the managerial and technical abilities among owners and managers. They mainly fall sort of environmental awareness and its impact and focused toward short term gains over long term objectives because of limited resources and lower capital-output ratio compared to a competitive large unit. Mainly SMEs are reluctant to the programs and policies i.e. waste management circle initiated by National Productivity council because of lack of their nature (Dasgupta, 1999).
For example, Henriques and Sadorsky (1996) explored the effect of self-reported community pressure on Canadian firms’ decisions to adopt an environmental plan. The effect of self-reported community pressure (presence versus absence) on Mexican firms’ decisions to adopt certain environmental management practices.
Analysis:
Urban and Rural working Population across the sectors:
In India, services sector mainly includes hotels & restaurants, Banking Finance Securities & Insurance (BFSI), Information Technology (IT) & Information Technology Enabled services (ITES), Education, Health etc. According to NSSO 66th Survey, contribution of services sector is 53 percent as gross value added to the economy and employed only 24.4 percent of working population.
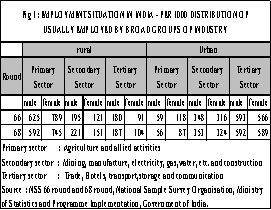
Figure 1 shows the distribution of population employment per 1000 distribution in all three sectors of economy. Primarily comparing Round 66 and Round 68, finds out that rural primary sector population is shifting toward secondary and tertiary sector mainly men are relocating toward secondary and women are relocating toward tertiary sector. Considering the fact, urban population i.e. men and women are relocating toward secondary sector with marginal increment. With such development in secondary sector, more than 60 percent of Special Economic Zones (SEZs) approvals have been extended to IT/ITES sector, the manufacturing sector left with one third of total approvals (Deepak Shah, 2009). It may affect growth and competitiveness of manufacturing sector which shows huge potential in terms of engaging new skilled pool of population into itself.
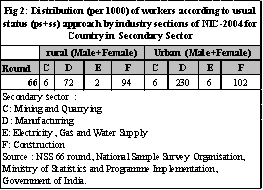
According to NSSO 66 Round Survey (Figure 2), while comparing secondary sector of economy, particularly, manufacturing (D) & Construction (F) for rural and urban India, employment opportunities are relatively more in urban areas compare to rural areas because of basic facility location factors. With respect to social security, from entire workforce mere 8 percent workers entitled for statutory social protection (i.e. risks as sickness, maternity, disability and old age) through central and state level rules on conventional social security (NCEUS, 2006). Around 86 percent of total workers who employed in unorganized sector lag behind for basic social security benefits.

As per (Figure 3) MSME Annual Report 2012-2013, rural registered MSME units are lesser than urban units while unregistered Micro and Small (MS) rural units are far more than urban units. Another important aspect of Indian MSME sector is that micro and small enterprises are more than medium enterprises and employed more number of population compared to medium enterprises where labor efficiency, economics of scale and environmental friendliness would not be considered as a parameter of growth. The overall labor efficiency is gloomily low which signifies poor quality of employment mainly because of informal employment called casualization. In manufacturing sector, 88 percent of employment lies under such category (Kannan (2011). According to planning commission estimates, casual workforce earnings were only one-fourth of the wages of regular (full time) workers (Rs. 51 as against Rs. 200) in 2004-05. Prevalence of poverty among casual workforce, self-employed and regular was as high as 32 per cent, 17.5 per cent and 11 per cent respectively with an average of 20.51 per cent for all employed workers. (Planning Commission, 2008, Chapter 4, Annexure 4.7).
MSMEs financing and credit trends:

While considering the outstanding bank credits to micro and small enterprises (Figure 4) are on higher side with year on year increase of average 33.3 percent, which reflects the position of respective enterprises and condition of workers working for such enterprises, because it’s obvious that if an enterprise is falling sort of funds to manage its outstanding credit taken from various banks, how it will take care of its enterprise and workers. It reflects that mainly MS enterprises are dragged behind due to falling short of funds and other finance facilities which requires to compete with established local and global players in respective market.
Conclusion:
According to NAS data the service-sector has achieved an average annual compound growth rate of 8.7 per cent annum between 1999-2000 and 2009-10 as against 7.7 per cent achieved by manufacturing during the same period. Manufacturing sector in urban India has grown at a faster rate (2.8 per cent) relative to all India (1.7 per cent) over the period 1999-2000 and 2009-10.
Unlike service sector has practiced skill scarcity and growth in service sector is reasonably more skill demanding than manufacturing sector at higher skill levels. Indian policy makers needs to focus on manufacturing sector like china counterpart which leads in exports and generated huge and stable employment environment by focusing on MSME model (Ramaswamy, 2012). Microenterprise development could generate income and enable poor people to improve their living conditions, has only recently become a focus of the government. The government initiatives and scheme like cluster development program, integrated industrial development scheme and credit guarantee fund scheme etc which stimulates inter-firm linkages and network have assisted MSMEs to move up in the value chain and gain competitive advantage, given access to technology upgraded production technology in sector should be spread across the industrial zones of the country by conducting workshops and training camps to reap the benefits (IBEF, 2013). The report of Task Force on MSME (2010) provides roadmap for the enhancement and up gradation of MSME sector and mainly emphasized on following key issues:
- Public Procurement Policy: Government Departments and PSUs to reach atleast 20 percent of their annual volume purchase from MSEs
- Government should focus on rehabilitation of sick SME units and enhance schemes in context of National Action Plan for Climate Change (NAPCC).
- Enable conducive environment for legal and fiscal instruments to incentivize SMEs for their corporation as entities.
- Assurance for strict adherence to stipulated targets by commercial banks for SMEs.
References:
ATKearney Foreign Direct Investment Confidence Index, Back to Business: Optimism and Uncertainty (2013)
Ayyagari, M., Demirgüç-Kunt, A. and Maksimovic, V. (2011), Small vs. Young Firms Across The World – Contribution to Employment, Job Creation, and Growth, Policy Research Working Paper 5631 (The World Bank Development Research Group).
Deepak Shah (2009), Special Economic Zones in India: A Review of Investment, Trade, Employment generation and Impact Assessment, Indian Journal of Agriculture Economics, Vol 64, No. 3, July-Sept 2009.
Das Gupta N, 1999. Energy efficiency and environmental improvements in small-scale industries: present initiatives in India are not working. Energy Policy (27) 789-800.
Edinburgh (2011), Growing the global economy through SMEs.
Goyal M, (2013, June 09). SMEs employ close to 40 percent of India’s workforce, but contribute only 17 percent to GDP. The Economic Times retrieved from http://articles.economictimes.indiatimes.com/2013-06-09/news/39834857_1_smes-workforce-small-and-medium-enterprises.
Henriques, I., Sadorsky, P., 1996. The determinants of an environmentally responsive firm: an empirical approach. J. Environ. Econ. Manage. 30, 381–395.
HSBC EXPAT Explorer Survey 2013 Report: http://www.expatexplorer.hsbc.com/files/pdfs/overall-reports/2013/report.pdf
Human Development Report 2013. The rise of south: Human Progress in Diverse World.
Kannan, K.P. (2011) ‘How Inclusive is Inclusive Growth in India’ paper presented at the International Expert Workshop on ‘Inclusive Growth: From Policy to Reality’, jointly organized by International Development Research Centre (IDRC), Canada and Indian Institute for Dalit Studies (IIDs), New Delhi; 11-13 December, 2011, New Delhi.
KPMG Change Readiness Index (2013), KPMG International MSME Annual Report 2012-13
NCEUS (2006) Social Security for Unorganized Workers, New Delhi, National Commission for Enterprises in the Unorganized Sector, New Delhi, Government of India.
NCEUS (2007) Report on Conditions of Work and Promotion of Livelihoods in the Unorganized Sector, New Delhi, Government of India and Academic Foundation.
NSSO (2005) Income, Expenditure and Productive Assets of Farmer Households (Situation Assessment Survey of Farmers), 59th Round, Report No. 497, New Delhi, National Sample Survey Organization.
Planning Commission (2008), Eleventh Five Year Plan (2007-2012) –– Volume I, Inclusive Growth, –– Volume III, Agriculture, Industry, Services and Physical Infrastructure, New Delhi, Planning Commission, Government of India.
Ramaswamy K V, Agarwal Tushar (2012), Services-led Growth, Employment and Job Quality: A Study of Manufacturing and Service-sector in Urban India, WP-2012-007.
Rs 27 per day: India’s new rural poverty line, 23 July, 2013, Down To Earth, http://www.downtoearth.org.in/content/indias-new-rural-poverty-line-rs-27-day
Samuel R A, Global competitiveness Index Report 2013
Zaidi L, (2013). Proceeding from International Conference on Technology and Business Management.
Cite This Work
To export a reference to this article please select a referencing stye below:
Related Services
View all


DMCA / Removal Request
If you are the original writer of this essay and no longer wish to have your work published on UKEssays.com then please click the following link to email our support team:
Request essay removal