Analysis of Living Standards in the UK
| ✅ Paper Type: Free Essay | ✅ Subject: Economics |
| ✅ Wordcount: 3000 words | ✅ Published: 31 Jul 2018 |
Assignment Title: Living Standards
The UK in 2013 had a population of approximately 64 million; standards of living are used to monitor and identify which areas of the UK and the world are living in penury and which areas are more affluent and are thriving. The government is responsible for identifying the contributing factors towards a wealthy region or a poor region.
Burtless, G (1987, p.232) defines standards of living as “the sustained level of consumption of goods and services that can be afforded on the basis of a household’s current assets and current and future income”. Economists and economic research companies have tried and tested many different ways to record the standard of living in the UK.
Living standards is a hot topic in political conversations, and the government are pressured to focus on improving the well-being of the population. Elliot, L (2014) recent article for the Guardian discusses the views of Andrew Harrop, general secretary of the Fabian Society who exclaims that “What we measure – and how we measure it – matters. The financial crisis proved that simply targeting the headline goals of GDP growth, unemployment and inflation was totally inadequate as these measures failed to identify major economic weaknesses as they emerged”. This would suggest that the government need to revisit their policy on standards of living on focus on refining them in order to achieve their objectives.
Mankiw, N (2011) suggests that policymakers must accumulate factors of production quickly in order to make the population more efficient and more positive. There are many different measures of standard of living that have been developed over the past 30-40 years, there are the more traditional ways of measurement and modern, innovative and experimental measures that are both used in the world of business.
Traditional standard of living measures
Crafts et al (2007) suggests that historically, standards of living have been measured by assessing real wages. Real wages is the income of a person and with consideration of the inflationary effects on purchasing power. Recent UK and US wage statistics compiled by Branchflower & Machin (2014) suggests that after a healthy upwards movement of the average wage in the UK in the 1990’s and early part of the 2000’s; there is an alarming downward trend from the year 2010 to 2013 where wages rates are increasingly lowering. From the graph it is also clear that the US wage growth is very little historically and there are no major fluctuations in comparison to the UK. (See Appendix 1).
The Economist (2014) blames the fall in real wages on the UK’s ‘dismal productivity’ since the recession, output in the UK is below the pre-financial crisis peak. This would suggest that Britain needs more highly skilled jobs and possible incentives to boost productivity and create an efficient labour market.
Real wages are effective in measuring standards, real wages statistics can be used to identify trends in wages in different countries over a particular period, this is further emphasised by the International Labour Organisation (2003) who suggest that real wages are useful for identifying differences in purchasing power of wages in different world economies, real wages can also provide an idea of the progress of a working population.
Nordhaus (1997 p.30) criticises the method of calculating real wages, he states that “If we are to obtain accurate estimates of the growth of real incomes over the last century, we must some-how construct price indexes that account for the vast changes in the quality and range of goods and services that we consume”. It could be argued that countries such as the US and the UK have already constructed price indexes with the use of the Retail Price Index, the Consumer Price Index in the last century.
Another of the more traditional measures of living standards is GDP; the main GDP elements that are important for living standards are GDP per capita and Real GDP per capita. GDP per capita is the total output divided by the population of a country. Recent figures from the ONS (2014) shows a comparison of the top economies in the world of the year 1997 and 2012; from the graph (see Appendix 2) it is clear to see that the UK GDP per capita has risen but not as much in value as the likes of the US, Canada and Germany – the UK still however has the 4th biggest GDP per capita in the world.
Nominal GDP per capita is often criticised by economists because it does not take inflation into consideration, so it is better to use Real GDP as the measurement because it is relevant and reflects a true value. Eurostat’s graph (see Appendix 3) shows the year on year growth percentage of real GDP per capita in the UK, the research shows a large dip after the financial crisis and since that has happened the percentage growth rate has never reached the peaks pre-financial crisis, this would suggest that productivity in the UK is low and there needs to be more employment created, which could lead to an increase the output of the country.
The main positive of using GDP per capita as a measure is that it is used nationwide and recorded fairly frequently, GDP per capita is measured in quarters and allows countries to evaluate the figures and look at trends over different periods – this is important to identify which countries are trending downwards and is important at a regional level, governments can identify what areas are lacking in output and where investment needs to be focused.
Whereas real wages are said to be useful in comparing the difference in wealth in economies International Labour Organisation (2003), Tucker (2013) argues there are several issues when comparing countries using GDP per capita, he suggests that low economically developed countries are not as accurate as wealthier countries when recording the data necessary for GDP. He also suggests that some countries have very different income distribution using the United Arab Emirates as an example; the majority of income comes from oil which is only distributed amongst a number of rich families.
Real GDP per capita is important because it can give a true value after inflationary adjustments are made, however this measure also has some limitations. Similarly to GDP per capita, real GDP per capita fails to identify inequalities in income and wealth in a country, there is also the issue of the ‘black market’ which can he hidden amongst the value of real GDP per capita.
Another traditional measure of living standards to consider is the Gini coefficient; the Gini index measures the actual distribution income in a country in comparison to an equal distribution of income. The index measures the difference between a Lorenz curve and a line of equality. The Gini index line of 0 represents equality whereas 100 would indicate inequality.
The Poverty Site (2010) Gini Coefficient graph (see Appendix 4) shows a comparison of the 27 members of the European Union, at the time the UK figure stood at just over 30% which ranks sixth highest in inequality in Europe and higher than the EU27 average of 30%. The graph also shows how Scandinavian countries such as Sweden & Finland have a much more equal society in terms of income despite their questionable taxation policies. The United Kingdom would likely try and target a smaller percentage to achieve better equality amongst the population.
Concerns over income inequality have been raised recently. Treanor & Farrell (2014) recent article for the Guardian discusses how the UK is the only G7 country with growing inequality, the article discusses findings from a Credit Suisse global wealth report show that the UK’s richest 10% of people represent 54.1% of the total national income. There will be inevitable pressure on the government from low income families that have been suffering from rising utility bills and only a small rise in wages.
The Gini Co-efficient is very effective in showing the inequality in countries throughout the world, it can also help economists and businessman understand and support their thinking if they believe the country is increasing in terms of inequality of income. McKinley, T (1995 p.141) writes that “the Gini coefficient does not concentrate merely on differences from the mean; it is a much more direct measure of inequality because it accounts for the differences between every pair of observations”.
The Gini co-efficient isn’t without its limitations, Parrillo (2008) suggests that the measure does not alter much when transfers are made between the rich and the poorer people. Another disadvantage of the Gini coefficient is that it fails to inform you of the changes in the distribution of income between income groups as opposed to alternative measures of living standards.
Alternative standard of living measures
Throughout the last 20-30 years there have been a number of alternative measures developed across the world, trying to find a better way to measure living standards.
The Human Development Index was originally developed by the UN to monitor and develop a ranking of countries by the following criteria; average years of schooling, expected years of schooling, life expectancy from birth and gross national income per capita.
From the most recent HDI data (see appendix 5) the United Kingdom ranks at #14 in the top 15, the HDI shows some interesting developments and differences between the nations of the world. The United States for example has a high GNI Per capita compares to other countries, their life expectancy however ranks lower than any other country in the top 15; this could suggest that the United States standard of living is not truly reflected in the HDI.
Although the Scandinavian countries rank high on the HDI, Henrietta Moore of The Guardian (2014) argues that they are not the model for global prosperity; she suggests that their principles of autonomy and self determination are the reasons for their high human development. Moore summarises statistics that suggest that the Scandinavian countries are consuming resources far too quickly – they rank top of both the carbon emissions usage and they rank high in the WWF’s scale of ecological impact. It could be argued that it is important to consider the environmental impacts of nation’s activities before considering their Human Development ranking.
The obvious advantage of the HDI is that it makes it simple to monitor the changes in development of countries over a period of time, it is also effective to use when comparing different countries around the world and how they are developing and which element of the criteria is changing most. There is a drawback to the HDI, Soubbotina & Sheram (2000) suggests that it fails to show the significance of the different elements and fails to support why a countries index may have altered over time. It could be argued that the United Nations needs to provide more reasoning and evidence to support changes in figures.
Another of the more recent innovative measurements of living standards is the Happy Planet Index developed in 2006; countries are measured on life expectancy, well-being and ecological footprint. Each country is given a particular colour as in the HPI (see Appendix 6) based on their performance; green being good, amber being middle or average, red being bad performance after accumulating the different components for each country.
From appendix 6, the countries performing worst are the United States and a lot of African countries including Ethiopia, Kenya and Nigeria. The United Kingdom is ranked in the middle ranking as a result of their poor ecological footprint in which they rank #121 out of the 151 countries. Surprisingly Mexico is one of the best performing countries based on the index ranking 23rd out of 151 with a healthy well-being score.
The Happy Planet Index became very popular when it first came out because of the results it produced. Simms & Boyle (2009) praises the measure suggesting it is the first measure to combine well-being and environmental impact to find a countries efficiency. A social factor and criticism of the Happy Planet Index is described by Murray, P (2011) he argues that families may find that they do not welcome giving information on personal health to help determine life expectancy and levels of personal health, this suggests that the information for some countries may be inaccurate because a lot of people may have refused to give such sensitive personal information.
Another alternative measure which has been viewed as a successor for GDP is the Genuine Progress Indicator, this measure is designed to measure improvements made in economic welfare. GPI takes several factors into consideration including monetary value of voluntary and unpaid work, leisure time. Similarly to the previous measures discussed, GPI takes into consideration income distribution, environmental impacts and state of the environment. The GPI also accounts for the cost of crime in the country being measured.
The GPI has been tested across the world in a number of different experiments. Bagstad & Shammin (2012) looked at testing different GPI factors in 17 counties in Ohio and compared the results of change from 1990-2005 (see appendix 7), from the table we can see the differences in 15 years in some important factors to the people of Ohio. There have been drastic changes in some factors including net capital investment which is good for the areas because it may improve job prospects. The advantage of GPI in this particular testing process in Ohio is that it combines an element of consumption, GDP per capita and Gini coefficient.
The GPI is being used increasingly around the world because it has a number of advantages in comparison to traditional methods such as GDP, the GPI is said to take into consideration negative contributions to growth such as pollution and crime, GPI is effective in measuring people’s living standards and not just a measure of output as is the primary objective of GDP.
GPI is much more useful in long term planning than GDP because environmental impacts are taking into consideration and be addressed in the long term. Although GPI takes the value of leisure time and environmental impacts, these factors are very hard to determine a specific value to include in the calculations, GDP per capita in comparison is a much simpler method; GPI is also ineffective in relation to a business cycle.
Measures of living standards are ever changing; there may never be a measure more accurate or reliable as another because they all have their criticisms and drawbacks that are fresh within economist’s minds. It is clear that there is a shift of focus from just measuring output of a population through GDP per capita to recognising the issues and factors that affect a population; the alternative measures each focus on social factors such as life expectancy. Rather than looking at just earnings and wages, the newer measures of living standards focus on what is actually relevant to people around the world. GDP per capita and real wages show some difference in the level of wealth and income inequality but it is methods like the Human Development Index which can be used to determine a more global perspective of living standards, to summarise the more traditional methods are useful for measuring the wealth whereas the alternative and more innovative measures focus on the social factors that indicate a populations standard of living.
Appendices
Appendix 1

Source: Branchflower & Machin (2014)
Appendix 2
 Source: ONS (2014)
Appendix 3
Yearly change in percentage of Real GDP per capita growth in the UK
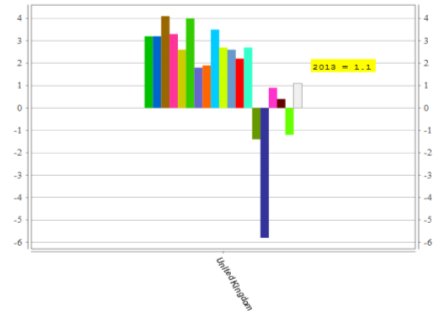
Source: Eurostat (2014)
Appendix 4

Source: The Poverty Site (2010)
 Appendix 5
HDI Index 2013 top 15 rankings, Source: United Nations Development Programme (2013)
Appendix 6
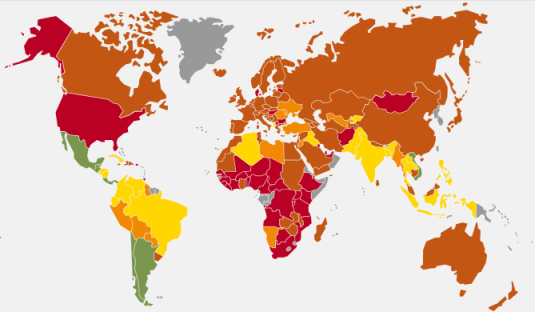
Source: Happy Planet Index (2012)
Appendix 7

Source: Bagstad & Shammin (2012)
Bibliography
- Bagstad,K, Shammin, R. (2011) ‘Can the Genuine Progress Indicator better inform sustainable regional progress?—A case study for Northeast Ohio’, Ecological Indicators, 18, pp.330-341, Science Direct (Online) Available at: http://www.sciencedirect.com.ergo.glam.ac.uk/science/article/pii/S1470160X11003918# (Accessed 22/11/14).
- Boyle, D., Simms, A. (2009). The New Economics: A Bigger Picture. Oxford: Routledge.
- Branchflower, D., Machin, S. (2014) ‘Falling real wages’, Paper No’ CEPCP422, 19 (1) pp. 19-21. CentrePiece (Online). Available at: http://cep.lse.ac.uk/pubs/download/cp422.pdf (Accessed 17/11/14)
- Burtless, G (1987). 1st edn. Work, Health and Income among the Elderly. Washington, D.C: Brookings Institution.
- Crafts, N., Gazeley, I. Newell, A. (2007). Work and Pay in 20th Century Brtiain. Oxford: Oxford University Press.
- Elliot, L (2014) ‘Living standards should be ‘central measure’ of UK economic performance’ 12 March (Online) Available at: http://www.theguardian.com/business/2014/mar/12/living-standard-measure-economic-growth (Accessed 16/11/14)
- Eurostat (2014). Real GDP per capita, growth rate and totals. Available at: http://epp.eurostat.ec.europa.eu/tgm/graph.do?tab=graph&plugin=1&pcode=tsdec100&language=en&toolbox=sort. Accessed (17/11/14).
- Happy Planet Index (2012). HPI 2012: Map View. Available at: http://www.happyplanetindex.org/data/. (Accessed 21/11/14)
- International Labour Organisation. (2003). 3rd edn. Key Indicators of the Labour Market. Geneva: ILO Publications.
- Mankiw, N (2011). 6th edn. Principles of Economics. Ohio: South-western publishing.
- McKinley, T (1995). The Distribution of Wealth in Rural China. Oxford: Routledge.
- Moore, H (2014). ‘Why Scandinavia is not the model for global prosperity we should all pursue’. 1st December (Online). Available at: http://www.theguardian.com/sustainable-business/2014/dec/01/why-scandinavia-is-not-the-model-for-global-prosperity-we-should-all-pursue. (Accessed 1/12/14)
- Murray, P. (2011). The Sustainable Self: A Personal Approach to Sustainability Education. Oxford: Routledge.
- Nordhaus, W. (1997). P.27-70. The Economics of New Goods. Chicago: University of Chicago Press.
- ONS (2014). The UK has one of the fastest growing economies in the G7. Available at: http://www.ons.gov.uk/ons/rel/elmr/gdp-and-the-labour-market/q1-2014–may-gdp-update/sty-gdp-g7-economies.html. Accessed (17/11/14).
- Parrillo, V (2008). Encyclopedia of Social Problems. Washington DC: Sage Publications.
- Soubbotina, T., Sheram, K. (2000). Beyond Economic Growth: Meeting the Challenges of Global Development. Washington DC: World Bank Publications.
- The Economist (2014). What recovery? Real wages 413(8910), 32(US). 25th October. Retrieved from: http://go.galegroup.com/ps/i.do?id=GALE%7CA387050752&v=2.1&u=uwcn&it=r&p=STND&sw=w&asid=a520ff594e7283ba19a015fcb5d8e35f (Accessed 17/11/14).
- The Poverty Site (2010). European Union: Gini Coefficient. Available at: http://www.poverty.org.uk/e14/index.shtml. Accessed (17/11/14).
- Treanor, J & Farrell, S (2014). ‘UK only G7 country with wider inequality than at turn of century’. 14th October (Online). Available at: http://www.theguardian.com/society/2014/oct/14/uk-inequality-wealth-credit-suisse. Accessed (17/11/14).
- Tucker, I (2013). Macroeconomics for Today. 8th edn. Ohio: South-western publishing.
- United Nations Development Programme (2013). Human Development Index and its components. Available at: http://hdr.undp.org/en/content/table-1-human-development-index-and-its-components. (Accessed 21/11/14)
Cite This Work
To export a reference to this article please select a referencing stye below:
Related Services
View all


DMCA / Removal Request
If you are the original writer of this essay and no longer wish to have your work published on UKEssays.com then please click the following link to email our support team:
Request essay removal