The Boston/BCG matrix: guide, real examples + free template
Info: 3537 words (14 pages) Study Guides
Published: 29 Sep 2025
Part of: BCG matrix
Struggling with the BCG matrix or another business assignment? Get expert help from our UK-qualified specialists today! See our business assignment help page for more info.
The BCG matrix – also known as the Boston Consulting Group’s growth-share matrix – is a strategic framework for portfolio management that helps organisations allocate resources among their different business units or products (Boston Consulting Group, n.d.).
Developed in the late 1960s and first popularised by BCG founder Bruce Henderson in 1970, it provided a simple visual tool for balancing growth and cash flow in a company’s portfolio (Ungvarsky, 2024).
Henderson argued that companies should maintain a portfolio of products with varied growth rates and market shares to optimise long-term returns, rather than simply pursuing growth everywhere (Reeves et al., 2014).
By the early 1980s, the matrix had become highly influential – an estimated half of Fortune 500 firms were using it as part of their strategic planning process (Reeves et al., 2014).
It remains a staple in business education and strategic planning today, helping managers from undergraduates to seasoned professionals systematically evaluate where to invest, where to divest, and how to prioritise opportunities.
Background and purpose of the BCG matrix
The primary purpose of the BCG matrix is to assess a company’s portfolio of businesses or products in terms of their cash generation and growth potential. It does this by plotting each business unit on a two-dimensional grid: one axis represents the market growth rate (how fast the market or industry segment is expanding), and the other represents the relative market share (the unit’s share of the market relative to its largest competitor).
This visual arrangement quickly highlights which products are high-growth or low-growth, and whether they are market leaders or laggards. The underlying logic, as articulated by Henderson (1970), was that a balanced portfolio should include both high-growth opportunities and stable cash-generating ventures, ensuring that today’s successes are funding tomorrow’s prospects.
At its core, the matrix is a tool for strategic resource allocation. It helps companies decide where to invest more, which areas to maintain, and what to phase out, based on each product’s position in the market.
Over time, the BCG matrix has proven useful not only for large conglomerates but also for smaller businesses and even investors analysing a collection of products or assets (Ungvarsky, 2024). In all cases, the goal is to channel resources efficiently to maximise long-term value.
Understanding the four quadrants of the BCG matrix
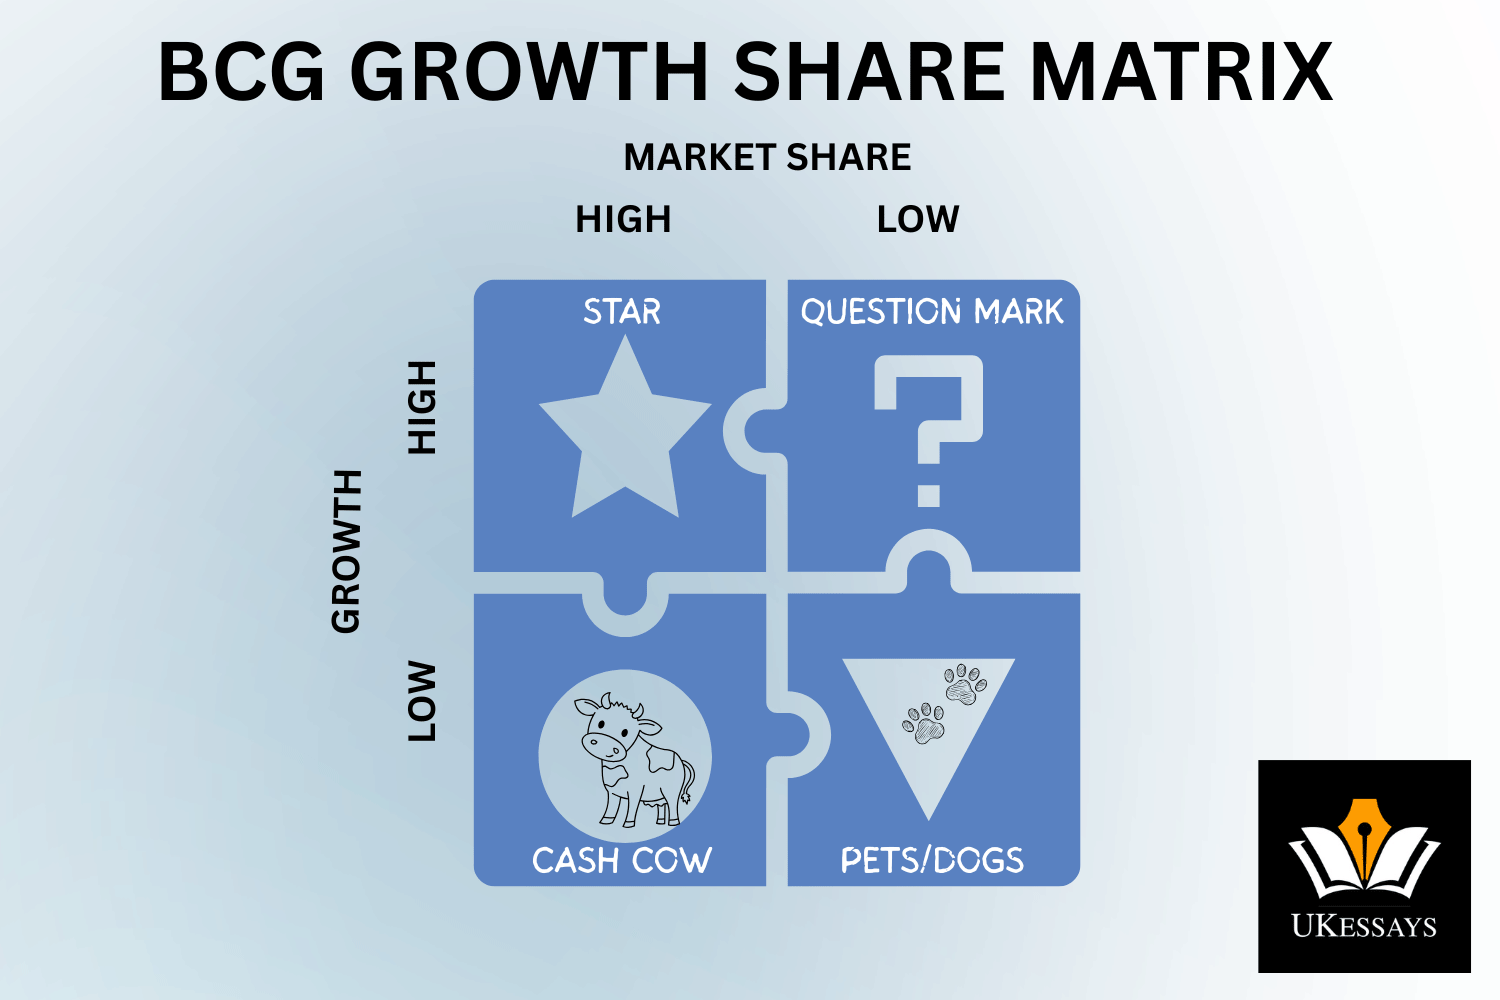
The BCG matrix divides a portfolio into four categories or “quadrants,” based on the combination of market growth and relative market share. Each quadrant has a unique name and strategic implication:
Stars:
High-growth, high-market-share products – BCG categorises these products as Stars. These are often leaders in emerging or fast-growing markets.
Stars tend to generate significant revenue but also consume substantial investment to fuel their rapid growth.
Because they operate in expanding markets, Stars can eventually become the next Cash Cows when market growth slows. The strategic aim is to invest in Stars to sustain their momentum and consolidate their leading position (Caramela, 2024).
Cash Cows:
Low-growth but high-market-share products are commonly known as Cash Cows. These are typically mature, well-established offerings that dominate their market niches and generate more cash than they need to maintain their market position.
Cash Cows have strong profitability with minimal investment, making them the financial foundation of the company. The strategy for Cash Cows is to “milk” them efficiently – harvest the excess cash flows and redirect those funds to promising areas (Ungvarsky, 2024).
Companies should continue modest investments to defend Cash Cows’ market position, but primarily use their cash output to support Stars and Question Marks.
Question Marks:
High-growth markets but low-market-share products are labeled as Question Marks (often nicknamed “Problem Children”) by BCG. These offerings are in attractive, fast-growing segments yet currently hold only a small market share.
Question Marks are uncertain bets – with heavy investment and effective strategy, a Question Mark could grow into a Star; otherwise, it might fail to gain traction and degenerate into a Dog (Caramela, 2024).
Managing Question Marks is challenging because they often require significant cash investment but yield little short-term return. The recommended approach is to carefully evaluate their potential: invest aggressively in those with clear strategic advantages or market opportunities, and consider divesting those that are less promising (Hanlon, 2022).
Dogs (or pets):
Low-growth, low-market-share products are the Dogs (sometimes politely termed “Pets”) in this framework. These units typically have diminished prospects and may barely break even in terms of cash flow (Caramela, 2024).
Because Dogs hold a weak market position in a stagnant market, they tie up capital that could be better deployed elsewhere. The usual advice is to divest Dogs – either discontinue the product, sell off the business, or reposition it if a niche opportunity exists.
However, not all Dogs are completely worthless. In some cases a Dog can still generate modest profits if it requires little investment – for example, a discontinued car model that still sells spare parts can deliver steady revenue with minimal costs (Hanlon, 2022).
Generally, though, companies should be realistic about Dogs and avoid sentimental attachment to underperforming products.
Each quadrant thus suggests a broad strategy:
- invest and grow the Stars,
- milk the Cash Cows,
- experiment selectively with Question Marks, and
- cut losses on Dogs.
The labels are vivid but metaphorical, and real businesses must also consider nuance. Nevertheless, this categorisation provides a starting point for decisions on resource allocation and growth planning.
How to apply the BCG matrix in practice
Download a free BCG matrix template here
Applying the BCG matrix involves a series of practical steps to assess and categorise your business portfolio. Follow these steps to create and use a BCG matrix:
1. Define the portfolio units:
Start by identifying the units you want to analyse. In a large company, these might be business divisions or product lines; in a smaller firm, you might list individual products or services. Ensure you are comparing entities at a similar level (e.g., don’t mix individual products with entire divisions). Having a clear list of portfolio entities sets the scope for the analysis.
2. Determine market growth rate:
For each unit, assess the growth rate of the relevant market. This is usually measured as the annual percentage growth of the industry or product category in which that unit operates. A common approach is to look at the projected growth over the next 3–5 years (Caramela, 2024).
Classify the growth as “high” or “low” by comparing it to a threshold – for example, the company’s average market growth or a benchmark such as overall GDP growth. The dividing line between high and low growth is subjective and should reflect your industry context (Hanlon, 2022). For instance, 10% per annum might be considered high growth in a consumer goods market, w
hereas in a tech sector, the high-growth threshold might be much higher. Defining this cutoff clearly is important for an accurate analysis.
3. Determine relative market share:
Next, calculate each unit’s relative market share. This is typically defined as your unit’s market share divided by the market share of its largest competitor in the same market (Ungvarsky, 2024). For example, if your product has 15% market share and the leading competitor has 30%, your relative share is 0.5. In BCG analysis, a relative share above 1.0 (i.e. you are the market leader) is often considered “high,” whereas below 1.0 is “low.”
If precise market share data or competitor comparison is hard to get – especially for niche products or small businesses – you can use absolute market share or another indicator of competitive strength. The key is to consistently distinguish which products have a strong versus a weak market position.
4. Plot the matrix:
Draw the two-axis matrix (you can sketch it, use a spreadsheet template, or specialised software). The vertical axis represents market growth rate (low at the bottom, high at the top), and the horizontal axis represents relative market share (low on the right, high on the left, in the traditional BCG layout).
Now plot each product or unit as a point (often drawn as a circle) in the appropriate quadrant based on its values for growth and share. Label each point with the product name for clarity. If data allows, you can also scale the size of each point based on the product’s revenue or profit contribution, to convey its importance to the company. This completed chart will show a scatter of circles across the four quadrants.
5. Analyse and categorise:
Review the completed matrix and verify which quadrant each unit falls into – Star, Cash Cow, Question Mark, or Dog. This visual overview immediately highlights the balance of your portfolio. For example, you might observe that you have many Cash Cows but few Stars (signalling strong current cash flows but fewer future growth engines), or perhaps several Question Marks vying for investment.
Discuss the draft categorisation with your team to ensure consensus, especially for units near the borderline between quadrants. In some cases, additional research or data sensitivity analysis might be needed to confidently classify a product. The outcome of this step is a clear categorisation of each portfolio entity.
6. Strategic decision-making:
Finally, use the matrix to guide resource allocation and strategy. Formulate specific actions for each unit according to its category.
- For Stars and high-potential Question Marks, plan to invest and expand capacity (e.g. increase marketing spend, accelerate production, or expand into new markets) to capitalise on growth opportunities.
- For Cash Cows, decide how to use their cash flows wisely – typically to support growth initiatives in other areas, fund new product development, pay down debt, or pay dividends to shareholders. Make sure the Cash Cows continue to be well-managed but avoid over-investing in them since their market is mature.
- For Question Marks that lack a convincing path to market leadership, you might set a time-limited trial investment or specific performance milestones; if they don’t show progress after a reasonable period, be prepared to reduce funding or terminate the project.
- For Dogs, it is often best to minimise any further investment and have a clear exit or repositioning plan. For example, you might gradually discontinue a declining product or sell off a small business unit to a competitor. In some cases a Dog can be maintained profitably if it has a niche loyal customer base and requires negligible resources – but generally, it’s prudent to divest or discontinue underperforming offerings and reallocate those resources to higher-growth areas.
By following these steps, you will develop a tailored BCG matrix for your organisation. The result is a snapshot of your portfolio’s health that can prompt strategic discussions.
Ask yourself:
- Are we nurturing the right future Stars?
- Do we have enough Cash Cows to fund our growth?
- Are we investing in too many Question Marks?
- Which Dogs can we phase out or turn around?
The matrix does not make decisions for you, but it provides a structured foundation to ensure your decisions are grounded in data and strategic logic rather than gut feel.
Real-world example 1: BCG matrix for Coca Cola
It can be helpful to see how the BCG matrix works with a concrete example. Consider the product portfolio of The Coca-Cola Company, which extends far beyond its namesake cola drink.
Stars
Products with high market share in high-growth markets:
- Kinley and Dasani (Coca-Cola’s bottled water brands prominent in Europe and the US) are classified as Stars due to expanding demand for healthy beverages and bottled water.
- Fanta and Sprite also sometimes appear as Stars in certain emerging global markets due to large growth potential and strong market presence.
Cash Cows
High market share in low-growth markets:
- Coca-Cola Classic is widely recognised as the quintessential Cash Cow for the company, with dominant market share and strong steady revenue generation in the mature carbonated soft drinks market.
- Limca, a regional soft drink, also functions as a Cash Cow due to established brand leadership in its segment.
Question Marks
Low market share in high-growth markets; high potential but risky:
- Diet Coke, Minute Maid, Honest Tea, and Smartwater are frequently listed as Question Marks, especially as Coca-Cola pushes harder into healthier and non-carbonated categories with varying success.
- Coca-Cola Energy, Coca-Cola Plus Coffee, and Dasani (due to competition from other bottled water brands) are also considered Question Marks as they seek to capture new growth.
Dogs/pets
Low market share in a low-growth market:
- Discontinued or unsuccessful products—such as region-specific flavors that did not gain traction (e.g., Coca-Cola BlāK, Kinley Soda) – are seen as Dogs in the portfolio.
- The classic Coke product is sometimes predicted to migrate to the Dog category due to steadily declining demand for regular carbonated soft drinks in mature markets, especially amid health consciousness trends.
Example table: Coca-Cola products in BCG matrix
These examples illustrate how Coca-Cola’s diverse product lineup fits within the strategic categories of the BCG matrix, guiding decisions about where to invest, maintain, or divest.
The key takeaway is that portfolio positions are not static. Managers must continuously monitor their BCG matrix and be ready to adapt strategy (Ungvarsky, 2024).
In practice, companies often revisit their portfolio analysis on a regular cycle (for example, annually or quarterly). By updating the matrix, they can track movements (e.g. a Question Mark gaining share and moving towards Star, or a Star’s market growth slowing and sliding towards Cash Cow) and adjust their investment decisions accordingly.
Real world example 2: BCG matrix for Unilever
Unilever is an excellent example of a company with a diverse product range that can be analysed using the BCG matrix. Here’s how key Unilever brands fall into each quadrant:
Stars
High market share in high-growth markets:
- Axe (Lynx), Lux, Sunsilk, Walls Ice Cream, and Fair & Lovely are among Unilever’s Star products, benefiting from aggressive marketing and leadership in fast-growing personal care and ice cream segments.
Cash Cows
High market share in low-growth markets:
- Dove, Surf Excel, Ponds, Lipton, Close Up, Blue Band, Lifebuoy Soap, and Knorr are Unilever’s Cash Cows. These brands dominate established personal care and foods markets, delivering reliable profits.
Question Marks
Low market share in high-growth markets:
- Clear Shampoo, Rin, Comfort, and Unilever’s plant-based and sustainable products are classified as Question Marks. They operate in emerging or fast-evolving segments but have not yet secured dominant positions.
Dogs
Low market share in low-growth markets:
- Underperforming or discontinued lines such as Wheel, Supreme Tea, and Lifebuoy Shampoo are regarded as Dogs, offering limited prospects and often being phased out.
Example table: Unilever products in BCG matrix
This breakdown shows how Unilever manages a balanced product portfolio, investing in high-potential brands while leveraging mature ones and phasing out those with limited growth or market share.
Benefits of using the BCG matrix
The enduring popularity of the BCG matrix stems from several clear benefits for strategic planning:
Clear visual summary:
The matrix provides a one-page snapshot of a company’s portfolio. The matrix distills complex information about different businesses into an easy-to-understand four-quadrant chart. This clarity helps stakeholders quickly grasp which products are driving growth and profits and which are lagging (Caramela, 2024). It aids communication and alignment, as the framework is intuitive and widely known.
Resource allocation guidance:
By categorising products by their cash generation and growth needs, the BCG matrix highlights where to direct resources. It encourages companies to channel surplus cash from Cash Cows into promising Stars and Question Marks, thereby balancing short-term returns and long-term opportunities (Boston Consulting Group, n.d.). This framework instills discipline in budgeting and investment decisions, helping avoid the pitfall of spreading resources too thin or supporting too many low-potential projects.
Strategic insight and focus:
The matrix forces a business to consider each product’s strategic role. It helps identify which offerings are worth investing in, which need fixing, and which should be phased out. By making these distinctions explicit, managers can focus their attention and avoid wishful thinking. The BCG analysis may also spark ideas for new products: for example, noticing a gap – say, an absence of products in the Star quadrant or an overload of Dogs – might prompt innovation to ensure future growth. In this way it provides a structured reflection on the portfolio’s strategic balance.
Applicable to diverse contexts:
Although originally developed for corporate multi-business portfolios, the underlying idea has broad applications. Entrepreneurs and investors can use a similar approach to evaluate a portfolio of ventures or investments.
The simplicity of the model allows practitioners to use it alongside other analyses (like SWOT or product life cycle stage) to form a well-rounded strategic view. It’s a flexible tool that can be scaled up or down depending on context, making it relevant for classroom case studies and boardroom decisions alike.
Limitations and considerations
While useful, the BCG matrix has important limitations that strategists should keep in mind:
Oversimplification:
The model reduces performance evaluation to just two factors – growth and market share. Real-world success is multifaceted, and focusing only on these axes gives an incomplete picture of why a business is thriving or struggling (Caramela, 2024).
For instance, factors like profit margins, customer loyalty, brand strength, or competitive advantages are not captured by this two-factor view. Therefore, the BCG matrix should be supplemented with additional analysis; it is a starting point for questions, not a full explanation.
Ignores synergies:
The framework treats each product or unit in isolation, yet in practice, products can be interdependent. A unit categorised as a Dog might still be strategically important because it complements other products or holds key assets (for example, a low-selling item that completes a product line).
The matrix does not account for such synergies or the portfolio effect of offering a complete range (Caramela, 2024). Managers must be careful not to overlook qualitative factors – a seemingly weak product might deserve support due to strategic reasons that the matrix alone would miss.
Static snapshot:
The BCG matrix is typically based on current data (current market share and current growth rate). It does not directly incorporate dynamic changes or potential disruptions. In reality, markets can shift rapidly due to technology, regulatory changes, or evolving consumer tastes.
A high-growth market can quickly saturate, or a dominant market share can erode if a new competitor or innovation appears. The matrix assumes conditions are relatively stable or change in a predictable way, which is often not the case (Caramela, 2024). For this reason, the analysis requires regular updating, and strategic decisions derived from it should be revisited often to remain valid.
Definitions can be subjective:
The cut-off between “high” and “low” for both growth and market share is not scientifically fixed. Different analysts might categorise the same product differently depending on their assumptions or industry benchmarks.
Similarly, for small businesses or very fragmented markets, the concept of relative market share can be hard to apply – if you operate in a niche, every product might look like a Dog by global standards even if it’s profitable in your niche (Hanlon, 2022). The BCG matrix works best with robust data and a clear competitive context; without these, its categorisations may be less reliable.
Potential impact on morale and culture:
An often overlooked consequence of portfolio labeling is the impact on internal teams. If management openly tags a division as a “Dog,” employees in that unit might feel demoralised or conclude that their work has no future. This can become a self-fulfilling prophecy, as talent and effort drift away from the labeled Dogs and towards the company’s perceived “Stars” (Ungvarsky, 2024). Therefore, leaders should use the matrix carefully as an internal tool and communicate strategic shifts tactfully, focusing on the business rationale rather than the stigma of a label.
In light of these limitations, it’s evident that the BCG matrix should not be used in isolation or as a rigid formula. It provides a helpful framework for discussion, but sound strategic decisions require additional analysis and managerial judgement beyond what any single matrix can offer.
Struggling with the BCG matrix or another business assignment? Get expert help from our UK-qualified specialists today! See our business assignment help page for more info.
References and further reading:
- Boston Consulting Group (n.d.) What Is the Growth Share Matrix? [Online]. Available at: https://www.bcg.com/about/overview/our-history/growth-share-matrix (Accessed 29 September 2025).
- Caramela, S. (2024) What is a BCG Matrix? Business News Daily, 12 Sept 2024. [Online]. Available at: https://www.businessnewsdaily.com/5693-bcg-matrix.html (Accessed 29 September 2025).
- Hanlon, A. (2022) How to use the BCG Matrix model. Smart Insights, 07 Jan 2022. [Online]. Available at: (Accessed 29 September 2025).
- Henderson, B. D. (1970) The Product Portfolio. Boston: Boston Consulting Group.
- Reeves, M., Moose, S. and Venema, T. (2014) BCG Classics Revisited: The Growth Share Matrix. Boston Consulting Group, 04 June 2014. [Online]. Available at: https://www.bcg.com/publications/2014/growth-share-matrix-bcg-classics-revisited (Accessed 29 September 2025).
- Ungvarsky, J. (2024) “Growth–share matrix.” Research Starters: Business and Management. EBSCO Publishing. [Online]. Available at: https://www.ebsco.com/research-starters/business-and-management/growth-share-matrix (Accessed 29 September 2025).
Cite This Work
To export a reference to this article please select a referencing stye below:
Related Services
View all


Related Content
CollectionsContent relating to: “BCG matrix”
Student-written BCG Matrix examples, free guide, and assignment help from UK-qualified business experts to boost your studies. These student-written BCG Matrix examples are provided to inspire and guide your own assignments. Our free BCG Matrix guide (with template) clearly explains how this strategic framework categorises products based on their market share and growth, identifying them as Stars, Cash Cows, Question Marks, or Dogs. If you’re struggling with your analysis, you can always get tailored support from our UK-qualified business experts – just visit our business assignment help page for more info.
Related Articles