GE‐McKinsey matrix guide
Info: 5267 words (21 pages) Study Guides
Published: 30 Sep 2025
Struggling with a GE-McKinsey matrix assignment or any other type of management coursework? Get personalised support from UK-qualified management experts and boost your grades. Visit our management assignment help page to find out more.
In corporate strategy, multi-business organisations often face the challenge of deciding where to invest for growth and where to cut losses.
The GE‐McKinsey matrix is a classic framework that helps diversified companies address this issue in a systematic way (McKinsey & Company, 2008). It evaluates each strategic business unit (SBU) or product line based on two dimensions – the attractiveness of its industry and the competitive strength of the business unit – and situates them on a 3×3 grid of priority levels.
This tool emerged in the 1970s as a more comprehensive alternative to the simpler BCG growth-share matrix, and it remains widely taught in business schools and utilised in strategic planning today.
It provides a visual portfolio overview so managers (and students of strategy alike) can quickly identify which businesses are poised for investment and growth, which require selective attention, and which might be candidates for harvesting or divestment.
Origin and background
The GE‐McKinsey matrix was developed in the early 1970s when General Electric (GE) engaged McKinsey & Company to help it strategise across an extensive portfolio of businesses (McKinsey & Company, 2008).
At the time, GE had hundreds of diverse SBUs and found existing tools like the BCG matrix too simplistic for its needs. Therefore, McKinsey consultants – including renowned strategist Kevin Coyne – designed a nine-cell “business screen” framework to provide a more nuanced analysis of GE’s portfolio.
The matrix considers multiple factors for industry attractiveness and business strength (instead of single measures like market growth or share) and thus gave GE a richer basis for resource allocation decisions. By plotting each business unit on a grid, GE’s top management could clearly see which businesses were in robust positions in promising industries and which were in weaker positions or less attractive markets. As a result, the GE‐McKinsey nine-box matrix enabled GE to prioritise investment in units with the best prospects and to identify underperforming businesses for possible turnaround or sale.
The framework quickly gained traction beyond GE – it was recognised as a systematic portfolio planning tool in the strategy field (Amatulli et al., 2011) and adopted by other conglomerates. Indeed, many large companies developed similar multifactor matrices (for instance, Royal Dutch Shell’s Directional Policy Matrix was a closely related concept) to guide corporate strategy.
The GE‐McKinsey model is sometimes called the GE business screen, the GE nine-cell matrix, or the McKinsey nine-box framework, and it is considered an enduring strategy tool for achieving a balanced and strategically aligned business portfolio (McKinsey & Company, 2008).
Framework overview: the nine-box grid
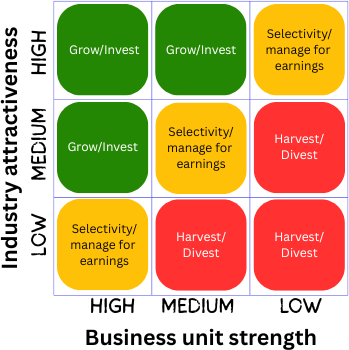
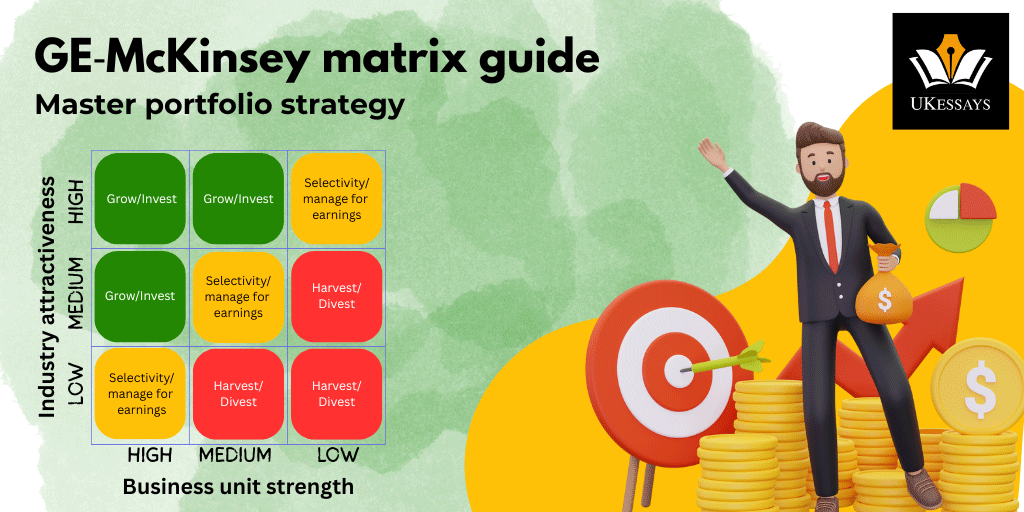
The GE‐McKinsey matrix is a 3×3 grid – essentially a table with nine cells – that maps out business units based on two key dimensions: Industry Attractiveness (vertical axis) and Business Unit Strength (horizontal axis).
Each axis is typically divided into three levels: high, medium, and low. Consequently, each SBU will fall into one of the nine boxes (for example, high industry attractiveness & high business strength, or low attractiveness & medium strength, etc.).
The general layout places the most promising position (high attractiveness, high strength) toward the top-left of the grid, and the least promising (low attractiveness, low strength) at the bottom-right.
Therefore, the matrix can be viewed as three broad zones diagonally across: the green zone (upper-left cells) where both industry outlook and competitive position are strong, the amber zone (diagonal cells from top-right to bottom-left) of medium or mixed prospects, and the red zone (bottom-right cells) indicating weak position in an unattractive industry.
In practice, companies often draw the matrix with coloured stoplight coding (green, yellow/orange, red) to highlight these three categories (Blackmore, 2024). Each SBU is represented by a circle placed in the appropriate cell; the size of the circle can be scaled to reflect the unit’s contribution to the company’s revenue or profits, giving additional visual insight into its significance. The GE‐McKinsey framework thereby presents a snapshot of the firm’s portfolio: it shows at a glance which businesses are positioned in fertile ground and which are in trouble.
Industry attractiveness (Y-axis)
“Industry attractiveness” refers to the overall appeal of the market or sector in which a business unit operates – essentially, how favourable the long-term profit opportunities are in that industry.
A highly attractive industry is one where a company can reasonably expect strong returns because the market conditions are favourable; by contrast, a low-attractiveness industry might be stagnant or intensely competitive, making it hard for any firm to thrive.
Unlike the BCG matrix (which used a single proxy like market growth rate), the GE approach evaluates industry attractiveness via multiple criteria (Jurevicius, 2025). Common factors used in this assessment include:
- Market size and growth rate: Is the industry large and growing quickly or is it mature/declining? High long-run growth prospects generally make an industry more appealing.
- Profitability and competitive dynamics: What are typical profit margins and are firms in this industry able to earn above-average profits? This involves examining competition intensity using tools like Porter’s Five Forces (e.g. strong entry barriers, weak supplier/buyer power and limited substitutes tend to increase attractiveness).
- Market structure and trends: The structure of the industry (fragmented vs consolidated) and long-term trends can influence attractiveness. For instance, an industry with favourable supply-demand trends, pricing power, or a benign regulatory climate will rate higher.
- Technology and innovation: The pace of technological change and innovation opportunities can be relevant. (A fast-evolving tech sector might be attractive due to growth, but it could also entail higher uncertainty.)
- Macro-environment factors: Broader factors like economic growth, demographic shifts, social trends, and political/regulatory conditions (often analysed via PESTLE) can raise or lower the future attractiveness of a market. For example, an industry benefiting from supportive government policy or a surge in consumer demand trends will score well on this dimension.
Analysts will assign each industry a rating (e.g. high, medium, low or a numerical score) after considering such factors. Because this evaluation should be forward-looking, it is generally advised to focus on the long-term outlook of the industry rather than just current performance (Jurevicius, 2025).
For instance, a sector might appear only moderately attractive today, yet if it is expected to boom in coming years (due to emerging markets or new applications), that future potential should be reflected in the assessment.
Ultimately, the industry attractiveness score encapsulates how easy or difficult it will be for a business operating in that sector to achieve profitable growth.
An example of a high-attractiveness industry might be the renewable energy sector in the 2020s, which enjoys rapid demand growth and supportive policies.
In contrast, the traditional print newspaper industry would rate low in attractiveness, given declining readership and strong substitute pressures.
It is worth noting that the specific factors and their weights can vary by company or analyst – the key is to include all relevant dimensions that impact the profit potential of the industry under review.
Competitive strength of the business (X-axis)
The horizontal axis evaluates the competitive strength (or competitive position) of each business unit within its industry. This dimension asks: how well is the SBU positioned relative to competitors, and does it have the capabilities to succeed?
A business with high competitive strength has substantial advantages over rivals – for example a strong brand, large market share or superior technology – whereas a weak business unit is one struggling to keep up.
Again, multiple criteria are considered rather than a single metric. Key factors commonly used to gauge a business unit’s strength include:
- Market share and market share growth: A high relative market share often indicates a strong position (e.g. the SBU is a market leader or challenger). Moreover, the trend in market share matters – if the unit’s share is growing faster than competitors, it suggests improving strength.
- Brand equity and customer loyalty: Strong brand recognition, reputation for quality, and loyal customer base greatly enhance a business’s competitive clout. For instance, a product line with a trusted global brand (like a top electronics brand) will score high on this factor.
- Profitability and cost structure: The unit’s profit margins and overall financial performance relative to competitors are telling indicators. A business that can consistently achieve higher margins or lower costs than industry peers has a competitive edge.
- Core competencies and resources: Proprietary assets or capabilities – such as patented technology, superior R&D, efficient processes, talented workforce, or access to distribution channels – contribute to sustainable competitive advantage (often analysed through VRIO framework). For example, a company with unique intellectual property or technical know-how in its segment will be stronger competitively.
- Product differentiation and portfolio strength: The attractiveness of the SBU’s products (in terms of features, quality, or uniqueness) and the breadth of its product line can influence its position. If the business unit’s offering is highly differentiated or it dominates a niche that competitors find hard to match, that boosts its strength.
- Management quality and agility: Though harder to quantify, the effectiveness of the unit’s management team and its ability to adapt strategy can play a role in competitive success, especially in dynamic markets.
After evaluating such factors, the business unit is rated as having high, medium, or low overall competitive strength in its industry.
For example, consider two SBUs in the same industry: one may have 30% market share, a top brand, and economies of scale (clearly a high-strength business), while the other has only 5% share, a limited brand presence and no cost advantage (a low-strength unit).
Because multiple aspects are aggregated, companies often assign weights to each factor and calculate a composite score for competitive strength (Jurevicius, 2025). This ensures that the most important contributors to advantage (say, market share or proprietary technology) influence the outcome appropriately. I
(Table 1 below summarises example factors commonly assessed for each dimension of the matrix.)
| Industry attractiveness factors | Business unit strength factors |
|---|---|
| Market size and long-term growth rate | Relative market share in the industry |
| Industry profitability (e.g. typical margins, five-forces) | Unit’s profit margins and financial performance |
| Competitive intensity and rivalry in the sector | Brand strength and customer loyalty |
| Technological change and innovation opportunities | Unique resources or capabilities (e.g. IP, know-how) |
| Regulatory and social environment influencing the industry | Product quality and differentiation level |
| Macro-economic trends affecting future demand/supply | Efficiency and cost advantage in operations |
Table 1: Illustrative factors used to evaluate an industry’s attractiveness (left column) and a business unit’s competitive strength (right column). In practice, each company should choose and weight factors that are most relevant to its situation.
Using the GE‐McKinsey matrix for analysis
Constructing and applying the GE‐McKinsey matrix involves a structured process. In general, there are five main steps:
1. Identify and weight the factors for each dimension:
First, the company must decide which specific criteria will be used to assess industry attractiveness and competitive strength for its portfolio. It is crucial to select factors that make sense for the industries and businesses in question (as outlined above).
Once the factors are listed, weights are assigned to each factor based on importance. For example, a firm might decide that market growth rate is extremely important (25% weight) in determining industry attractiveness, while seasonality is less important (5%). The sum of weights for each dimension should equal 100% (or 1.0 in fractional terms).
Choosing appropriate factors and weights often requires expert judgement – large firms sometimes involve strategy consultants or experienced analysts at this stage to ensure the analysis will be meaningful (Jurevicius, 2025).
2. Rate each business unit on the factors:
Next, for every SBU or product line, gather data and evaluate it against each chosen factor. Typically a rating scale (for instance 1 to 5, or 1 to 10) is used, where a higher score indicates greater attractiveness or strength.
For instance, if “market size” is a factor under industry attractiveness, an SBU in a huge growing market might get a 5 (high), whereas one in a small niche might get a 1 or 2 (low). Similarly, under competitive strength, a unit with the top market share could be rated 5 for the “market share” factor, whereas a minor player might rate 1.
It’s important that the ratings are calibrated – often they are relative to competitors or industry benchmarks. This step can involve substantial research and analysis, since it requires factual assessments (market data, financial metrics, etc.) combined with informed estimates for qualitative aspects.
3. Calculate weighted scores:
Once each SBU has a rating for each factor, compute the weighted score by multiplying each factor’s rating by its weight and summing them up. This yields an aggregate attractiveness score and an aggregate strength score for every business unit (Jurevicius, 2025). For example, an SBU might score 3.3 out of 5 on industry attractiveness and 2.8 out of 5 on competitive strength after this calculation. These composite scores place the SBU somewhere along each axis of the matrix.
In practice, companies may define thresholds for what counts as “High”, “Medium” or “Low”. For instance, on a 1–5 scale, a score above 3.5 might be classified as high attractiveness, 2.5–3.5 as medium, and below 2.5 as low (the cut-offs can be adjusted to yield a roughly three-way split of the portfolio). The accuracy of the matrix heavily depends on this step – if the scoring is done objectively and based on good data, the resulting portfolio picture will be credible. Conversely, subjective or biased ratings could mislead decisions, so companies strive to bring rigor to this analysis.
4. Plot the business units on the matrix:
With the two scores (attractiveness and strength) for each SBU, the next step is to plot each unit as a circle on a 3×3 grid in the corresponding cell.
For clarity, one axis (usually vertical) is labelled Industry Attractiveness (low to high) and the horizontal axis is Business Strength (weak to strong).
Each SBU’s circle is positioned according to its two scores.
Additionally, as mentioned, the size of the circle can be scaled to reflect the SBU’s importance (often using its revenue share or asset share in the company).
For example, if Business A contributes 30% of total revenues and Business B contributes only 10%, then Business A’s circle would be drawn roughly three times larger than B’s on the chart.
Many practitioners also annotate the circles with the SBU’s name or an abbreviation for easy identification.
The result is a portfolio map: perhaps you have one cluster of large circles in the top-right (strong units in good industries), a few medium circles in the middle, and some small ones in the bottom-left, etc. This visualisation is extremely useful for discussions, as it conveys complex information (multiple factors across many businesses) in an intuitively simple layout. Managers can literally see “where we are” strong or weak.
5. Analyse the matrix and derive strategic recommendations:
Once the SBUs are plotted, the final and most crucial step is interpreting what the map is telling you and deciding on strategic actions.
The nine cells are commonly grouped into three broad strategic categories: Invest/Grow, Selectivity/Earnings, and Harvest/Divest (Blackmore, 2024). These correspond to high, medium, and low combinations of attractiveness and strength, respectively.
The idea is that each category of positions calls for a different resource allocation approach, as explained below:
Invest/grow (high attractiveness, high strength) –
Business units in any of the green-zone cells (for instance, an SBU with strong competitive capabilities in a highly attractive industry) should receive investment priority. These are the future winners that promise high returns if properly funded. The strategy is to invest aggressively for growth: allocate capital for expansion, innovation, and increasing market share. A company should ensure these SBUs have all the resources needed to sustain their competitive advantage and capture the booming market opportunities.
For example, a tech company might find that its cloud services unit scores high on both dimensions – it competes well and the cloud industry growth is high. That unit should be given ample budget and support (for R&D, marketing, acquisitions, capacity expansion, etc.) to maximise its potential.
The underlying principle is to grow the winners: they are in “sweet spot” markets and already have strength, so additional investment is very likely to yield excellent returns (Jurevicius, 2025).
Selectivity/manage for earnings (medium or mixed positions) –
Units falling into the intermediate amber cells (medium attractiveness and/or medium strength, or high in one dimension but low in the other) require more nuanced judgment. These businesses are neither obvious stars nor clear dogs – their future is uncertain and they may need selective investment.
The general recommendation is to invest selectively: only commit additional funds if specific conditions are met (such as a clear avenue to improve the unit’s competitive position, or if surplus cash is available after funding the top-tier businesses). Otherwise, manage them for earnings – i.e. expect them to produce modest profits with only maintenance investment.
For example, an SBU in a very attractive industry but currently with a weak competitive position presents a dilemma: the company should only pour money in if there is a believable strategy to turn around its fortunes (Blackmore, 2024). Perhaps by focusing on a niche segment or leveraging a partnership, the unit could become viable; in that case, selective investment is justified. If not, it might eventually belong in the divest category despite the industry’s appeal.
On the other hand, a strong business in a fading industry would be advised to milk profits cautiously – it might not warrant major new investment, but if it still generates cash, the firm can keep it running efficiently and use the proceeds elsewhere. Essentially, for all these mid-range cases, management must decide on a case-by-case basis whether to invest, hold, or begin phasing out, depending on the unit’s prospects and the company’s broader strategy.
Harvest/divest (low attractiveness, low strength) –
SBUs plotted in the red-zone cells (weak competitive position in an unattractive industry) are prime candidates for harvesting or divestment. These are businesses with poor performance in tough environments, offering limited upside. The sensible strategy is usually to minimise further investment – do not throw good money after bad.
If the unit still generates some cash flow, a harvest approach can be taken: continue operations but only invest the bare minimum needed to maintain the business, allowing it to produce cash which can be siphoned to fund better opportunities (this is analogous to treating it like a BCG “cash cow” if it yields surplus cash) (Jurevicius, 2025).
Over time, as the market declines or the unit erodes, the company should be prepared to exit. Indeed, if a business is consistently unprofitable or has no strategic value, it should be divested (sold off) or liquidated to cut losses.
A real-world illustration was the decision by Microsoft to eventually retire Internet Explorer: by the late 2010s, the web browser had lost most of its market share (weak competitive position) and the browser market itself had become commoditised and less profitable – effectively a harvest/divest scenario.
Microsoft reduced support and development for IE and shifted focus to a new browser, which exemplifies a harvest strategy followed by an exit (Blackmore, 2024). In general, companies should be brutally realistic about red-zone businesses; unless there is a compelling reason (e.g. they provide a synergy or necessary complement to other units, a factor the matrix itself doesn’t capture), continuing to invest heavily in them is usually destroying value.
After determining which category each SBU falls into, management can then prioritise investments accordingly. Therefore, the GE‐McKinsey matrix serves as a guide for resource allocation across the portfolio (David, 2009). It tells executives where to focus strategic efforts: invest in the future winners, cautiously manage the maybes, and trim the losers.
However, it should be emphasised that the matrix is a starting point for discussion, not an automatic decision-maker. Human judgment is needed to account for nuanced considerations beyond the matrix’s scope, such as potential synergies between SBUs, or new industry developments on the horizon.
Real-world application of the matrix
The GE‐McKinsey matrix has been applied in practice by a range of organisations, from industrial conglomerates to modern tech companies.
General Electric’s own experience in the 1970s was a proof of concept for the framework: by plotting its ~150 business units on the nine-box grid, GE identified many units in the lower-right zone which it subsequently divested or scaled down, while funnelling investment into high-potential areas. This portfolio restructuring was credited with improving GE’s overall performance in the ensuing years (McKinsey & Company, 2008).
The matrix gave GE a clearer strategic focus – for instance, it doubled down on businesses like power systems and high-end electronics (attractive markets where GE was strong), and it exited weaker businesses such as some domestic appliances where it lacked an edge. In effect, GE used the analysis to prioritise investments and manage its vast empire more rationally.
In contemporary settings, the matrix remains useful. For example, consider Alphabet (Google’s parent company) as a multi-business tech giant: using a GE‐McKinsey approach, Alphabet might place Google Search and YouTube in the invest/grow category (both businesses enjoy dominant positions in large, growing markets), while a smaller unit like Google Fiber might land in selectivity/earnings (a promising idea but in a challenging, capital-intensive telecom industry).
Indeed, tech firms often have to decide which experimental projects to scale up and which to shut down; a portfolio matrix can aid such decisions by comparing the relative prospects of each project.
Another concrete example is Netflix’s strategic shift around 2007–2010. Netflix had a traditional DVD-by-mail business (which by then was a medium-attractiveness market) and a nascent video streaming business. The streaming unit initially was small, but it operated in a nascent industry with explosive growth potential.
Netflix rightly evaluated streaming as a high-attractiveness opportunity and recognised its own improving strength (especially as competitors like Blockbuster faltered). Consequently, management allocated major investments to the streaming SBU – an invest/grow decision that proved enormously successful, as streaming became Netflix’s core business and propelled it to dominance in a now thriving industry (Blackmore, 2024).
On the other hand, Netflix allowed the DVD business to fade out (a harvest strategy) once streaming took off. This illustrates how the matrix’s logic can guide real strategic moves: investing in the business with the bright future and harvesting the one in decline.
It is worth noting that companies sometimes adapt the GE‐McKinsey framework to their particular context. Different industries might emphasize different attractiveness criteria. In some sectors, market share may not guarantee strength if, for instance, network effects or ecosystem synergies are at play – so firms will incorporate those considerations into the analysis. The framework is flexible, and managers often supplement it with additional tools.
Overall, though, the GE‐McKinsey matrix’s core insight – systematically comparing businesses on key dimensions to inform strategy – has proven applicable across industries ranging from consumer goods to finance to technology (Blackmore, 2024).
Academic studies have also demonstrated its usefulness; for example, one study applied the matrix to fashion companies to help them allocate resources among brands (Amatulli et al., 2011).
In practice, many corporations integrate this matrix (or a variant of it) into their annual strategic planning cycle as a way to review the health of their portfolio and ensure investment decisions align with long-term strategy.
Advantages of the GE‐McKinsey matrix
The enduring popularity of the GE‐McKinsey nine-box matrix is largely due to the valuable benefits it offers as a strategic planning tool. Key advantages include:
- Comprehensive portfolio view: The matrix forces management to take a broad, comparative look at all business units together. This big-picture view helps ensure that resources are allocated to the best opportunities, rather than on a first-come or siloed basis. It provides a systematic framework to compare diverse businesses on consistent criteria (McKinsey & Company, 2008).
- Prioritisation of investment: By categorising SBUs into invest, hold, or divest zones, the matrix clearly indicates priority areas. This guides companies to direct capital and attention where it will yield the highest returns (David, 2009). It is a practical aid to resource allocation, making corporate-level decision-making more objective.
- Multi-factor analysis: Unlike simpler models, the GE matrix incorporates multiple factors for each dimension, leading to a more nuanced assessment (Jurevicius, 2025). It recognises that competitive strength is not just market share, and industry attractiveness is not just market growth. This multifaceted approach makes the analysis more robust and tailored to reality.
- Enhanced strategic insight: The process of evaluating each business on key factors increases managerial understanding of what drives success in each industry and unit. It can unveil important insights – for example, managers become aware of weaknesses they need to address in a particular SBU, or realise an industry’s outlook is dimming. Thus, it encourages data-driven strategic thinking and discussions grounded in analysis.
- Communication and consensus-building: The visual nature of the nine-box grid is a great communication tool. Complex information is distilled into an easy-to-interpret chart, which helps managers and stakeholders reach a common understanding of the portfolio. It’s often easier to explain and justify strategic moves (e.g. divesting a division) by pointing to its position on the matrix. This way, the framework aids consensus-building around tough decisions.
- Applicable across industries and timeframes: The GE matrix framework is versatile – it can be applied to product lines, brands, geographical divisions, or any units whose performance and context need evaluating. Moreover, it’s useful for both short-term and long-term planning. Strategists can plot the current position of businesses and also project future positions by considering trends (adding arrows on the chart to show trajectory). This makes it a living tool that can be revisited regularly as conditions evolve.
Limitations and critiques
Despite its strengths, the GE‐McKinsey matrix is not without limitations. Users should be mindful of the following potential drawbacks and critiques:
- Complexity and data demands: Implementing this matrix requires extensive data collection and analysis. Determining industry attractiveness and business strength involves multiple variables – gathering reliable information for each factor (market forecasts, competitor data, etc.) can be time-consuming and costly. Smaller firms might find it burdensome to perform such analysis for all their units. Additionally, the scoring and weighting process can become complex, and the outcome is sensitive to how factors are weighted. Using consultants or experts to improve accuracy (while helpful) further raises the cost (Jurevicius, 2025).
- Subjectivity in scoring: While the framework aims to be analytical, many inputs to the matrix are ultimately subjective estimates. Management bias can creep in when rating their own business units, potentially overestimating the attractiveness of industries they are in or the strength of their pet projects. Because there is no single “objective” scale for some factors (e.g. quality of management), different analysts might score the same unit differently. This subjectivity means the matrix’s results should be taken as indicative rather than absolute. Sensitivity analysis (examining how changes in ratings affect placement) is advisable to check the robustness of conclusions (Blackmore, 2024).
- A static snapshot: The GE matrix provides a snapshot in time of where each business stands currently. It does not inherently show how industries or competitive positions are changing. A rapidly evolving industry might be attractive today but could implode tomorrow due to disruption – the matrix would not reflect that unless manually updated or supplemented with trend analysis. Similarly, a weak business might have a new innovation in development that will greatly strengthen it next year, but the matrix only captures its present status. In fast-moving sectors (like technology or digital media), this static nature is a serious limitation (Blackmore, 2024). Strategic decisions solely based on the current snapshot may misfire if the future turns out differently. For this reason, companies often extend the analysis by considering future movement (adding arrows for expected direction of each SBU on the grid, as described earlier).
- Ignores synergies and interdependencies: The GE‐McKinsey framework evaluates each business unit in isolation, but in reality SBUs can have important synergies or strategic links with each other. For example, one division might be unprofitable but is kept because it provides a component for another division’s product, or it helps block a competitor. The matrix would likely place that supportive SBU in a harvest/divest box if judged on standalone merits, which might be misleading. Likewise, two businesses together might create a capability that’s valuable (the whole being greater than sum of parts), which the matrix doesn’t capture (Jurevicius, 2025). Thus, a rigid application of the matrix could result in divesting units that actually have strategic value in combination with others. Managers must overlay strategic common sense about synergies and corporate fit, which the model intentionally leaves out for simplicity.
- Limited guidance on implementation: The matrix can tell what the portfolio mix looks like and broadly which direction to consider (grow, hold, or exit), but it does not tell how to implement those decisions. For instance, if an SBU is in the invest category, the matrix doesn’t specify whether to invest in marketing versus R&D, or how to overcome specific competitive weaknesses. Similarly, for a divest decision, the matrix won’t detail whether to sell the unit outright, spin it off, or gradually wind it down. In practice, further strategic analysis and planning are required to execute the high-level recommendations from the matrix (Wind et al., 1983). In other words, the nine-box framework is a tool for portfolio prioritisation, not a substitute for detailed business unit strategies.
- Not a predictive model: Lastly, the GE matrix is ultimately a descriptive analytical tool – it can rank business units, but it cannot predict external changes or guarantee success. Unexpected events (new regulations, economic shocks, disruptive competitors) can quickly alter industry attractiveness or a firm’s competitive position, rendering the analysis outdated. Especially in emerging or volatile industries, the matrix’s guidance might be of limited duration (Blackmore, 2024). Managers should be cautious about relying on it exclusively; it should be complemented with scenario planning and continuous market watch.
In light of these limitations, it is clear that the GE‐McKinsey matrix should be used with care and not as a standalone oracle. It is a valuable framework to structure thinking, but strategic decisions require combining its insights with sound judgment, up-to-date intelligence, and other analytical tools. Many of the criticisms above were raised by strategists in the 1980s when portfolio models were in vogue, and they remain relevant considerations for today’s users (Wind et al., 1983). The matrix is best utilised as part of a broader strategic planning process rather than a mechanical formula.
Struggling with a GE-McKinsey matrix assignment or any other type of management coursework? Get personalised support from UK-qualified management experts and boost your grades. Visit our management assignment help page to find out more.
References and further reading:
- Amatulli, C., Caputo, T. and Guido, G. (2011) ‘Strategic Analysis through the General Electric/McKinsey Matrix: An Application to the Italian Fashion Industry’, International Journal of Business and Management, 6(5), pp. 61–71. Available at: https://ccsenet.org/journal/index.php/ijbm/article/view/10429 (Accessed: 30 September 2025).
- Blackmore, L. (2024) ‘McKinsey GE Matrix: Importance & How To Use It’, Cascade Strategy Blog, 30 December. (Updated 24 January 2025). Available at: https://www.cascade.app/blog/ge-matrix (Accessed: 29 September 2025).
- Jurevicius, O. (2025) ‘GE McKinsey Matrix – Strategic Management Insight’, StrategicManagementInsight.com, 16 June. Available at: https://strategicmanagementinsight.com/tools/ge-mckinsey-matrix/ (Accessed: 29 September 2025).
- McKinsey & Company (2008) ‘Enduring Ideas: The GE–McKinsey nine-box matrix’, McKinsey Quarterly, 1 September. Available at: https://www.mckinsey.com/capabilities/strategy-and-corporate-finance/our-insights/enduring-ideas-the-ge-and-mckinsey-nine-box-matrix (Accessed: 28 September 2025).
- David, F.R. (2009) Strategic Management: Concepts and Cases, 12th edn. Upper Saddle River, NJ: Pearson/Prentice Hall. (Resource allocation and portfolio analysis discussion).
- Wind, Y., Mahajan, V. and Swire, D.J. (1983) ‘An empirical comparison of standardized portfolio models’, Strategic Management Journal, 4(2), pp. 181–191. (Critique of portfolio planning models and their limitations).
Cite This Work
To export a reference to this article please select a referencing stye below:


