Statistical Analysis on the Connection between Electronic Devices and Sleep Quality
| ✅ Paper Type: Free Essay | ✅ Subject: Psychology |
| ✅ Wordcount: 3049 words | ✅ Published: 18 May 2020 |
|
INTRODUCTION |
INTRODUCTION
Statistics is a type of mathematics relating the collection, analysis and interpretation of numerical facts or data. [i] Statistical analysis can be used to establish if results from an experiment or investigation support the original hypothesis. Statistics are used all over the world in a variety of fields, including different industries and businesses, trade, physics, chemistry, economics, mathematics, biology, botany, psychology and astronomy. [ii] They are used to determine facts and figures and play an important role in the growth of the world.
The purpose of this investigation is to access, evaluate and compare the data sets found in results conducted from a survey to assist in answering the question “Is there a connection between the use of electronic devices and quality of sleep?”. The year 9 students from three GAIL schools, Scotch College Adelaide, Prestige College South Africa and Woodstock School India, completed the survey. Through the use of statistics, different mathematical areas will be covered and the relationship between electronic devices and sleep will be determined.
This report will begin by analysing the data that has been collected and the processes used to collect this data. This is Part A. Part A will discuss where the data has been collected from, the type of sampling method that was used, the type of data that was collected, and whether any bias was involved. All relevant definitions will also be provided.
Part B will display and provide in-depth analysis of the data from the survey. The data will be separated into 5 distinct questions. Question 1 will look at personal electronic devices and social media. It will discuss the most common personal devices and the most common forms of social media, and the potential distraction caused in the classroom by these devices and social media. Graphs made using Excel will show visual representations of the data. Question 2 will analyse and discuss the data regarding the use of technology throughout the school day. It will discuss the mode using an Excel graph and the effects this can have on productivity in the classroom. Question 3 involves the analysis of how often students from each school spend on their devices within 5 separate time intervals. This will be shown using box plots and 5-number summaries. The differences, trends and the mean in the data will be discussed. The total average time spent on devices after school hours, the range and the interquartile range are shown and discussed. Question 4 analyses and compares the common trends of technology while students are in bed. This is shown using Excel graphs. Finally, Question 5 explores whether students feel well rested in the morning when they wake up and the reasons for this.
Part C includes analysis and further research on articles about the required amount of sleep, the impact electronic devices have on sleep and the Science behind the effects. It will summarise the articles and link them to the data.
Finally, all of the results will be summarised and assumptions and limitations of the investigation will be discussed.
|
PART A | Collecting Data |
PART A
A sample is a part or a quantity of a whole, intended to represent what the whole is like. The Collins Dictionary definition is:
“A sample of a substance or product is a small quantity of it that shows you what it is like.”[iii]
Samples are used when the whole (the population) is too large to retrieve data from. In this case, the sample is the year 9 students from Scotch College Adelaide, Kristin School New Zealand. In other situations, the sample can be parts of a product (e.g. a paint sample or makeup sample), sample drawings or samples of food.
There are various types of sampling methods. In this case, accessibility sampling was used (also known as convenience sampling). Accessibility sampling is a type of sampling where the samples are selected because of their convenience and proximity. Accessibility sampling was used in this situation because the sample was easy to find and collect. It was an easy process to create the survey and for the students from different places in the world to answer the survey in a short amount of time. Other types of sampling include SRS (simple random sampling), stratified random sampling and multi-stage sampling. [iv]
|
1 |
Please identify which GAIL school you are from. |
Categorical |
|
2 |
Select which best describes your status at Scotch. |
Categorical |
|
3 |
Which personal electronic devices do you commonly use? |
Categorical |
|
4 |
What social media do you often use? |
Categorical |
|
5 |
Which personal device do you predominately access social media on? |
Categorical |
|
6 |
During school hours, how much time do you spend on technology? |
Numerical |
|
7 |
Approximately, how many hours per day do you spend on your personal device between finishing school and bed time? |
Numerical |
|
8 |
Do you use your devices within 1 hour of going to bed? |
Categorical |
|
9 |
Do you use your device when you are in bed? |
Categorical |
|
10 |
If so, approximately, how many hours would you normally use your personal device for when you are in bed? |
Numerical |
|
11 |
Which devices do you have within reach at night? |
Categorical |
|
12 |
Do you check your device immediately upon waking? |
Categorical |
|
13 |
Approximately, how many hours of quality sleep do you usually get during school nights? |
Numerical |
|
14 |
Do you feel rested on waking in the morning? |
Categorical |
The survey, powered by Survey Monkey, consisted of 14 questions about social media and electronic device usage in relation to sleep and wellbeing. Survey Monkey is an online, easy-to-use survey maker used globally. [v] The questions in the survey can be classified as either categorical or numerical.
Categorical data is multiple choice questions representing characteristics. They can also be called qualitative data and yes/no data. The data where the It is data that is split up into groups and cannot be measured or counted. In this case, an example of categorical data is question 3 – “Which personal electronic devices do you commonly use?”. This question can be answered by selecting one or more of the multiple-choice answers. If the answer suited isn’t on the question, the person can choose “other”.
Numerical data is displayed in numbers, representing a time, measurement, etc. In this case, an example of numerical data is question 6 – “During school hours, how much time do you spend on technology?” This question can only be answered using time, such as “120 minutes” or “5 hours”. This involves numbers rather than a multiple-choice answer.
The questions from the survey are attached to the right, displaying whether they are categorical or numerical data.
Surveys and data can commonly be “biased”. This means that personal opinions can impact someone to act a certain way. The Cambridge definition is:
“The action of supporting or opposing a particular person or thing in an unfair way, because of allowing personal opinions to influence their judgment”.
In this situation, if the survey was biased, the questions would be encouraging you to respond in a certain way rather than being open to any opinion. This survey questions weren’t biased in any way – there were various answers to select, none which were encouraging the students to respond in a certain way. Every question either had various multiple-choice answers, including a “other” choice (categorical data) or had the option to write whichever number suitable (numerical). But, there is a big bias in the survey. The survey only considers year 9 students’ opinions from the three schools. Every Kristin School year 9 student completed the survey and skipped no questions, while the year 9 students at Scotch College did skip some. These students are a small sample of the population and the survey limits the results to these students’ opinions, rather than the results from different year levels at different schools, or even results from people of different ages/professions worldwide. Different students in year levels and schools can have different opinions, rules and expectations which could easily change the overall results. For example, a year 12 female might have different result compared to a male in year 5, or on a larger scale, a 60-year-old male will likely have different results to a 15-year-old female. This means that overall, the survey is biased. If the survey consisted of a random sample from people across the world of different ages, genders, professions and lifestyles, the results would be significantly more accurate when answering the question “Is there a connection between the use of electronic devices and quality of sleep?”.
|
PART B | Displaying and Analysing Data |
-


Analyse the information collected regarding personal electronic devices and social media. Use graphs as a visual representation and discuss what effects this can have on productivity within the classroom? Make comparisons with at least one other GAIL school.
Q1) When analysing the data, it can be seen that the most popular devices used by year 9 students at Scotch College are mobile phones and laptops. This can be indicated by the two peaks in the column graph. The reasoning behind these results would be because a mobile phone is easily the most common tool of accessing social media and communication, and laptops is the most common tool used within the school for learning. Compared to Kristen the results are very familiar as can be seen by the spikes in the graph but what also can be seen in the graph is that Kristen has a less overall percentage of mobile phones compared to scotch.
- Calculate the Measures of Centres for technology use throughout a school day and comment on the information found. How does this compare to other GAIL schools? Are there any further connections that can be made with Question 1? Use an appropriate graph to represent this data.
|
Scotch |
New Zealand |
|
|
Mode |
4 hours |
4 hours |
|
Median |
4 hours |
3.75 hours |
|
Mean |
3.9 hours |
3.51 hours |

The graph displays the mean median and mode of time on technology during school hours, it shows that Scotch uses technology for around 4 hours and Kristen uses technology for about 3.5 to 4 hours during school. These graphs and results were made using equations within the application Microsoft Excel. This can have a relation to distraction within school as this technology has multiple uses including playing games and going on social media. In comparison with each other Kristen has a more consistent result within the graph where as Scotch is just a straight result other than a small difference in the mean.
-
Using Questions 7-11 from the survey, construct a 5-number summary and box plot for each time interval.
Time Interval 4pm – 7pm
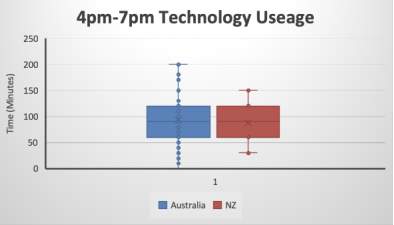
Figure 1
Australia
Min-0
Q1-60
Q2-90
Q3-120
Max-200
New Zealand
Min-30
Q1-60
Q2-90
Q3-120
Max-150
- Compare and comment on the trends identified by your results
A box plot graph displays the information in an easy and readable way. This shows that New Zealand and Australia have the same Q1 Q2 Q3, the reasoning behind this is because Kristen and Scotch are very similar in the way they teach and format the schools. Even though Q1 Q2 Q3 are the same Australias results are different as the spread is much larger than New Zealand by 50
- Using excel, calculate the mean. Discuss your results.
|
Scotch |
NZ |
|
|
Mean |
92.89 |
88.33 |
These results display that Scotch had a higher mean than Kristen school when it comes to Technology Usage from 4pm – 7pm with a result of 92.89 and Kristen with 88.33 this shows that Scotch uses technology in this time more than Kristen does.
- Calculate the range and IQR and discuss your results.
|
Scotch |
NZ |
|
|
IQR |
60 |
60 |
The Inter Quartile Range (IQR) is used to show the spread of all the data. This table shows that Scotch had the same amount of spread as New Zealand they have the same kind of spread and are equal in range. This would have to do with what was stated previously about how the schools are very similar in how they conduct things.
-


Calculate the total average time spent on a device after school for a Scotch studentSchools
Scotch
NZ
Time Spent on Electronics
92.89
88.33
These graphs display the time spent on electronic devices from 4pm to 7am by scotch students. This shows that most kids spend time on electronics from 4pm-7pm and 7pm-10pm this shows a consistency. Another consistency is that of the last 2 results that show 7.45% of kids use electronic devices from 1am-4am and 2.73% use devices from 4am-7am. The final result that hasn’t been mentioned yet would be the kids from scotch using electronics from 10pm-1am, this is a very different percentage compared to the other 4 results this would be described as an outlier. An outlier is a figure/data/result that is marginally different from the other figures/data/results. The reasoning behind only Scotchs results being turned into a graph and not Kristin school is because it displayed the best example of the two of an outlier within data.
- Analyse and compare the common trends of technology use whilst in bed. Make comparisons between a Scotch student and students from other schools.

This graph displays Scotch and Kristen’s average time spent on devices whilst in bed these two results are very different from each other and have a very wide ranged spread. In comparison scotch students spend almost an hour on their phone in bed. Whereas Kristen school spend about 37 minutes. This data complies with the data shown above, the previous data displays the time spent on devices until the average times of going to bed. Whereas this graph and data shows time spent on devices while in bed, this makes it back to the research question that students can’t get to bed and be well rested when on their devices. This idea will resurface within question C
- Through the use of graphs, identify and discuss how students ‘feel’ in the morning.


These two graphs show a very useful bit of data to answer the research question. These results would come from the amount of sleep and device usage throughout the days. As can be seen their almost equal in percentage except that In the “All the time” category there is no data to be shown for Kristen school. This means that not a single student at Kristen always feel well rested, when comparing this single statistic to the other results this would be described as an outlier as it is such a marginally different result compared to any of the others, but there is more than one outlier within these results. Another outlier would be the sometimes result, this is because it almost double the amount as the next closest result. Linking this back to the other questions scotch had the longest time spent on phones whilst in bed but showing to have higher percentages of people feeling well rested.
|
PART C | Further Research |
ANALYSIS:
The articles indicate the recommended average amount of hours needed to get a good nights worth of sleep and shows results for multiple age groups. This article also displays how important sleep is to us and why its so important to change how much sleep we need it continues to speak about what the reasoning for teenagers having such a large desire to stay up late and stay on the devices. Another article to be discussed is ‘https://www.sleepfoundation.org/articles/why-electronics-may-stimulate-you-bed’ this article goes on to talk about the science behind sleeping and what reasons there would be for not wanting to go to bed and wanting to stay up later, it talks about the hormones within people that affect their sleep pattern, it also states ‘The more electronic devices that a person uses in the evening, the harder it is to fall asleep or stay asleep.’ This is because the bright lights within the screens and the colours cause your brain to become more alert and therefore more active eventually equalling you to be more awake this goes for child and adult age does not matter the result is still the same.
|
CONCLUSION |
PARAGRAPH 1: Summary of your results.
Within the entire folio it is clear to see that there is a link to device use and sleep patterns, this is displayed using neat and readable graphs and data. Within part A it was established that the data was from a survey given out to a single year of multiple schools. Students were given the results and told to display any links shown between the survey questions and if the students felt well rested and were also told to compare to at least 1 other school
Within part B, all survey questions were discussed and connections were made to determine if the use of technology has any effect on the quality of sleep. Firstly, it was established that the most common form of technology was a laptop as it is compulsory in the two schools chosen to be compared but in a very close second was a mobile phone this would be because of how common, efficient and useful these devices are for everyday life.
Within part C a news article on how devices affect sleep pattern is analysed to show a professional point of view of what is trying to be discussed, it is a much more in depth version of the results shown as it goes in to hormones and the human brain where as this folio did not contain anything to do with hormones and brain activity
Identify all assumptions – each must be linked to its potential limitation
Assumptions made throughout the making of the folio would be the possibility of some people taking the survey as a joke and not completing with correct answers making the data not accurate and creating some possible outliers. Another assumption to be made would be the possibility of graphs being created incorrectly due to technical errors via the graph making software.
|
BIBLIOGRAPHY |
- [i] Definition Of Statistics 2018, Business Dictionary, accessed 23 August 2018, <http://www.businessdictionary.com/definition/statistics.html>.
- [ii] Statistics In Different Fields 2018, MathZone, accessed 23 August 2018, <https://www.emathzone.com/tutorials/basic-statistics/importance-of-statistics-in-different-fields.html>.
- [iii] Definition of Sample 2018, Collins Dictionary, accessed 14 August 2018, <https://www.collinsdictionary.com/dictionary/english/sample>.
- [iv] Types of Sampling 2018, accessed 14 August 2018, <https://web.ma.utexas.edu/users/parker/sampling/srs.htm>.
- [v] SurveyMonkey 2018, accessed 14 August 2018, <https://www.surveymonkey.com/>.
Cite This Work
To export a reference to this article please select a referencing stye below:
Related Services
View all


DMCA / Removal Request
If you are the original writer of this essay and no longer wish to have your work published on UKEssays.com then please click the following link to email our support team:
Request essay removal