Organisational Commitment Study Research Methodology
| ✅ Paper Type: Free Essay | ✅ Subject: Psychology |
| ✅ Wordcount: 2418 words | ✅ Published: 05 Apr 2018 |
Table of Contents (Jump to)
- Gathering of Data
- Organisational Commitment
- Job Satisfaction
- Job Descriptive Index and Job in General
- Stress in General
- Human Resource Management Practices (HRM)
- Trust in Management
- Turnover Intention
- Turnover
Research Methodology
Introduction
This chapter addresses the research methodology used in the study of Organisational Commitment, its’ antecedents and consequences as described in the first chapter. The first section of this chapter after the introduction presents the research design. Sample and population are presented in the second section. The third section looks at measuring instrumentation, reliability, validity and scoring techniques. The third section looks at data gathering procedures. The fourth section describes methods for statistical analysis. The last section summarises this chapter.
Research Design
This study used a relational research design to determine the relationship between antecedents and consequences of organisational commitment. Research into organisational commitment is largely dependent on the perceptions of employees and employers. Perceptions are generally acquired through subjective self-reports or opinion. A design based on surveys is therefore appropriate. Relational surveys empirically examine the relationships between two or more variables, constructs, and/or factors. Descriptive surveys are primarily used to provide personal and demographic information. Correlation studies are used to: measure relationships; check consistency of those relationships; and to make predictions. This allows the researcher to test hypotheses by confirming or refuting their predictions which is consistent with Grounded Theory and the formation of theoretical frameworks. It follows that predictive validity is most often achieved by statistical methods such as correlation and regression (Saunders et al, 2009).
Sample
Population
The population of the study is all past and present employees of company X.
Sample Selection
Given that this company is a small specialised Information Technology consulting company with a small population (n = 25) all employees were approached to participate. Electronic survey links were sent to the entire population and 100% response rate was achieved where all of the respondents completed all of the surveys.
Sample Size
Sample size determines statistical significance in a relationship. The central limit theory dictates that the larger the absolute size of the sample the closer the more likely it is to have a normal distribution. It has also been shown that the minimum sample size of 30 will produce a normal distribution or near normal distribution (Stutely, 2003).
DeVaus (2002) provides this formula to calculate minimum sample size:
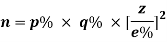
Where:
 is the minimum sample size required
 is the proportion belonging to the specified category
 is the proportion not belonging to the specified category
 is the z value corresponding to the level of confidence required (see Table A2.1)
 is the margin of error required
Table 1 – Confidence Levels and associated z values
| Level of Confidence | z |
| 90% | 1.65 |
| 95% | 1.96 |
| 99% | 2.57 |
This formula is used for small populations:

Where:
 is the adjusted minimum sample size
 is the minimum sample size (as calculated above)
 is the total population
Saunders et al. (2009) advise that, in cases where the population is less than thirty, data should be collected from the entire population. There are limitations associated with minimum size. In particular the margin of error cannot be smaller than the reciprocal of the population. It follows that in order to achieve a 5% margin of error the minimum sample size required is calculated thus:

where is the sample size
Applying the DeVaus (2002) formulae to the sample in this study requires the whole population if a confidence interval of 95% and 5% error is to be achieved.
Procedures
The researcher requested permission from the Managing Director of the organisation to conduct interviews and circulate surveys among the employees. In addition permission was granted to access human resource management records and employer/employee correspondence where legal, relevant and appropriate to the study. The researcher is an employee of the organisation with free access to the employees which facilitated the ease of data gathering and clarification where necessary. Most of the group are in possession of post graduate degrees and a number have a Masters level qualification which further facilitated the process as the group all have a deep understanding and appreciation for the process.
An employee meeting was called in the presence of the Managing Director where it was explained that the participation in the study was optional or voluntary, anonymous, and that the information would be treated confidentially. In order to avoid any peer group pressure, no discussion was entertained in the group information session and employees were invited to discuss any interest or concerns directly with the researcher in private. It is interesting to note that all employees wanted to participate and most had no desire to remain anonymous inviting the researcher to discuss any aspect of their responses with them.
Three approaches were used during the gathering of data: Online Surveys; Interviews; and Analysis of Human Resource records and employee correspondence.
Surveys are a popular, economical and convenient way to collect standardised data which facilitate easy comparisons (Saunders et al., 2009).
Unstructured interviews were conducted to: determine aspects of the organisations’ Human Resource Management practices; determine reasons for Turnover with ex-employees where exit interviews or detailed resignation explanations were not available or unclear; determine impressions of Turnover survivors for perceptions about Turnover reasons.
Human Resource records were used to determine biographical data such as: pay grade; age; tenure; absenteeism; education; and vacation habits
Turnover reasons were collected from exit interviews and employee correspondence.
Measuring Instrument
This study aims to determine the relationship between Stress, Turnover, Turnover Intention, Organisational Commitment, HRM practices and Job Satisfaction. The following instruments were used in surveys to measure the variables:
- Organisational Commitment: Allen and Meyer (1990)
- Job Satisfaction: Brodke et al.’s (2009) Revised Job Descriptive Index (JDI) questionnaire based on the original of Smith et al. (1969)
- Job Stress: Stress in General (SIG) questionnaire of Brodke et al. (2009)
- Management Trust: Trust in Management (TIM) Brodke et al. (2009)
- Turnover Intention: three point questionnaire baed on Sjöberg and Sverke (2000)
Gathering of Data
The online surveys were created in Google Forms using the organisations’ internal infrastructure which is hosted on Google Apps. Google Forms is part of the Google Apps suite and facilitates the creation, distribution, and collation of survey data electronically. The surveys were distributed from the facility in Google Forms by way of a link in an email. The anonymous survey responses are automatically collected and stored on Google Drive where the information is made available in a tabular format (Microsoft Excel).
Organisational Commitment
Organisational Commitment was measured using the Organisational Commitment Scales (OCS) developed by Meyer and Allen (1997). The reliability of the OCS has been demonstrated in numerous studies over the last two decades. The reliability of each of the scales can be seen through Cronbach’s alpha of: between 0.77 and 0.88 for affective commitment; 0.65 and 0.86 for normative commitment; and 0.69 and 0.84 for continuance commitment (Fields, 2002).
The OCS is comprised of 22 items measured on a 7 point Likert scale ranging from 1 (strongly disagree) to 7 (strongly agree).
Job Satisfaction
The Job Descriptive Index (JDI) was painstakingly developed by Smith, Kendall, and Hulin and published in their book, Satisfaction in Work and Retirement (1969). Patricia Cain Smith (1917-2007) relocated from Cornell to Bowling Green State University in the mid-1960’s bringing the JDI Research Group with her. The group has operated since 1959 with different members and is one of the longest running research groups in the field. They make their family of scales available free of charge to researchers. The scales include: the Job Descriptive Index (JDI) including the Job in General (JIG); Stress in General (SIG); and Trust in Management (TIM).
These scales consist of phrases and adjectives that describe facets of the job or the job overall. Participants select “Yes”, “No” or “?” in response to each word or phrase. “Yes” means the word or phrase describes the job. “No” means the word or phrase does not describe the job. “?” means that the respondent is unsure or cannot decide. The scales are scored 3, 0, & 1.5 for “Yes”, “No”, and “?” respectively.
The 2009 revision of the JDI, JIG, SIG and TIM are utilised in this study.
Job Descriptive Index and Job in General
The Job Descriptive Index (JDI) and Job in General (JIG) are self-report measures of job satisfaction. The JDI measures satisfaction with five facets of the job: attitudes towards co-workers, the work itself, promotion opportunities, remuneration and supervision. The JIG scale measures overall satisfaction with the job (Brodke et al., 2009).
There have been two major updates to the JDI since it was introduced by Smith, Kendall, and Hulin in 1969. The first update was made in 1985 (Smith et al., 1987) and the second was made in 1997 (Kihm, Smith, & Irwin, 1997). The JDI Research Group (Bowling Green State University, OH, USA) then updated the JDI family of scales in 2009.
Table 2 – Correlations among the JDI facets (Brodke et al., 2009)* lists correlations among the JDI scales which demonstrates that each of the JDI facets and the JIG measures a distinct aspect of job satisfaction and no facet correlates higher than 0.50 with any other facet. Cronbach coefficients above 0.80 or higher are considered to have high levels of reliability.
Table 2 – Correlations among the JDI facets (Brodke et al., 2009)*
| JDI Facets | Cronbach’s coefficient of alpha | Work | Pay | Promotion | Supervision | CoWorkers | JIG |
| Work | 0.90 | 1 | |||||
| Pay | 0.88 | 0.34 | 1 | ||||
| Promotion | 0.91 | 0.37 | 0.31 | 1 | |||
| Supervision | 0.92 | 0.42 | 0.31 | 0.41 | 1 | ||
| Co-Workers | 0.92 | 0.47 | 0.31 | 0.26 | 0.47 | 1 | |
| Job In General | 0.92 | 0.69 | 0.45 | 0.42 | 0.58 | 0.54 | 1 |
| * All correlations are significant at the 0.01 level (2-tailed). |
Table 3 – Validity Coefficients Pearson Correlations (Brodke et al., 2009) shows the correlations of the JDI facets with SIG and the single item measure of Overall Job Satisfaction: “Considering everything, how would you rate your overall satisfaction with your job?” rated on a five point scale from 1 (very dissatisfied) to 5 (very satisfied). Brodke et al. (2009) have shown that the JIG scale is a good predictor of Turnover Intention.
Table 3 – Validity Coefficients Pearson Correlations (Brodke et al., 2009)*
| JDI Facets | Turnover Intention | Feelings of Job Stress | Single Item Measure of Job Satisfaction |
| Work | -0.45 | -0.07 | 0.63 |
| Pay | -0.36 | -0.18 | 0.42 |
| Promotion | -0.36 | -0.1 | 0.42 |
| Supervision | -0.42 | -0.33 | 0.49 |
| CoWorkers | -0.33 | -0.28 | 0.44 |
| Job in General | -0.61 | -0.30 | 0.79 |
| * All correlations are significant at the 0.01 level (2-tailed). |
Stress in General
The relationships between workplace stress and negative personal and organisational outcomes are well documented. Stressors and Strains are important concepts related to stress. Stressors precede the experience of stress and strains are the outcomes of the stress experience.
The SIG is a measure of the experience of work stress, which emerges between the initial existence of work stressors and the resulting physical and psychological strains (Brodke et al. 2009).
This is the stress that is experienced as a result of work stressors prior to the acknowledgement of the strain. The SIG is thus a good measure of Job Dissatisfaction and predictor of Turnover Intentions.
The 2009 revision used in this study is based on the SIG scale developed by Stanton et al. (2001). Brodke et al. (2009) showed that this SIG scale shows a reliability coefficient of 0.79. Furthermore the scale correlates positively and significantly with the Faces stress measure (r = 0.54, p < 0.01) indicating convergent validity. It also correlates significantly negatively with the Faces job satisfaction scale (r = -0.25, p < 0.01) and with the JIG (r = -0.18, p < 0.01) indicating divergent validity.
Human Resource Management Practices (HRM)
The Managing Director and a team manager were interviewed about all aspects of their interaction from recruitment to exit. Marketing material was collected and analysed. The JDI facets that measures Opportunities for Promotion and Supervision are also used in assessing perceptions of HRM practices.
Trust in Management
Trust in Management (TIM) self-report survey consists of twelve phrases and adjectives describing characteristics of senior management or executives. Participants select “Yes”, “No” or “?” in response to each word or phrase. “Yes” means the word or phrase describes the manager or executive. “No” means the word or phrase does not describe the manager or executive. “?” means that the respondent is unsure or cannot decide. The scales are scored 3, 0, & 1.5 for “Yes”, “No”, and “?” respectively.
The TIM is considered a single scale and is composed of four dimensions: Ability, Benevolence, Consistency, and Integrity. Table 4 – Cronbach’s alphas and correlations among the TIM summary scores and the TIM dimensions (Brodke et al., 2009) shows how the dimensions of the TIM scale are correlated.
Table 4 – Cronbach’s alphas and correlations among the TIM summary scores and the TIM dimensions (Brodke et al., 2009)*
| Dimension | Cronbach’s coefficient of alpha | TIM summary score | Ability | Benevolence | Consistency | Integrity |
| TIM summary score | 0.91 | 1 | ||||
| Ability | 0.75 | 0.85 | 1 | |||
| Benevolence | 0.85 | 0.88 | 0.67 | 1 | ||
| Consistency | 0.74 | 0.82 | 0.59 | 0.61 | 1 | |
| Integrity | 0.8 | 0.83 | 0.64 | 0.66 | 0.54 | 1 |
| * All correlations are significant at the 0.01 level (2-tailed). |
Table 5 – Validity Coefficients with Selected Outcome Measures – Pearson Correlations (Brodke et al., 2009) shows the Pearson correlations with JDI facets. Brodke et al. (2009) contend that the TIM dimensions are distinct although highly correlated.
Table 5 – Validity Coefficients with Selected Outcome Measures – Pearson Correlations (Brodke et al., 2009)*
| JDI Facet | TIM summary score | Ability | Benevolence | Consistency | Integrity |
| JDI Work | 0.40 | 0.37 | 0.38 | 0.27 | 0.31 |
| JDI Pay | 0.35 | 0.26 | 0.35 | 0.26 | 0.28 |
| JDI Promotion | 0.41 | 0.33 | 0.43 | 0.30 | 0.30 |
| JDI Supervision | 0.61 | 0.51 | 0.54 | 0.49 | 0.53 |
| JDI Co-Workers | 0.50 | 0.45 | 0.44 | 0.37 | 0.42 |
| Job in General | 0.55 | 0.48 | 0.53 | 0.39 | 0.47 |
| Turnover Intention | -0.44 | -0.36 | -0.41 | -0.31 | -0.38 |
| Feelings of Stress | -0.31 | -0.22 | -0.25 | -0.28 | -0.27 |
| * All correlations are significant at the 0.01 level (2-tailed). |
Turnover Intention
This study makes use of Sjöberg and Sverke’s (2000) three item Turnover Intention scale which measures the strength of the respondent’s intention to leave their current job. The scale is scored from 1 (strongly disagree) to 5 (strongly agree). A high score indicates a higher degree of Turnover Intention. Näswall et al. (2006) showed the Cronbach alpha coefficients for this scale to lie between 0,76 and 0,87.
Turnover
Actual turnover information is derived from Human Resource records including ex-employee correspondence in the form of letters of resignation.
Statistical Methods
Data analysis was conducted using an installation of the statistical programming language “R” through the web based front-end “R-Studio” on a virtual Amazon Web Services Machine Image (R version 3.0.1, Nickname Good Sport, 2013-05-16). R is a GNU project which is free under the GNU General Public License.
The researcher considered the following tests given the nature of the study:
- Descriptive Statistics are used to describe the location, shape, and dispersion of the sample data collected
- Inferential Statistics to calculate the strength and direction of the relationships between the research variables
- Regression tests were used to examine cause-effect relationships between the research variables
Summary
Data was primarily derived from the perceptions and experiences of employees. Statistical analysis was performed on the data in order to yield empirical evidence and to gain an understanding of the inter relationships between the antecedents and consequences of Organisational Commitment. Online surveys were conducted using various scales. Secondary data were collected from sources such as informal interviews and company HR records and policies. Data analyses are based on quantitative methods through a statistical analysis in order to answer the research questions posed.
Cite This Work
To export a reference to this article please select a referencing stye below:
Related Services
View all


DMCA / Removal Request
If you are the original writer of this essay and no longer wish to have your work published on UKEssays.com then please click the following link to email our support team:
Request essay removal