Analysing Results: Gambling and the ‘Certainty Effect’
| ✅ Paper Type: Free Essay | ✅ Subject: Psychology |
| ✅ Wordcount: 1910 words | ✅ Published: 21 Jul 2017 |
Decision-making processes occur continuously in our daily lives. Some decisions do not require much thinking, such as putting on your shoes before leaving the house. These decisions are almost automatic. Other types of decisions require more rational thinking. Pros and cons are weighed out, and the option that yields the best outcome is chosen. However, cognitive psychologists have found that rational decisions are not always the sources of our decisions. Decision-making processes can be influenced by many external factors; Tversky & Kahneman (1981) found that decision-making processes can be largely and significantly influenced depending on how a specific problem is framed. Tversky & Kahneman (1981) based their study on the expected utility model, the major theory of decision-making under risk, and brought about the prospect theory. The latter states that people make decisions not based on the final outcome, but on the potential value of losses and gains. More specifically, certain heuristics come into play during decision-making processes, and they can be used and manipulated to influence people’s decisions. An interesting phenomenon that was discovered was the ‘certainty effect’ (Tversky & Kahneman, 1981): it is the tendency to overlook outcomes with a certain, or guaranteed, outcome and choose outcomes with a merely probable outcome instead. This effect influences people to take risky decisions where large losses could occur, or to avoid risky decisions where guaranteed gains could occur. Therefore, framing a problem, or the creation and manipulation of a specific context can largely influence decision-making processes. Because of the relevance and importance of prospect theory and the certainty effect, an experiment similar to the ones used by Tversky & Kahneman, (1981) will be described and analyzed.
The experiment consists in a ‘wheel of fortune’ type of game. The wheel is made up of two parts: one in green, which corresponds to the probability of winning, and one in red, which corresponds to the probability of losing. The specific percentages of winning/losing, along with the according amounts of money which can be won/lost, are shown on the left bottom corner of the screen above the ‘gamble’ button. On the other bottom corner of the screen, the guaranteed amount is presented. The latter can either involve gaining or losing a guaranteed amount of money. Participants start with $1000, and the goal is to end up with the most amount of money; the participants’ amount of money is shown in the top left corner, which is updated after each trial, according to whether participants won or lost. The experiment is made up of 32 trials, and on each trial, participants must decide between two options: either they gamble (by pressing the ‘Gamble’ button on the left), or they go with the guaranteed amount (by pressing the ‘Take Sure Thing’ button).
The independent variables of the experiment are the following: the guaranteed outcome (win or loss), the guaranteed amount (small or large), and the odds on the wheel (less risky or more risky). The dependent variable is the proportion of times the participants decide to gamble or not.
The main hypothesis of the experiment is that the proportion of gamble choices will be higher for guaranteed loss as compared to guaranteed win. More simply, participants will opt to go ‘all in’ even if the odds are against them, instead of picking the safer guaranteed outcome (win or loss).
 Personal data (N=1)
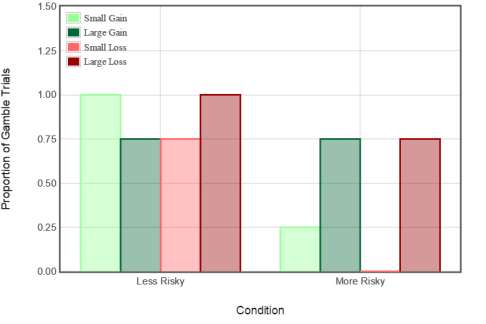
(Figure 1 – Proportion of times of ‘gamble’ choice rather than guaranteed gain or loss for each type of trial.)
For the Less Risky condition, Figure 1 shows that I was more prone to gamble rather than take the guaranteed gain or loss when small gains and large losses were involved, which are both at 1.00 on the ‘Proportion of Gamble Trials’ scale. I was also prone to gamble instead of choosing the guaranteed amount when large gains and small losses were involved (both 0.75). For the More Risky condition, I was more prone to gamble when large gains and large losses were involved (both 0.75). On the other hand, in the same condition, I was much more prone to take the guaranteed gain or loss when small gains (0.25) and small losses were involved (0.00). In fact, when small losses were involved, I always chose the guaranteed amount.
 Global data (N = 7322)
(Figure 2 – Proportion of times of ‘gamble’ choice rather than guaranteed gain or loss for each type of trial.)
For the Less Risky condition, participants decided to gamble more when large losses (0.695) were involved, then small losses (0.688), small gains (0.658, and finally large gains (0.606). For the More Risky condition, participants decided to gamble more when large losses (0.445) were involved, compared to when small gains, small losses, and large gains were involved (all just under 0.3).
The data must be manipulated and further analyzed to be able to extensively discuss the hypothesis. As Figure 3 shows, the hypothesis is proven for the global data, but not for the personal data. For the latter, the proportion of times I decided to gamble was higher when guaranteed gains were involved than for when guaranteed losses were involved. On the other hand, for the former, the proportion of times participants decided to gamble was higher when guaranteed losses were involved, instead of guaranteed gains.
|
Average Proportion of ‘gamble’ decision over ‘guaranteed amount’ decision
|
Personal Data (N=1)
|
Global Data (N=7322)
|
|
Guaranteed Gain |
0.6875 |
0.4643 |
|
Guaranteed Loss |
0.6250 |
0.5308 |
(Figure 3)
In order to gain more insight from the data, more manipulations must be made. Firstly, the averages of the proportion of times participants decided to gamble in the two conditions are compared to see if there are any changes between More or Less Risky conditions; secondly, in a similar manner, trials involving small and large amounts are compared, to see whether the amount size had any effect in the decision-making processes. Figure 4 clearly shows that in the Less Risky condition, the proportion of times I decided to gamble was equal in regards to gains and losses. In the More Risky condition, the proportion of times I decided to gamble was higher when gains were involved. Furthermore, the proportion of times I decided to gamble was much larger in the Less Risky condition.
Figure 5 shows that the proportion of times global participants decided to gamble was also higher in the Less Risky condition. However, in this case, trials where losses were involved had a higher proportion of ‘gamble’ decisions. Similarly, in the More Risky condition, trials where losses were involved had a higher proportion of ‘gamble’ decisions.
 (Figure 4)

(Figure 5)
Figure 6 shows that in trials where small gains were involved, I was much more likely to gamble, while in trials where large losses were involved, I was more likely to gamble. I was only slightly less likely to gamble if large gains were involved. This partly proves the hypothesis, as when large losses were involved, I was more likely to gamble and risk it all.
Figure 7 shows that global participants were more likely to gamble when small and large losses were involved. The proportion of times participants decided to gamble when small losses were involved was only slightly higher than when small gains were involved. Nonetheless, the hypothesis is proven. Participants had the general tendency to gamble more when losses were involved.

(Figure 6)
 (Figure 7)
Framing a specific problem can influence people’s decision-making processes. With regards to the personal data, it initially seemed that the hypothesis was not proven. The proportion of times gamble trials where chosen was higher when guaranteed gains were involved. However, the opposite effect was found for the global data, therefore proving the hypothesis. After having further manipulated the data, it was found that the hypothesis was consistent with the global data, and that both in Less Risky and More Risky conditions and trials where small and large amounts were involved there was a higher proportion of gamble trials. This was also found with the personal data for trials where large amounts of money were involved.
Prospect theory states that there are external factors which influence decision-making processes. While there are many factors that could potentially have an effect on people’s decisions, I will focus on a few that were not covered in the experiment.
People with certain personality traits are more prone to make risky decisions. Penolazzi, Gremigni and Russo (2012) made participants carry out the ‘Columbia Card Task’, answer some questions about the task and fill personality questionnaires. They found that “participants who scored highly on the Impulsivity trait engaged in riskier decision-making” (page 655) and that participants “who scored highly on the Reward Responsiveness trait were found to be sensitive to variations in gains and losses” (page 655). Participants with different personality traits made different kinds of decisions. Therefore, it is an important factor which should be taken into consideration, as we all have different personality traits. Further research in this area could find more definitive links between personality traits and the effect these traits have on decision-making processes. Other researchers have investigated decision-making tendencies of patients with disruptive behavior disorders (DBDs) and predispositions to substance dependence (SD) (Schutter & Bokhoven & Vanderschuren & Lochman & Matthys, 2010). They made participants carry out the ‘Iowa Gambling Task’, which is conceptually similar to the task of this experiment. Shutter et al (2012) found that participants with DBD and SD engaged in significantly more risky choices than the healthy control group and participants with DBD and without SD.
On a similar note, Matthies, Philipsen and Svaldi (2012) wanted to investigate risky decision-making and its connection with emotional states in ADHD patients. They made participants (adults both with ADHD and without) do the ‘Game of Dick Task’ without and after boredom induction. The findings showed that ADHD patients chose the disadvantageous options significantly more than the control group. A behavioral disorder such as ADHD can therefore influence one’s decision-making processes. More studies could be carried out on this specific subject in order to reach more valid conclusions, so that ADHD patients can be helped accordingly, while taking their decision-making tendencies into consideration. It is clear that both personality traits and mental disorders affect people’s decision-making processes. With the ever-growing list of mental disorders, and understanding of personality traits, there is a vast amount of research which can be carried out. A peculiar study carried out by Reyna, Chick, Corbin, and Hsia (2014) found that intelligence agents “exhibited larger framing biases than the students, but also were more confident in their decisions” (page 76). These findings are both fascinating and somewhat worrying. Further studies may find consistent links between certain mental disorders/personality traits and decision-making tendencies. These findings may help in treating patients more efficiently, and investigate whether experts who have to make important decisions on a daily basis are also susceptible to framing and decision biases.
References
Kahneman, D., Tversky, A. (1979). Prospect Theory: An Analysis of Decision under Risk. Econometrica, 47(2), 263-291. DOI: 10.2307/1914185
Matthies, S., Philipsen, A., & Svaldi, J. (2012). Risky decision making in adults with ADHD. Journal of Behavior Therapy and Experimental Psychiatry, 43(3), 938–946. doi:10.1016/j.jbtep.2012.02.002
Penolazzi, B., Gremigni, P., & Russo, P. M. (2012). Impulsivity and Reward Sensitivity differentially influence affective and deliberative risky decision making. Personality and Individual Differences, 53(5), 655–659. doi:10.1016/j.paid.2012.05.018
Reyna, V. F., Chick, C. F., Corbin, J. C., & Hsia, A. N. (2014). Developmental Reversals in Risky Decision Making: Intelligence Agents Show Larger Decision Biases Than College Students. Psychological Science, 25(1), 76–84. doi:10.1177/0956797613497022
Schutter, D. J. L. G., van Bokhoven, I., Vanderschuren, L. J. M. J., Lochman, J. E., & Matthys, W. (2011). Risky Decision Making in Substance Dependent Adolescents with a Disruptive Behavior Disorder. Journal of Abnormal Child Psychology, 39(3), 333–339. doi:10.1007/s10802-010-9475-1
Tversky, A., Kahneman, D. (1981).The Framing of Decisions and the Psychology of Choice. Science, 1981, 211(4481), 453-458.
Cite This Work
To export a reference to this article please select a referencing stye below:
Related Services
View all


DMCA / Removal Request
If you are the original writer of this essay and no longer wish to have your work published on UKEssays.com then please click the following link to email our support team:
Request essay removal