Six Sigma Methodology of Engine Overheating
| ✅ Paper Type: Free Essay | ✅ Subject: Mechanics |
| ✅ Wordcount: 1931 words | ✅ Published: 11 Sep 2017 |
Problem
The Six Sigma is methodology for continuous improvement of process quality, operational excellence and minimizes defects by keeping in mind of customer requirements. The six-sigma’s aim is to achieve 1.28 process capability per million opportunities in production, design of product and in administration of products. Adaptation of six sigma’s in industry can lead to unrealistic improvement.
In this paper the author depicts the use of six sigma methodology for eliminating an engine overheating problem in an automotive industry. Its also explores how company can use that methods and move toward six sigma quality level. The DMAIC (Define – Measure – Analyze – Improve – Control) method used by the author to solve an underlying problem for process variation and high rate of defects. After implementing this technique, the author found sand fusion and metal penetration were responsible for jamming the cylinder head.
Hence implementation of method results into a reduction in the jamming problem observed in the cylinder head and increased the process capability from 0.49 to 1.28. This improvement had an significant impact on financial statement saving ($US110000 per annum).
Process
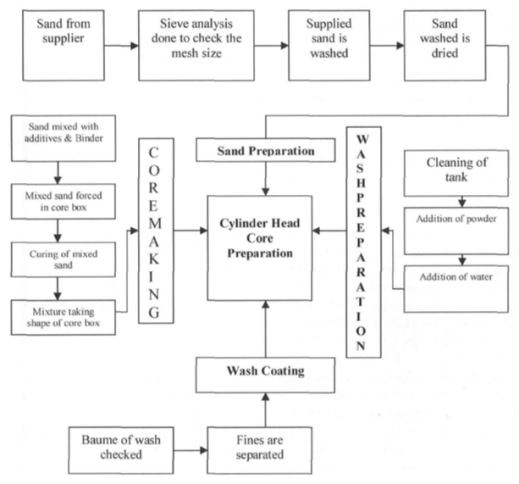
Figure 1: – Process mapping for cylinder head core making
In this case study the main objective was to reduce of water jacket- passage jamming in the cylinder head of an engine. This problem was tackled by six sigma DMAIC methodology. The cylinder head is the cast product used to produced high power that is produced at the bottom surface of the cylinder head and subjects to high heat and vibration. The water jacket passage is a complex passage for water circulation around the engine. The major problem was jamming the water jacket passage leading to customer dissatisfaction. The root cause of this defects has been identified as sand fusion and metal penetration during casting. Sand fusion defects are held by high temperature molten metal fuses with the mould and core. Metal penetration is due to porosity remain in the cores. Thus, it occurs in 13 location as shown in figure 2.
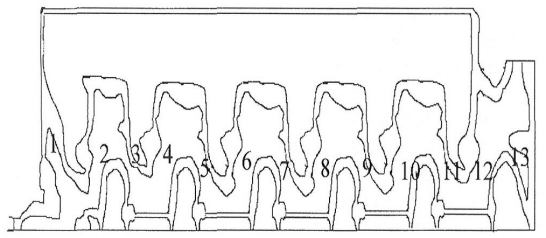
Figure: -2 Location of water jacket jamming
The main focused on the following process to enhance the customer satisfaction and reducing COPQ (cost of poor quality) from 0.194 defects per unit (DPU) to 0.029 DPU.
- Sand preparation
- Core making process
- Wash preparation and coating
After that authors, have been used DMAIC tool to reduce defects and improve the quality of the product. Each stage of DMAIC (Define, Measure, Analyse, Improve and Control) is explained below.
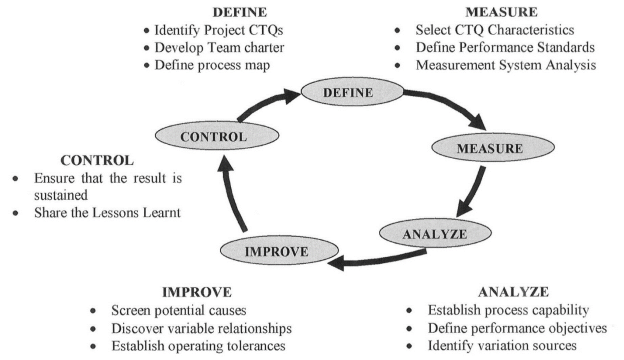
Figure: -3 Five step methodology of six sigma
The Define Phase: –
This is the first step of the DMAIC in which project goal, scope, boundaries and customer requirement are defined. The projects team member includes a champion, a black belt, a green belt and two graduate engineer. Furthermore, the team member asks certain question in charting sessions such that what is wrong in the production of the cylinder head casting? where is the problem? How big is the problem? What is the impact of the problem. The team make sure that these points should be been investigated prior the measure phase.
The main goal of this projects was to reduce defects from 0.194 to 0.029 DPU, which immensely decrease in the cost of poor quality. After this the team conducting destructive test on cylinder head and identified root causes and performing brainstorming to an conclusion that the jamming was due to sand fusion and metal penetration. They also conclude that the major roots cause was the porous core.
The main focused on the following process to enhance the customer satisfaction and reducing COPQ (cost of poor quality).
- Sand preparation
- Core making process
- Wash preparation and coating
The measure phase: –
In this phase the teams select one or more products specification, mapping the process, making necessary dimensions and establishing a baseline of the process capability or process performance. This will identify all the value and non- value added steps, key process inputs and outputs. After mapping the process the team member proceed to analysis the causes of defects using cause and effects diagram shown in figure 4.
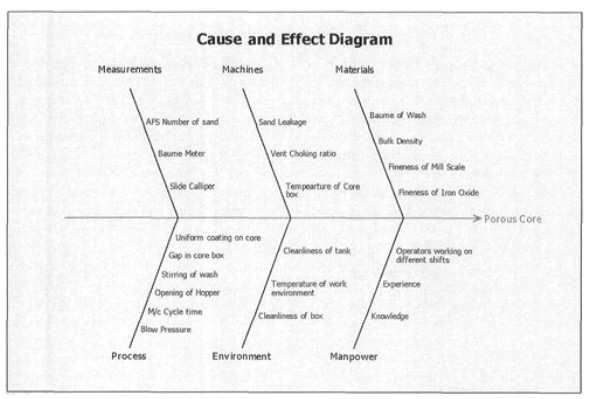
Figure: -4 Cause and effect analysis of the porous core
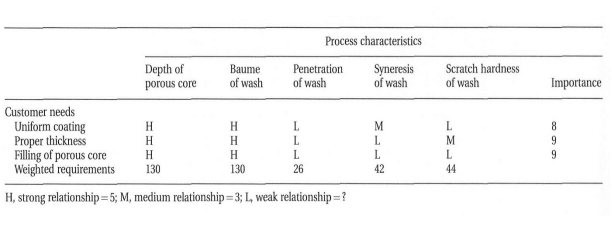 Table 1 Causes and effect matrix
Its shows that’s the process variables affecting the porous core were sand leakage, blow pressure, the AFS number of the sand, the gap in core box and vent choking. After identifying that contribution of porous core is over 80%, they create cause and effect table 1 showing customer needs with respect to process characteristic that are critical to customer. The next step was to define performance standards according to customer demands.
A data collection plan has been establishing to track the project output and standard setting exercise. To identify the source of variation in the measurement system a gauge repeatability and reproducibility (R&R) study was conducted. Its necessary to redesign the gauge to train operator how to use new gauge and read the gauge instrument and suitable fixtures were used to help the operator for more consistency. This system is used when there is variability less than 10% od the total process variability. This study is performed to check the accuracy of the workers operating the machine.
Table 2 Result of gauge R&R Study
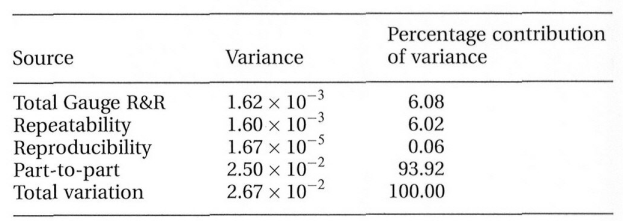
Thus, the result shows that variation is 6.08% which implies the measurement system acceptable as show in table 2. From the data Cpk value is estimated to 0.49, hence it is clearly indicated that the process performance is poor and improvement needed.
The analysis phase: –
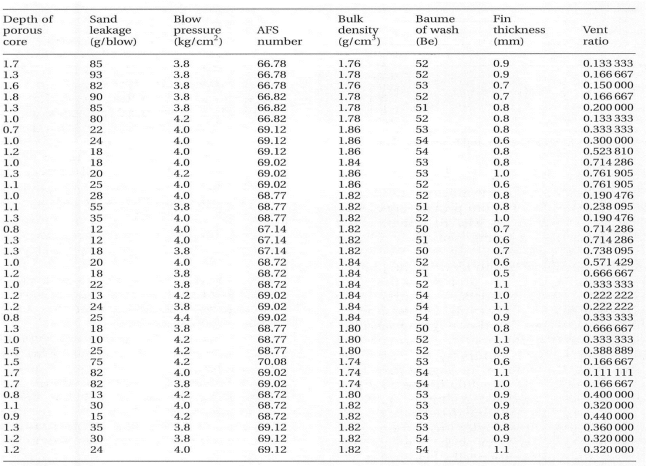
In this phase the first step is to gather data from the process to obtain a better picture of the depth of the porous core under different conditions. Later no the data that are factor affecting are being collected over a period of 36 days from different shits as shown in table 3. This data is further analysed to determine the relationship between process parameters direction of improvement.
Table 3 Factors affecting response before improvement
The passage jamming tendency relation to location is shown in the figure 5 with the help of Pareto chart. This has been drawn on the bases of day to day monitoring and recording the passage jamming at 13 location were arranged in descending order on X axis of the Pareto chart.
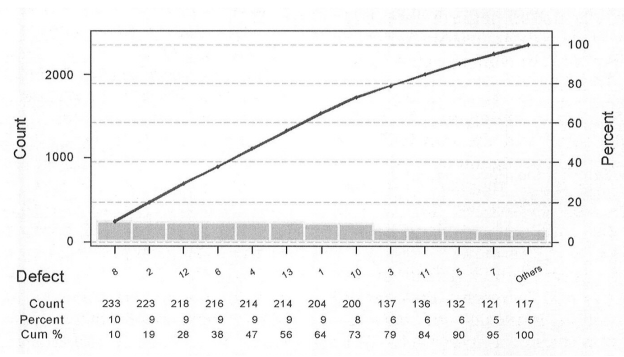
Figure: -5 Pareto chart to show location wise jamming tendency
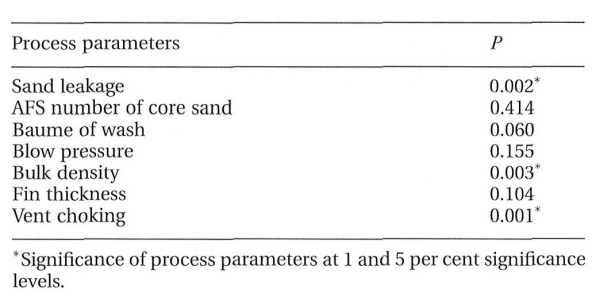
The main aim of the project team to enhance the process capability by reducing variation in the process. A regression analysis is performed to determine the significance of process parameters. According the table 4. The variation P values less than 0.05 to 0.01 that are sand leakage, bulk density, and vent choking ratio are need to be further optimised and controlled.
Table 4 Result of regression analysis for process parameters
The improve phase: –
In this phase using three process parameters sand leakage, bulk density, and vent choking ratio are identified from the analysis phase.
- Sand leakage
When the door half and the ram half were closely packed due to misalignment of the two halves at that time sand was coming out of the core box, after this the two halves were properly aligned and packing were used to seal any opening ends. The parameter may be varied from 10 to 30g/blow.
- Bulk density
The required bulk density of core sand is between 1.78 and 1.95 g/cm3. To increase the bulk density iron oxide and mill scale was added, the iron oxide composition was accumulated to 3% to realize the required bulk density and to improve the high-temperature thermal properties of the core sand. Mill scale addition of 1.5 % additionally helped to extend the density and thermal conductivity of the sand.
- Vent choking
This has been considered one of the serious problems posed by the foundry men. The resin used for the core sand blocked the gap of vent by sticking during the curing process. This results in the occurrence of porous core because from the core shooter air cannot escape out of the core box and only 30 vents were blocked out of 52 vents. Thinner was used to clean this vents. This cleaning was increased from once to twice a week during each shift break.
The following steps were taken to control the process.
- AFS number
Proper care was taken of sand so that only sand grain of 65-70 reaches the hopper of shell core machine.
- Blow Pressure
The pressure gauge was checked to maintain blow pressure range of 4-4.5kg/cm2.
- Baume of wash
According the specification standards (52- 56 Be) the was regularly checked.
- Fin thickness
Using corrective maintenance, the fine thickness of range 0-0.85 was brought.
Design of experiment (DoE) was conducted using three process and each process was studied at different levels. To have sufficient degree of freedom each trial condition was replicated as shown table 5 the results of the experiments shown average depth of porous core. Hence, the average depth of porous core was 1.25mm. The figure 6, 7 depicts the main effect plot and the interaction plots to relate this it was decided to construct a normal probability plot of effects. Figure shows 6 the main effects were statically significant at 10% level as well as figure 7 suggest light interaction between vent chocking and sand leakage. From figure 6 it seen that the optimum level of the process parameters for minizine all three defect. Thus, the average depth of the porous was computed to be 0. 80mm. Hence, process capability was improved from 0.49 to 1.28.
Table 5 Result of full factorial experiment
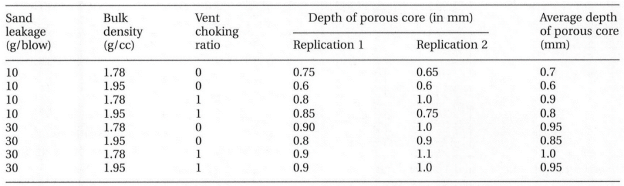
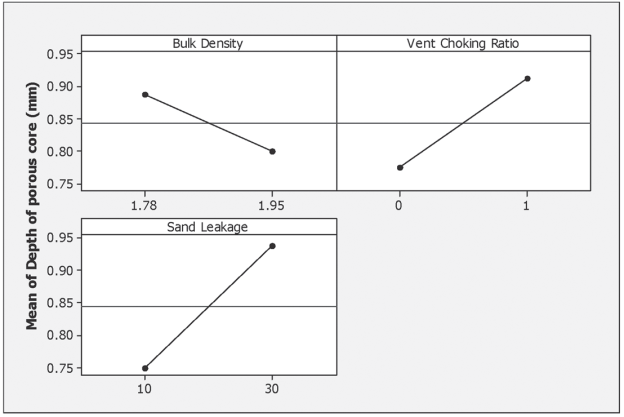
Figure: – 6 Main effect plot for the depth of the porous core
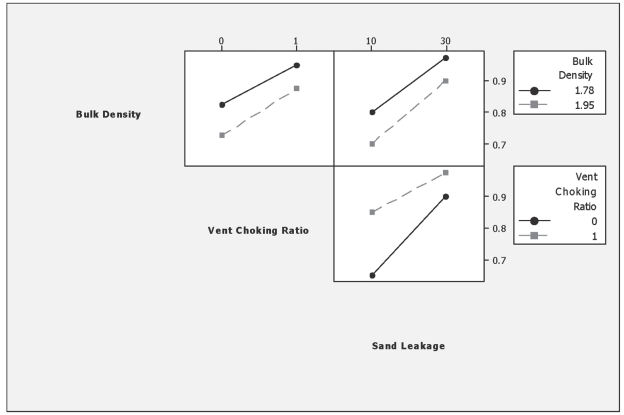
Figure: – 7 Interaction plot showing the interactions among the process parameters
The control phase: –
In this phase the extensive programme was conducted for the case study. Process sheets and control charts were made to take preventive action before the process went outside of control limits. A complete data base was prepared and proper monitoring of process help to detect and correct the signals before they result into customer dissatisfaction. run charts for the depth of porous core were drawn before and after improvements. The purpose of the run charts was to analyse variability in the porous core. Figure 8, 9 shows all the point are in the specification and that variability in the porous has been reduced.
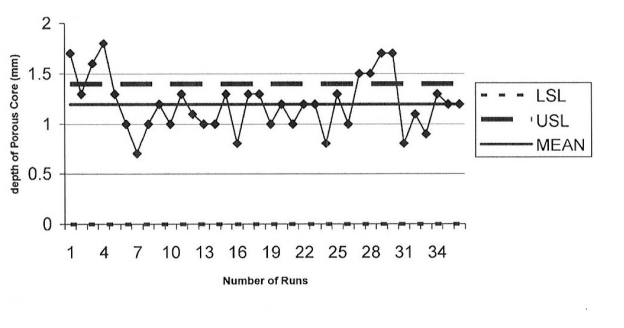
Figure: – 8 Run chart for the porous core before improvement LSL, Lower specification limit, USL, Upper specification limit.
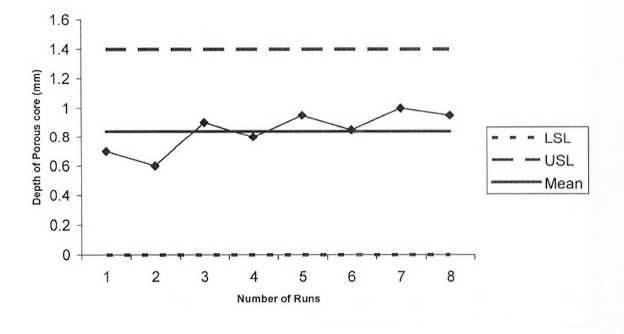
Figure: -9 Run chart depth of core after improvement
Table 6 Comparison before and after improvement based on key metrics
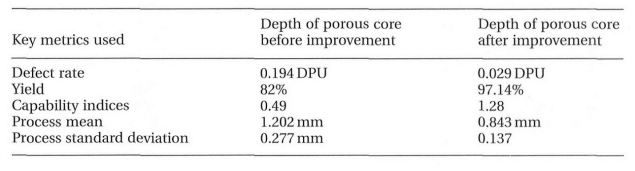
As shown in table 10 the comparison before and after improvement the depth of porous and various systems has been improved and control by six sigma.
If I were the project leader:
In this case study,
- Brainstorming
- 5 why
- SIPOC
- 5S
I would like to use all tools. In first step when team is made, it made by only team member so I would like to take one or two members from outside the plants and who are not from this field. By doing this there may be chance to get different ideas from them. Here author did detail study of whole process and found the reasons of problem and best possible solutions.
After collecting data, I would suggest team members to find root causes by doing brain storming and also using Ishikawa Diagram. One the other important tool that authors didn’t use that should be used is VSM (value stream map) through which we can easily find bottleneck of the process.
I would also have used Poka -Yoke (error proofing) tool to easily find error and controlled production of incorrect parts.
Just to apply Six sigma is not sufficient to improve process of product but also maintain the quality is one of the important things in any industry. So if I were the in charge of the project I would suggest to sustain the improvements and motivate team to find more better ways of handling problems.
Cite This Work
To export a reference to this article please select a referencing stye below:
Related Services
View all


DMCA / Removal Request
If you are the original writer of this essay and no longer wish to have your work published on UKEssays.com then please click the following link to email our support team:
Request essay removal