US Stock Market and GDP Analysis
| ✅ Paper Type: Free Essay | ✅ Subject: Economics |
| ✅ Wordcount: 3056 words | ✅ Published: 19 Oct 2017 |
- Stock Prices
- Definition
Stock (or share) which is sometimes known as equity is a claim to partial ownership or holdings of a firm.
Initially, the original owners of a firm sell their shares or stock to gain additional funds to finance the firm expansion which can be said as the owners sell part of the ownership of the firm to the stockholders. This is known as the Initial Public Offering (IPO). After the IPO, the stocks can be sold and resold by the stockholders in the stock market with the aim of gaining profitable returns through the price differences of the stock.
Stock prices are determined through trading on a stock exchange such as NASDAQ, S&P 500 and DJIA. Generally, stock prices reflect investor expectations for future corporate earnings and thus reflect for future economic growth.
- The Origin of the Stock Market
The stock market originated in Europe prior the industrial revolution in the 1700s. Many traders in the market wished to make investment in huge businesses but this could not be affordable with a single trader. Thus, they gathered their funds together to invest in a new business as partners (Grazian, 2008). This is similar to the practice of shares nowadays and has inspired the origin of the stock market.
In the beginning, the stock market trading started on an informal note. The traders met at coffeehouse which was used as a market place in the 1700s. The first exchange was created in Philadelphia during 1800 and in New York during 1817 and finally the trading rules were formed (Grazian, 2008).
In the United States, the first stock exchange took place in Philadelphia over 220 years ago which was known as the “Board of Brokers” and the Board met at the coffeehouse. The Board of Brokers was later changed into the Philadelphia Stock Exchange in 1875 and it is now included in NASDAQ as NASDAQ OMX PHLX. The market became more structured without manipulative auctions and a fair commission structure was formed. The group of stock brokers was reorganized and known as the “New York Stock and Exchange Board” in 1817 (Terrell, 2006).
In 1896, the Dow Jones Industrial Average (or the Dow) created by Charles Dow and one of his business associate, Edward Jones was first calculated. Along with other stock market index, such as NASDAQ and S&P 500, the Dow is one of the most closely indicator to track the stock market activity. Besides the Dow, S&P Dow Jones Indices also determined the S&P 500 in 1957 (Standard and Poor’s, 2009). The S&P 500 is more preferable than other stock market indices as it is determined through a more diverse constituency and weighting methodology with 500 stocks chosen for market size, liquidity and industry grouping. It is recognized as the best representation of the U.S. stock market and also classified as a leading indicator for the U.S. economy. Thus, the stock indices from the S&P 500 were used as the data in this study.
c. Stock Prices As an Economic Indicator
Economic indicators give us a better idea of where the economy is headed. There are two types of economic indicators, which are the leading indicators and the lagging indicators. Leading indicators often change before the economic adjustment and thus can be used to predict the future economy whereas the lagging indicators reflect the economy’s past performance and only identifiable after the economic adjustment.
Stock market is a leading indicator. Most people will first look at the stock market performance first when talk about the economic trends although it is not the most important indicator. This is because stock prices mainly depends on the expected earnings of the domestic firms, thus it can indicate the economy trend if the estimated earnings are accurate. A strong market usually followed with economy expansion while a down market always leads to economic downturn.
However, it is undeniable that here are inherent flaws for stock prices to act as a leading indicator for the future economy performance. Firstly, the estimated earnings can be inaccurate. Secondly, the vulnerability of stock market which is probably adjusted or manipulated. For example, the government can manipulate the market to keep it high via various strategies to avoid public from panicking of economic crisis and the traders and corporations can manipulate the market via high-volume trades or other strategies. Thus, the true underlying strength or value of stock prices may become unobvious due to its vulnerability to be manipulated. Thirdly, the stock market is also susceptible to the creation of bubbles (Binswanger, 2004), which may convey false information about the economy’s direction.
- Economic Activity
- Definition
The goal of economic activity is to produce goods and services in order to fulfill the needs and wants as well as to improve the social welfare.
Economic activities are related to production, distribution, exchange and consumption of goods and services at all level in the society. Furthermore, economic activities can be defined as human activities which are performed in exchange for money or money’s worth, in other words, economics activities are those efforts performed by human to earn income, money, wealth and to maximize their satisfaction of wants with scarce means.
The primary aim of the economic activity is to produce goods and services with an objective to make them available to the consumers. Thus, gross domestic product (or GDP) is one of the common ways to assess the economic activity. In this study, the economic activity is also represented by the indicator of GDP.
- The Origin and History of GDP
The idea of gross domestic product (GDP) arose during the period post-carnage of the Great Depression and World War II in 1930s. GDP which was described as the ultimate measure of a country’s overall welfare, a window into an economy’s soul and the statistic to end all statistics was used widely and globally and become the defining economic indicator in the last century (Dickinson, 2011).
Simon Kuznets, an economist at the National Bureau of Economic Research introduced a formula to determine GDP to the U.S. Congress in 1937.The original formulation of GDP was essential as it included all economic production in a nation. However, Kuznets’ formula was not being widespread utilized until the Bretton Woods conference created World Bank in 1944. After that, GDP was used widely as a tool to determine the nation’s economic condition. Although there are few economists questioned on the accuracy of GDP in measuring overall economic welfare, the GDP is still widely used now (Bureau of Economic Analysis, 2008).
GDP is also described as one of the great invention in the 20th century because without this invention, economists, researcher and policymakers could not have played their role effectively with the unorganized data.
- GDP As an Economic Indicator
Unlike the stock prices which serve as leading indicator, GDP serves as lagging indicator which changes after the economy adjustment. Although lagging indicators do not show the direction of economic trend, they reflect how the changes in economy over time.
GDP is a tool that typically recognized by economists to measure the economic welfare. Increase in GDP indicates that the economy is strong while decrease in GDP indicates that the economy is weak. As stated previously, GDP is not a flawless indicator, many economists questioned on its accuracy especially in the financial market as some strategies such as quantitative easing and excessive government spending could have been carried out by the government to boost up the GDP of a nation.
Despite of the flaw, as a lagging indicator, GDP is still a good determinant to measure the economic condition of a nation.
- Theories on Predictive Power of the Stock Price for the Future Economic Activity
There are two theories in the theoretical literature on the forecasting ability of the stock prices for the future economic activities. The first theory explains the forward looking behavior of the stock market while the second theory discusses the causal effects of the stock prices on the economic activity (Croux & Reusens, 2013).
- Forward Looking Behavior of the Stock Market
Based on the idea that the stock price is the present value of future dividends (Fama, 1990), the theory of forward looking behavior of the stock market arose.
The purpose for the stockholders to own stock is to earn from the interest difference when the stock is resold or to earn the dividends from the corporation. The increasing stock prices reflect the higher expectation of stockholders to earn more dividends. As the dividend is a payment made by a corporation to its stockholders out of its profit, the increase in expectation of stockholders towards future dividends gained indicates that there will be a rise in the corporation’s profit. Furthermore, the corporation’s profit is known to be positively correlated with the GDP of a nation, thus the rise in corporation will bring increment to the nation’s GDP. Therefore, a rise in the current expectation towards the nation’s future economic activity will definitely result in increase in the stock price.
However, several researchers have argued that the vulnerable property of stock market to be manipulated may affect its predictive power towards the future economic activity. Stock prices may deviate from their fundamental value due to the speculative bubbles (Binswanger, 2004). Speculative bubbles is a situation in which the securities’ pieces such as stock prices rise far above their actual value as a result of irrational exuberance rather than the basic underlying fundamentals of the market. This can attract investors or stock traders to invest in order to take advantage of the profits. After some time, the bubbles will eventually burst and causes the stock prices will drop below their market value before they reach the equilibrium again. Thus, from this phenomenon, stock prices may deviate from the fundamental value sometime and hence its predictive power will be reduced. Apart from that, the globalization of the investment market also may reduce the predictive power of stock prices towards the nation’s GDP (Mao & Wu, 2007). This means that is foreign investment in the domestic activity which brings about increase in stock price, however, since it is the foreign investment, it may not bring direct impact on the nation’s GDP.
- Causal Effects of the Stock Prices on the Economic Activity
The causal effects of stock prices on the economic activity can be seen through the activity of consumption and investment.
The connection between the stock prices and consumption can be explained by the wealth effect (Modigliani, 1971). The wealth effect refers to the increase in spending which due to the increase in perceived wealth. The rise in stock prices will bring about an increase in the income and wealth of the stockholders, they may increase their consumption as a result from having higher purchasing power. Since consumption is positively correlated with the GDP, the increase in consumption as a result from the rise in stock prices will affect the nation’s GDP. However, Pearce (1983) argued that the wealth effect depends on the distribution of stock holders in the nation. For example, most of the stockholders in the United States are comprised of small groups of rich people who have lower propensity to spend out of wealth.
Besides, the causal effect of stock prices on the economic activity can also be seen through the activity of investment which its impact is on the cost of capital. The cost of capital is the fund for a firm to finance its business. The sources for capital can be varied from company to company such as equity financing and debt financing. Generally, the cost of capital is the weighted sum of the cost of equity and the cost of debt. With the increase in the stock price, the effective cost of equity will be reduced as a result from overvaluation of the stock price (Fischer & Merton, 1984). Besides, cost of debt also will be lowered due to high stock prices as it could give some positive signals towards the lenders and thus raise the creditworthiness of the firms which would result in better loan condition (Morck et al., 1990).
- The Economy of the United States
There is lots of news recently about the rapid growth rate of China absolutely furious pace for over the last decade and may overtake the United States to be the largest economy in the world. Nevertheless, the United States still keep the place of the largest economy in the world by far in the year of 2013.
The United States has been keeping the place of the world’s largest economy for at least a century. With one third of the world’s millionaires and 40% of the world’s billionaires stay in the nation, the United States become the wealthiest nation in the world. The diversify economy and open market in the United States helps the economy to stay strong. The United States is also considered the largest manufacturer and the most influential financial markets in the world.
- Stock Prices in the United States
The United States is considered to have the most influential and largest financial markets in the world. Almost every large company in the US is traded on a Stock Exchange.
This study employed S&P 500 as the stock market indices to be analyzed as it is the best representation of the U.S. stock market with 500 stocks chosen for market size, liquidity and industry grouping through a more diverse constituency and weighting.
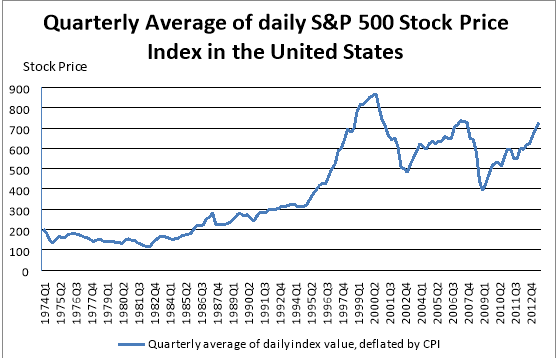
Figure 1.1 Time plot for quarterly average of daily S&P 500 stock price index in the United States (Source: Economic Research, 2013)
Figure 1.1 shows the moving trend of stock prices in the period from first quarter of 1974 to third quarter of 2013. From the figure, the stock prices in the United States generally showed a fluctuating rising trend with a record of expansion from 1974 to 2000 with gradual increasing rate at the beginning and higher pace increasing rate later from 1993 to 2000. There were significant market downturns in 2002 and 2008.
The stock prices reached the peak in the second quarter of 2000 and started to drop afterwards until the minimum point in the first quarter of 2003. This market downturn has been known as the market crash of 2000. The causes for this crash are believed to be the corporation corruption, overvalued stocks and the emergence of day-traders or momentum investors. Several strategies has been listed out by the government to overcome the crash, for example accounting reforms to have better disclosure of corporate balance sheet form and new rules are set for the day-traders to apply more restriction.
Besides the market downturn of 2000, there was a market downturn in 2008 as well. From the figure, the stock price index continued to rise after the market crash in 2000 and reached at maximum point in the second quarter of 2007 but falls gradually afterward till the minimum point in the first quarter of 2009. This period was ranked among the most horrified financial market history in the United States. This market crash is believed to be caused by the corporate corruption and the mortgage crisis. The stock price indices continue to climb after the market crash of 2008.
- GDP of the United States
The United States has been the largest economy in the world in term of GDP level for at least a century.

Figure 1.2 Time plot for quarterly GDP in the United States (Source: OECD. StatExtracts, 2013)
The figure 1.2 shows the time plot of GDP of the United States from first quarter of 1974 to third quarter of 2013. Generally, the GDP level in the United States showed a gradual increasing trend across the period.
From the figure, there are slight decreases in the GDP level are shown in 1982 and 1991 as a result of economic crisis. In addition, a more significant fall of GDP level was shown in the third quarter of 2008 after a gradual increasing trend. The National Bureau of Economic Research (NBER) declared that there was an economic recession since 2007. This economic fall is believed to be the result of mortgage crisis during that period.
- Relationship between Stock Prices and GDP of the United States
The United States is famous to be the largest economy and the most influential financial market in the world. The tradition connection of stock prices and GDP of the United States has always be the topic of interest to be study among the researchers.


Figure 1.3 Time plot for quarterly GDP and quarterly average of daily Stock Price in the United States (Source: Economic Research, 2013 and OECD. StatExtracts, 2013)
Figure 1.3 shows the relationship between stock prices and GDP in the time plot from first quarter of 1974 to third quarter of 2013. In the tradition connection of the stock price and GDP, stock price is believed to contain the predictive power towards the GDP. From Figure 1.3, the stock prices generally moving in the same direction with GDP. However, the market crash in 2000 brought about economic expansion instead of the economic recession. This phenomenon goes against with the tradition relationship between stock price and GDP. However, the market crash of 2008 has successfully predicted the economic recession in 2008.
Therefore, the contradict phenomena have again caught the attention of several parties to further study in the predictive power of stock price towards the GDP.
- Objective
Although the theories and the tradition relationship state that the stock prices contain the predictive power towards the future economic activity, there are several theoretical and empirical researchers have contradicted opinions. Moreover, the historical data of stock prices and GDP of the United States also show a general similar moving direction of the stock prices and GDP but the market crashes in 1987 and 2000 resulted in economic expansion instead of economic recession. This issue has again prompted the further research in the tradition relationship of the stock prices and the economic activity. Hence, the purpose of this study is to determine the predictive power of stock price on the future economic activity, i.e. future GDP in the United States.
- Scope of Study
This study focuses on the United States which the quarterly data is obtained with the sampling period from first quarter of 1974 to third quarter of 2013. The national stock price index of the United States, S&P 500 is chosen. The quarterly average of the daily index is calculated because it is believed to be more representative for the entire quarter than the value at the end of quarter. Besides, quarterly nominal GDP is chosen as the representative for the economic activity. Both data is expressed in the domestic currency with CPI base year of 1982.
Cite This Work
To export a reference to this article please select a referencing stye below:
Related Services
View all


DMCA / Removal Request
If you are the original writer of this essay and no longer wish to have your work published on UKEssays.com then please click the following link to email our support team:
Request essay removal