Statistical Methods of Business
| ✅ Paper Type: Free Essay | ✅ Subject: Economics |
| ✅ Wordcount: 2071 words | ✅ Published: 20 Nov 2017 |
- Jia Tian LIN
- Introduction
The purpose of this assignment is to understand and be able to illustrate and describe the role of statistical data analysis and enable an understanding of statistical methods of business. Also, this assignment can ensure appropriate use of relevant statistical tool to interpret data and be able to use of statistical models in economic decision making situations. Furthermore, this project can facilitates proficiency with computer programs written for statistical use. ‘Go Green’ is a franchise store that sells house plants, lawn and garden supplies. This report will discuss Graphical analysis, Correlation analysis and Regression analysis in different ways and in order to help a franchise store to set up a new store.
- Graphs
The table below shows the data about 11 franchise stores, which are A to K.

There six variables in this table, which are ANS, SQFF, VSI, ADVERT, SALD and Hour of NOMP. These variables are meaning different things. ANS is Annual net sales, in thousands of pounds. SQFF is Number of square feet of floor display in store, in thousands of square feet. VSI is Value of store inventory, in thousands of pounds. ADVERT is Amount spent on local advertising, in thousands in pounds. SALD is Size of sales district, in thousands of families. NOMP is Number of competing or similar stores in sales district.
2.1 ANS and SALD
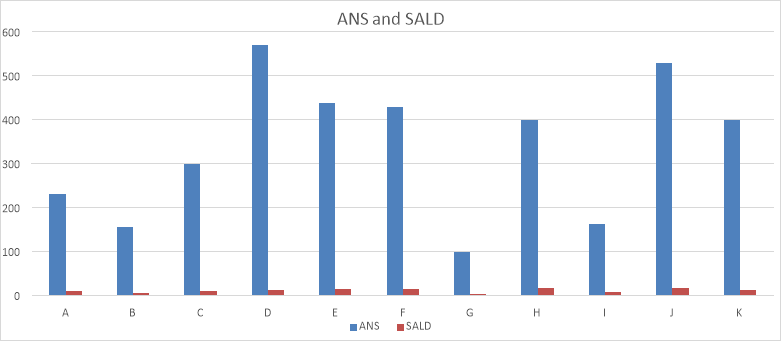 Figure 1
The figure 1 above shows the data of ANS and SALD of franchise stores in different region. In region D, the ANS is highest and the value is 570. The SALD is 12.3. The lowest ANS is in region G which is 98, and the SALD is 2.7, the SALD in region G is the lowest value as well. In region B and region I, the ANS are 156 and 161. These are second and third lowest value. And SALD is 4.1 in region B and 6.3 in region I. They are also second and third lowest value in 11 stores. In addition, the highest SALD is 16.0. Region H and J both have this value. Their ANS are 398 and 528 respectively. From the figure 1, it shows the relationship between ANS and SALD is mutual relationship. When the ANS goes up, they SALD is increasing. When ANS is reducing, the SALD is decreasing. This means the annual net sales increase and the size of sales district will increase, which means the ANS can affect the SALD.
2.2 SQFF and VSI
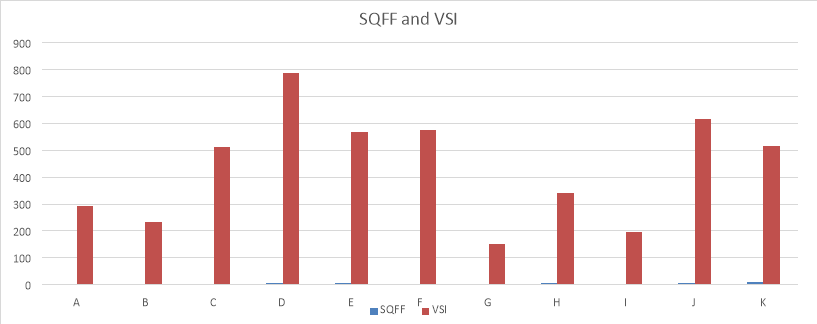 Figure 2
The figure 2 above shows the data of SQFF and VSI of 11 franchise stores in different region. The highest SQFF is 8.6 and it is in region K. Its VSI is 517 (£). The lowest SQFF is in region G, it is 1.6. Region G’s VSI is 151 and it is lowest in 11 stores. Region D has the highest value which is 788, its SQFF is 5.4. Also, SQFF in region B is 2.2, it is the second lowest value. Its VSI is 232 and third lowest value in 11 stores. SQFF in region I is 2.6, it is the third lowest value. Its VSI is 196 and second lowest value in 11 stores. According the data and figure above, they shows SQFF and VSI have a mutual relationship. It shows when SQFF goes up, the VSI is increasing. When SQFF goes down, the VSI is decreasing. This means number of square feet of floor display in store can affect the value of store inventory.
2.3 ADVERT and SALD
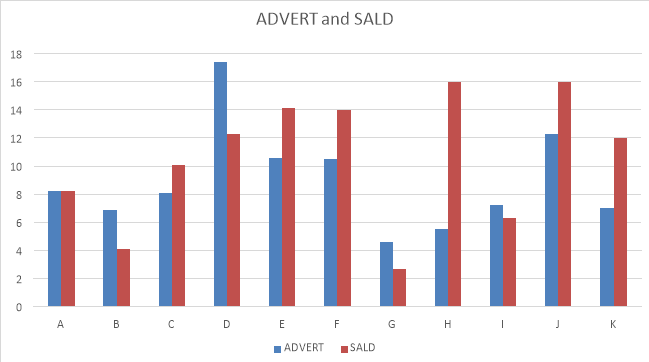 Figure 3
The figure 3 above the data of ADVERT and SALD about the 11 franchise store in different region. Region D has the most ADVERT, the value is 17.4. Its SALD is 12.3. In region G, ADVERT and SALD both are the lowest value in 11 store, the ADVERT is 4.6, and the SALD is 2.7. The highest SALD is 16.0, Region H and J both have this value. Their ADVERT is 5.5 and 12.3 respectively. From the data and figure, they show the ADVERT and SALD have week relationship. In some regions, when ADVERT goes up, SALD increase. And when ADVERT goes up, SALD decrease. Also, some regions are ADVERT low, SALD is high. Hence, the amount spent on local advertising is not key impact factor to size of sales district.
2.4 ANS and ADVERT
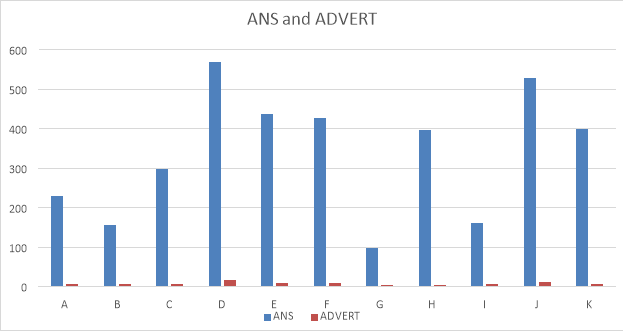 Figure 4
The figure 4 above the data of ANS and ADVERT about the 11 franchise stores in different region. In region D, ANS is 570 and ADVERT is 17.4. They are both highest value in 11 stores. Also, the lowest ANS and ADVERT is in region G, which is 98 and 4.6 respectively. According the data and graph, it shows when ANS has high value, Most ADVERT has high value as well. When ANS is decreasing, the ADVERT is decreasing. This means ANS and ADVERT have a strong relationship. The annual net sales can affect the amount spent on local advertising.
- Correlation Analysis
According to Lucey (2002), Correlation is the gross inter-relationship or association between variables, and it refers to any of a broad class of statistical relationships involving dependence. Such as age and weight of a person, sales and advertising expenditure. There are two types of correlations:
3.1 Production Moment Coefficient of Correlation
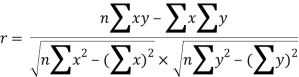
Person’s Correlation or Product Moment Correlation measure the strength of the association between the two (x, y) sets of variables.
The formula is:
3.2 Spearman Rank Correlation Coefficient
This measures the association between the variables when they are arranged in a ranked form.
The formula is:
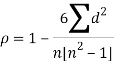
d = different between pairs of ranked values.
n = number of paired ranking
The range of correlation coefficient:
Note that r or  should always be in the range:

Any answer outside this range need to be re-checked.
The figure 5 below shows the correlation between the variables X and Y or dependent and independent variables.


Figure 5
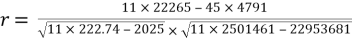
3.3 Correlation of ANS and SALD
The table below shows the data ANS and SALD about the 11 franchise stores.
|
Region |
ANS (x) |
SALD (y) |
|
|
xy |
|
A |
231 |
8.2 |
53361 |
67.24 |
1894.2 |
|
B |
156 |
4.1 |
24336 |
16.81 |
639.6 |
|
C |
299 |
10.1 |
89401 |
102.01 |
3019.9 |
|
D |
570 |
12.3 |
324900 |
151.29 |
7011 |
|
E |
437 |
14.1 |
190969 |
198.81 |
6161.7 |
|
F |
428 |
14 |
183184 |
196 |
5992 |
|
G |
98 |
2.7 |
9604 |
7.29 |
264.6 |
|
H |
398 |
16 |
158404 |
256 |
6368 |
|
I |
161 |
6.3 |
25921 |
39.69 |
1014.3 |
|
J |
528 |
16 |
278784 |
256 |
8448 |
|
K |
400 |
12 |
160000 |
144 |
4800 |
|
|
|
|
|
|


 = 3706
 = 115.8
 = 1498864
 = 1435.14
 = 45613.3
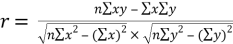
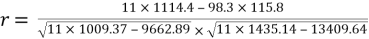
 = 0.897371
The Pearson Coefficient of Correlation is 0.897371. This means the Pearson’s Coefficient is perfect positive correlation. It also means ANS and SALD have a perfect positive linear relationship.
3.4 Correlation of SQFF and VSI
The table below shows the data SQFF and VSI about the 11 franchise stores.
|
Region |
SQFF (x) |
VSI (y) |
|
|
xy |
|
A |
3 |
294 |
9 |
86436 |
882 |
|
B |
2.2 |
232 |
4.84 |
53824 |
510.4 |
|
C |
3.1 |
512 |
9.61 |
262144 |
1587.2 |
|
D |
5.4 |
788 |
29.16 |
620944 |
4255.2 |
|
E |
4.4 |
567 |
19.36 |
321489 |
2494.8 |
|
F |
4.2 |
577 |
17.64 |
332929 |
2423.4 |
|
G |
1.6 |
151 |
2.56 |
22801 |
241.6 |
|
H |
4.3 |
342 |
18.49 |
116964 |
1470.6 |
|
I |
2.6 |
196 |
6.76 |
38416 |
509.6 |
|
J |
5.6 |
615 |
31.36 |
378225 |
3444 |
|
K |
8.6 |
517 |
73.96 |
267289 |
4446.2 |
|
|
|
|
|
|
 = 0.665736
The Pearson Coefficient of Correlation is 0.665736. This means the Pearson’s Coefficient is a moderate positive correlation. It also means SQFF and VSI have a moderate positive linear relationship.
3.5 Correlation of ADVERT and SALD
The table below shows the data ADVERT and SALD about the 11 franchise stores.
|
Region |
ADVERT (x) |
SALD (y) |
|
|
xy |
|
A |
8.2 |
8.2 |
67.24 |
67.24 |
67.24 |
|
B |
6.9 |
4.1 |
47.61 |
16.81 |
28.29 |
|
C |
8.1 |
10.1 |
65.61 |
102.01 |
81.81 |
|
D |
17.4 |
12.3 |
302.76 |
151.29 |
214.02 |
|
E |
10.6 |
14.1 |
112.36 |
198.81 |
149.46 |
|
F |
10.5 |
14 |
110.25 |
196 |
147 |
|
G |
4.6 |
2.7 |
21.16 |
7.29 |
12.42 |
|
H |
5.5 |
16 |
30.25 |
256 |
88 |
|
I |
7.2 |
6.3 |
51.84 |
39.69 |
45.36 |
|
J |
12.3 |
16 |
151.29 |
256 |
196.8 |
|
K |
7 |
12 |
49 |
144 |
84 |
|
|
|
|
|
|
 = 0.473068
The Pearson Coefficient of Correlation is 0.473068. This means the Pearson’s Coefficient is a week positive correlation. It also means ADVERT and SALD have a week positive linear relationship.
3.6 Correlation of ANS and ADVERT
The table below shows the data ANS and ADVERT about the 11 franchise stores.
|
Region |
ANS (x) |
ADVERT (y) |
|
|
xy |
|
A |
231 |
8.2 |
53361 |
67.24 |
1894.2 |
|
B |
156 |
6.9 |
24336 |
47.61 |
1076.4 |
|
C |
299 |
8.1 |
89401 |
65.61 |
2421.9 |
|
D |
570 |
17.4 |
324900 |
302.76 |
9918 |
|
E |
437 |
10.6 |
190969 |
112.36 |
4632.2 |
|
F |
428 |
10.5 |
183184 |
110.25 |
4494 |
|
G |
98 |
4.6 |
9604 |
21.16 |
450.8 |
|
H |
398 |
5.5 |
158404 |
30.25 |
2189 |
|
I |
161 |
7.2 |
25921 |
51.84 |
1159.2 |
|
J |
528 |
12.3 |
278784 |
151.29 |
6494.4 |
|
K |
400 |
7 |
160000 |
49 |
2800 |
|
|
|
|
|
|
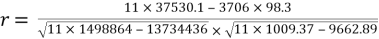 = 0.770735
The Pearson Coefficient of Correlation is 0.770735. This means the Pearson’s Coefficient is a strong positive correlation. It also means ANS and ADVERT have a strong positive linear relationship.
- Regression Analysis
Regression Analysis reveals how the dependent variable changes when the impendent variable(s) is varied. It helps to predict from the unknown. (QTB lecture 3, 2015). Regression analysis is a statistical process for estimating the relationships among variables. Regression analysis is the model of the relationship between the dependent variable(Y) and independent variable(X). Simple linear regression is using an independent variable X, complex regression using more than one independent variable(X1, X2, and X3…Xi). There are six major steps involved in carryout regression analysis. Firstly, the identification of the dependent and independent variables. For example, if the weight of a baby depends on age, then weight is dependent variable (y), age is independent variable (x). Secondly, Build or develop the model using the dependent and independent variable. After identifying the dependent and independent variables a simple diagram could be used to develop model. Thirdly, statement expected relationship between the dependent and independent variable (positive or negative). Moreover, State the function and operationalize the concept of variables. Finally, input the data into to Excel or SPSS and perform the regression analysis.
The Figure 5 below shows the regression of dependent variable (ANS) and independent variable (SQFF, VSI, ADVERT, SALD and NOMP).
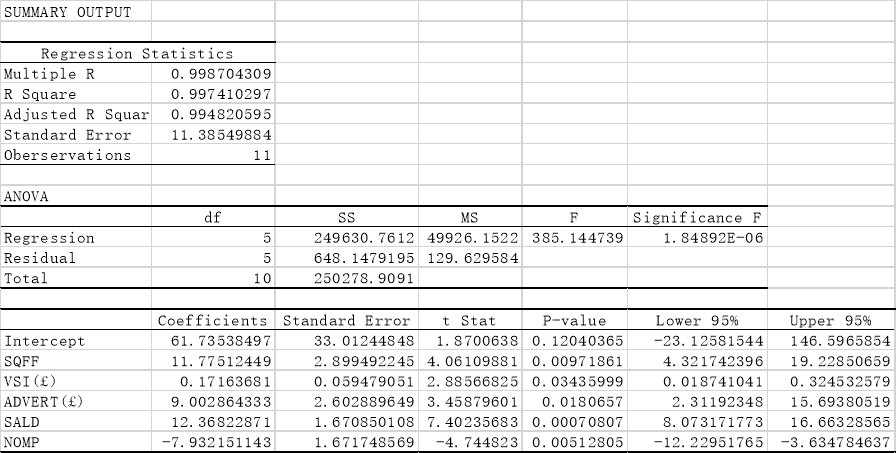
Figure 6
4.1 Regression Model
ANS = 61.74 + 11.78SQFF + 0.172VSI + 9.003ADVERT + 12.37SALD – 7.92NOMP
4.2 Goodness-of-fit / Strength of the regression
Multiple R – 0.99870 or 99.87%
There is almost a perfect correlation between ANS and SQFF, VSI, ADVERT, SALD and NOMP.
R Square – 0.99741 or 99.74%
99.74% of ANS are accounted for by the variation in SQFF, VSI, ADVERT, SALD and NOMP.
Significance F-1.84892E-06 or 0.0000000184892
The entire regression is significant. At the 98.15% level of confidence of at the 1.85% levels of significance.
4.3 Interpretation of the Regression
Sign:
ANS and SQFF:
 Figure 7
From the figure 7, it shows a positive correlation between ANS and SQFF. Meaning for ANS has a high value and SQFF is high.
ANS and VSI:
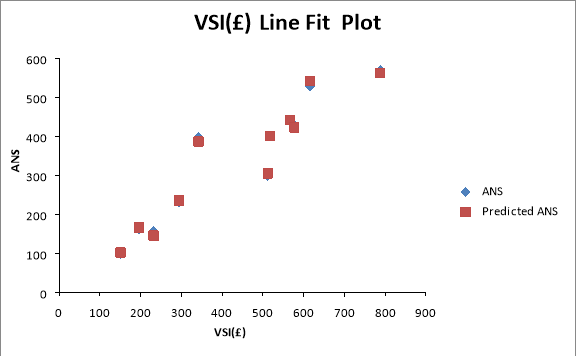 Figure 8
From the figure 8, there is a positive relationship between ANS and VSI. Meaning for ANS to increase, VSI should also increase.
ANS and ADVERT:
 Figure 9
From figure 9, it shows there is a high positive relationship between ANS and ADVERT. Meaning for ANS to increase, ADVERT may increase.
ANS and SALD:
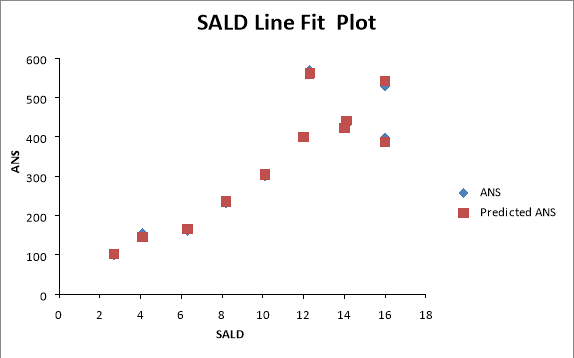 Figure 10
From figure 10, it shows there is a high positive relationship between ANS and SALD. Meaning for ANS to increase, SALD may increase.
ANS and NOMP:
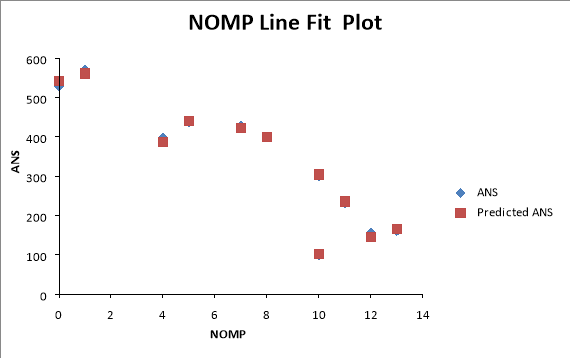 Figure 11
From figure 11, there is a negative relationship between ANS and NOMP. Meaning the more annual net sales, number of competing or similar stores in sales district will be less.
Size:
ANS = 61.74 + 11.78SQFF + 0.172VSI + 9.003ADVERT + 12.37SALD – 7.92NOMP
ANS = 11.78SQFF: For every number of square feet of floor cut, ANS increase by 11.78 (000).
ANS = 0.172VSI: For every unit (1000) increase in VSI, ANS may jumps by 0.172 (000).
ANS = 9.003ADVERT: For every unit (1000) increase in ADVERT, sales jumps by 9.003 (000).
ANS = 12.37SALD: For every unit increase in SALD, ANS increase or decrease 12.37 (000).
ANS = 7.92NOMP: For every unit increase NOMP, ANS rises 7.92 (000).
4.4 Signicance of relationships
P – Values, t-stat, Lower and upper 95% etc:
ANS and SQFF:
P – vaule: 0.00978: Significant at the 5% level
Using L95% and U95%: 4.32174 and 19.22851: No possibility of coming across zero.
Using t-stat: 4.06110: This satisfies  : Significant.
ANS and VSI:
P – vaule: 0.03436: Significant at the 5% level
Using L95% and U95%: 0.01874 and 0.32453: No possibility of coming across zero.
Using t-stat: 2.88567: This satisfies : Significant.
ANS and ADVERT:
P – vaule: 0.01807: Significant at the 5% level
Using L95% and U95%: 2.31192 and 15.69381: No possibility of coming across zero.
Using t-stat: 3.45880: This satisfies : Significant.
ANS and SALD:
P – vaule: 0.00071: Significant at the 5% level
Using L95% and U95%: 8.07317 and 16.66329: No possibility of coming across zero.
Using t-stat: 7.40236: This does not satisfy : Not Significant.
ANS and NOMP:
P – vaule: 0.00513: Significant at the 5% level
Using L95% and U95%: – 12.22952 and – 3.63478: No possibility of coming across zero.
Using t-stat: – 4.74482: This satisfies : Significant.
ANS and Intercept:
t = 1.87006,
p = 0.12040
L95% = – 23.12582 and U95% = 146.59659: Also Significant.
- Conclusion and recommendation
In this assignment, it had discussed how to illustrate and describe the role of statistical data analysis and enable an understanding of statistical methods of the 11 franchise stores. Also, this assignment explained how to appropriate use of relevant statistical tool to interpret data and be able to use of statistical models in decision making and explained the relationship between each element. In addition, this project used the Excel to do the regression and help to set up a new store from these 11 franchise stores. Through the Graphical analysis, Correlation analysis and Regression analysis, Pearson Coefficient of Correlation and Regression, the result could match to the Graph analysis. The annual net sales (ANS) can affect the size of sales district (SALD) and the amount spent on local advertising (ADVERT). The number of square feet of floor display in store (SQFF) can also affect the value of store inventory (VSI). And the amount spent on local advertising (ADVERT) is not key impact factor to size of sales district (SALD).
6.0 Reference
- Curwin J. and Slater R. (2007) Quantitative Methods for Business Decisions, (5th edn) Chapman & Hall
- Wisniewski, M (2010) Quantitative Methods for Decision Makers, (5th edn) FT Prentive Hall
- O’Neil. C and Schutt. R (2014) Doing Data Science CA: O’Reilly Media
- Lucey T (2002) Quantitative Techniques, Thomson Learning
- Morris, Clare (2008) Quantitative Approaches in Business studies. Printed by Estella, Spain
- Swift, L, Piff, S. (2010) Quantitative Methods for Business Management and Finance, (3rd end) Palgrave
- Field, A. (2009). Discovering statistics using SPSS. Sage publications
- Sekaran, U (2006). Research methods for business: A skill building approach. John Wiley & Sons
- QTB lecture 1 (2015). Correlations. LSC.
- QTB lecture 3 (2015). Regression Analysis. LSC.
1
Cite This Work
To export a reference to this article please select a referencing stye below:
Related Services
View all


DMCA / Removal Request
If you are the original writer of this essay and no longer wish to have your work published on UKEssays.com then please click the following link to email our support team:
Request essay removal