Shareholder Value Analysis of GSK
| ✅ Paper Type: Free Essay | ✅ Subject: Economics |
| ✅ Wordcount: 3932 words | ✅ Published: 29 Aug 2017 |
Executive summary
This report serves two purposes. Firstly, it provides a valuation and analysis of GlaxoSmithKline plc (GSK) using Shareholder value analysis (SVA) method. Secondly, it examines the GSK-Novartis’s oncology-vaccines asset swap through the lens of competitive advantage.
The SVA method produces an equity valuation of £84,854m for GSK, compared to the actual market capitalization of £77,015m as of January, 17th 2017, the SVA-based valuation indicates that the company is being 9.2% undervalued by the market. The examination of the asset swap’s context suggests that GSK divested its oncology business because it lacked the scale to sustain competitive advantage in oncology market, whereas by acquiring Novartis’s vaccines portfolio, the company obtains sustainable competitive advantage other competitors in the vaccines market.
Recommendations discussed include:
- For GSK, reducing WACC through leveraging to can increase its shareholder value.
- For investors, paying attention to how GSK chooses to maintain competitive (through further deals or improvement of its underlying capabilities), and how it makes profit under differential pricing because they will significantly influence GSK’s shareholder value.
1.1 Company profile
GlaxoSmithKline Plc (GSK) is one of the world’s leading research-based pharmaceutical and healthcare companies that operates through three key segments of Pharmaceuticals, Vaccines, and Consumer Healthcare. The company develops, manufactures, and distributes vaccines, prescription drugs, and over-the-counter medicines, as well as consumer healthcare products. The company is quoted on the London and New York stock exchange with headquartered in Brentford, United Kingdom.
The three segments together generated £23.9 billion in 2015 with much of the turnover coming from Pharmaceuticals business. Operation in the US and Europe accounted for 73% of the group’s turnover (GSK, 2015)
GSK has positioned itself among the largest companies in the global pharmaceutical industry, with sales ranked 7th based on 2015 turnover (Figure 1). With the acquisition of Novartis’s global Vaccines business, GSK effectively owns over 20% of the global Vaccines market share with the most comprehensive portfolio in the industry. GSK, along with Sanofi S.A, Merck & Co., and Pfizer Inc, forms an unchallenged oligopoly in the Vaccines market with 87% of total market share (Figure 2). The joint venture with Novartis that GSK has controlling interest is a world-leader in Consumer Healthcare business, ranked 3rd in sales in 2015 (Figure 3).
GSK is known for its global presence with 101,255 employees in more than 150 markets. It ranked No.1 in customer trust for both Respiratory and Vaccines in the U.S in 2015. In addition, GSK possesses one of the most powerful distribution network of 89 manufacturing sites around the world (GSK, 2015). However, what differentiates GSK from other pharmaceutical giants is that it has the most well-diversified drug portfolio, with the lowest ratios for the contribution of top-3 drugs to its revenues in 2015 compared to other top companies[1] (Dezzani, 2016).
1.2 Justification of variables
Rappaport (1999) states seven drivers that a business can manage to create value, with the improvements in these drivers leading to an increase in shareholder value.
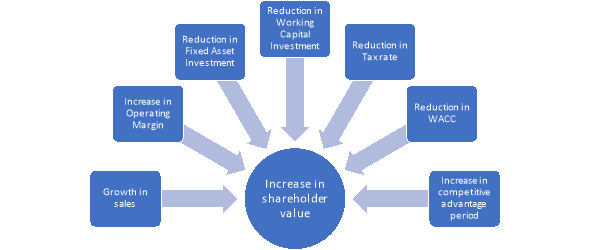
Figure 4: Rappaport’s seven value drivers.
One of the various measures developed from Rappaport’s ideas was the Shareholder value analysis (SVA), which is similar to the traditional Discounted Cash flow measure in that they value a company based on projected future cash flows (Minchington and Francis, 2000).
This report employs the SVA to estimate GlaxoSmithKline plc value over a 5-year planning horizon. GSK’s fundamental shift towards the high-volume, low margin businesses of Vaccines and Consumer Healthcare with the Novartis deal[2] played a deciding role in key growth rate estimations. Historical data used are extracted from Bloomberg via Bloomberg Terminal. Key variables were derived with the following assumptions:
A sales growth rate of 13% for the planning horizon, and followed by zero growth from 2016 onwards into perpetuity. Inferring a growth rate based on previous years’ average growth was unjustified by the wide fluctuation in sales for the 2013-2015 period[3]. Hence, the sales growth was derived from two expectations. Firstly, the future sales growth is expected to be higher than that of 2015 to sustain operating profit, since GSK have increased exposure in high volume and low margin products. The full fiscal year 2016 sales were projected base on the 9 months’ sales from Q3 report, which gave around 13% sales growth in 2016 sales[4]. Secondly, the changes arose from the Novartis deal such as restructuring, and reshaping of cost base are resolved and GSK is better positioned to drive sustainable growth from 2016. (GSK, 2015). Hence, the 2016 sales growth was employed to represent GSK sales growth onwards.
A consistent operating profit margin at 20% from 2016 onwards. This margin was derived from the sales and adjusted operating profit in 2015, under the assumption that operating margin will not increase proportionately with sales, since GSK has shifted to lower margin businesses that requires larger sales to sustain existing operating profit margin.
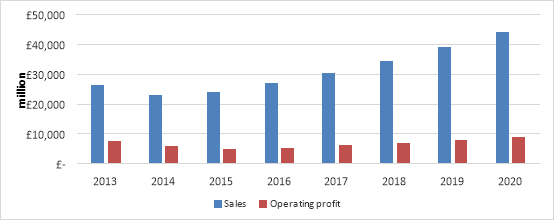
Figure 5: GSK’s actual and projected sales and operating margin
An incremental capital investment (ICI) of 53% was derived from the changes in Property, Plant, and Equipment (PPE) and Investment in associates in relation to changes in sales for 2014-2015 period. Intangible assets were considered to have no material change due to the 2015 recognition of GSK’s one-off acquisition of Novartis’ Global Vaccines business that heavily distorted the changes in Total Intangible assets and hence, ICI[5]. Omitting the fluctuations in intangible assets for the ICI calculation period is likely to present a fairer view of GSK’s capital investment behavior because firms need only investment in real assets like PPE to continue operation[6]. An ICI of 53% is plausible and is in line with the continuation of signiï¬cant investments in GSK manufacturing network in the previous years (GSK, 2015, p.31).
An incremental working capital investment (IWCI) of 22.5% was chosen for 2016 onwards. This is the average of 2014 and 2015 “Working capital percentage of turnover” of 22% and 23% respectively (GSK, 2015, p.65). This IWCI is deemed representative because even with the impact of the Novartis deal, GSK’s working capital did not fluctuate much, indicating competent management of receivables, inventories, and payables. A positive IWCI is common as working capital must be sufficient to cover current liabilities as well as ensure a reasonable margin of safety (Chhapra and Naqvi, 2010).
A corporate tax rate of 20% was assumed for FY 2016 to 2019 and 18% for 2020 onwards. The adjustment was because the UK government announced legislation setting the Corporate Tax main rate at 19% for the years 2017, 2018 and 2019 and 17% for 2020 onwards. The 1% higher chosen tax rate is expected to capture the momentum of increasing weight of earnings from the U.S, where it accounts for 34% of GSK’s revenue in 2015, with a higher taxation regime. Small fluctuations around the chosen tax rate are deemed unlikely to have meaningful impact of GSK’s underlying value.
The weighted average cost of capital (WACC) for GSK was calculated to be at 6.28% through several inputs. The Capital Asset Pricing Model (CAPM) was used to derive the cost of equity of 6.93%. The risk premium of 5.97% was obtained from Damodaran (2017). GSK’s beta of 0.94 was obtained from Bloomberg Terminal and was the one-year historical adjusted beta measured against the FTSE 100 Index. The reason for employing a short beta period was because GSK had undergone massive restructures, acquisitions and divestments of businesses throughout the last two fiscal years, to the extent that the Group might have altered its characteristics, i.e. shifting towards low margin vaccines and consumer healthcare businesses, hence offsetting the benefit of having more observations using longer period beta (Damodaran, n.d). Consequently, the one-year adjusted historical beta was employed with the belief that it better represents the new level risk that GSK carries forward into the future[7].
The risk-free rate of 1.32% was the 10-year UK Gilt yield extracted from Financial Times. The idea of using long-term government bond yield is that they are risk-free and offer the discount rate that is expected to match up with the cash flows that are being discounted when they occur (Damodaran, 2008). Cost of debt of 4.10% was the weighted average cost of GSK’s long-term debts.
1.3 Employment and appropriateness of SVA model
1.3.1 Employment of SVA model
With the key variable forecasts summarized in table 1, under SVA model, the equity value of GlaxoSmithKline plc was estimated through the following steps.
Step 1: Calculation of free cash flows
|
Actual |
Planning Horizon |
Future |
|||||
|
2015 |
2016 |
2017 |
2018 |
2019 |
2020 |
2021 onwards |
|
|
£M |
£M |
£M |
£M |
£M |
£M |
£M |
|
|
Sales |
23,923 |
27,033 |
30,547 |
34,518 |
39,006 |
44,077 |
44,077 |
|
Operating profit |
5,407 |
6,109 |
6,904 |
7,801 |
8,815 |
8,815 |
|
|
Less Tax |
1,081 |
1,222 |
1,381 |
1,560 |
1,587 |
1,587 |
|
|
Less ICI |
1,648 |
1,863 |
2,105 |
2,378 |
2,688 |
0 |
|
|
Less IWCI |
700 |
791 |
894 |
1,010 |
1,141 |
0 |
|
|
Free cash flow |
1,977 |
2,234 |
2,525 |
2,853 |
3,400 |
7,229 |
|
The FY 2015 sales of £23,923m increased periodically by the growth rate of 13% over the 5-year planning horizon. The 20% operating profit margin was then applied to sales turnover to calculate GSK’s operating profit. To arrive at GSK’s free cash flows, the projected tax rate of 19% and subsequently the 53% incremental capital investment was deducted from the Group’s operating profit. Under presented assumptions, sales, and operating margin from 2021 onwards stayed constant at 2020 level, and there exists no ICI and IWCI as sales stops growing.
Step 2: Calculation of Discounted cash flows and Terminal value
|
Planning Horizon |
Future |
|||||
|
2016 |
2017 |
2018 |
2019 |
2020 |
2021 onwards |
|
|
Free cash flow, £M |
1,977 |
2,234 |
2,525 |
2,853 |
3,400 |
7,229 |
|
Discount factor, WACC of 6.28% |
0.941 |
0.885 |
0.833 |
0.784 |
0.737 |
11.745 |
|
Discounted cash flow, £M |
1,860 |
1,978 |
2,103 |
2,236 |
2,508 |
84,896 |
|
Sum of discounted CF, £M |
95,581 |
|||||
The present values of future cash flows were calculated by discounting those cash flows by the WACC of 6.28%. GSK’s terminal value of £83,861m was discounted twice, the first one was by 2020’s discount rate and the second was the WACC with the no-growth assumption after the planning horizon. The sum of all discounted cash flows was then calculated.
Step 3: Calculation of shareholder value
|
£M |
|
|
Total discounted cash flows |
95,581 |
|
Add Cash & Cash equivalents |
5,905 |
|
Less Debt (book value) |
16,632 |
|
Equity value SVA |
84,854 |
Adjustments to the total discounted cash flows were made by adding £5,905m of cash and cash equivalents and then deducting £16,632m of debt to arrive at GlaxoSmithKline plc’s intrinsic value of £84,854m.
1.3.2 Appropriateness of SVA model on GSK
The SVA method offers a long-term picture by forecasting the future value for key variables that influence a firm’ cashflows. Nonetheless, it is common for such forecasts to be based on historical data. Hence, without allowance for changes in key values, a firm will likely to replicate its past performance under SVA model (Pandey and Arora, 2015). This characteristic makes SVA suitable for matured firms that have stable financial performance, without any foreseeable change to their core strategies. GSK, however, does not belong to this category. The finalization of the GSK-Novartis deal on 28 January 2015 marked “a very fundamental shift” of strategy away from high-price, low-volume towards high-volume and low-price drug according to GSK’s CEO Sir Andrew Witty (Cooper, 2015).
GSK, with the Novartis deal, effectively positioned itself among market leaders in the fast-growing Vaccines and Consumer Healthcare businesses with unchallengedly big market share. Higher market shares translate into higher sales, and thus GSK would enjoy the “experience curve”, a phenomenon whereby with each doubling of a company’s cumulative output, cost per unit of output declines geometrically, making bigger company much more profitable (Buzzel, Gale and Sultan, 1975).
This suggests that GSK’s operating margin could reach higher than 20% from 2016 onwards, which the SVA method might have failed to fully capture with its binding constant rate assumption. This could result in a lower valuation of GSK’s true worth. Moreover, by turning into a growth firm, most of GSK’s added value from the increased market share should present themselves sooner rather than later. However, the SVA method shows 88.8% of GSK’s value lies in the terminal value in the uncertain perpetuity. Hence, one could argue that if most of the firm’s value lies in terminal value, there exists little benefit and reliability for doing valuation.
While the SVA method has performed well to give GSK a higher valuation than the market value, reflecting to some extent a strong prospect for GSK in the future, it is believed that under more flexible terms, GSK can worth a higher valuation.
1.4 Comparative analysis
Under SVA method, GlaxoSmithKline’s fair equity value was £84,854m, while its market capitalization was at £77,015m as of January, 17th 2017. The result implied that GlaxoSmithKline was being undervalued by 9.2% by the market.
Fama (1970), in his Efficient Market Hypothesis (EMH), put forward the idea that share prices in efficient markets reflect all known information available to investors. The EMH’s the strong-form suggests that the current price incorporates all existing information, both public and private, making share price always reflect the true value of the firm. Thus, under this version of EMH, the SVA valuation of £84,854m indicates a 10.2% inflation in the true value of GSK. However, several well-cited studies including Jaffe (1974) and Rozeff and Zaman (1988) offer extensive evidence for profits made from private information, hence effectively refute the strong-form EMH and suggest that share prices are subject to inaccurate pricing. Such mispricing can be explained from behavioral finance perspective. Barberis, Shleifer and Vishny (1998) suggest that under “conservatism bias”, investors tend to underestimate the importance of new information and that share prices will adjust slowly until all the information is captured. Accordingly, one can argue that GSK’s improved performance in 2016 has not been fully reflected in GSK value, resulting in the gap between SVA valuation and GSK’s market capitalization.
Model wise, the binding assumptions under SVA might have also contributed to the value discrepancy. While GSK’s sales growth of 13% was justified, the ability to sustain such growth throughout the 5-year planning horizon is questionable in the saturated and highly competitive pharmaceutical market. Similarly, the idea that WACC of 6.28% remains constant without subsequent adjustments limits any impact of potential GSK’s capital structure change in the future. In addition, while the market risk premium (MRP) of 5.97% taken from Damodaran (2017) can be considered a good proxy, it might not have fully captured the risk facing UK-based firms, especially with the uncertainties of Brexit. For instance, increasing the MRP to 6.55% gives a near identical valuation with the actual market value. In the end, a model is only as good as its inputs.
1.5 Sensitivity analysis
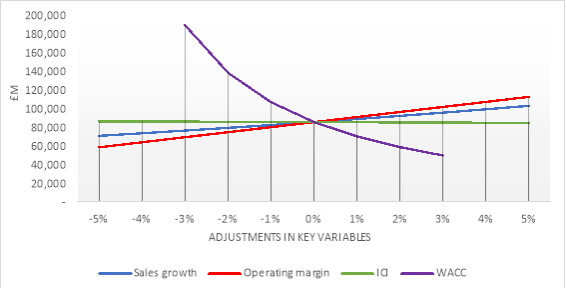
Figure 6. GSK sensitivity analysis of key variables against Equity value.
From the sensitivity analysis, it is evident that that GSK’s valuation of £84,854m is most susceptible to changes in the firm’s WACC (6.28%). An increase of 2% in the WACC results in a 31.6% decline in GSK’s value. This is expected as 88.8% of GSK value lies in terminal value which is highly sensitive to changes in discount rate. Operating margin comes in second as the most critical variable. A decrease of 5% reduces GSK’s value by 31.8%. The third critical variable is sales growth, whose 5% decrease results in a 17.3% loss in GSK’s value. Changes in ICI have negligible impact on GSK’s value.
By understanding these relationships, GSK can make strategic decisions that maximize its shareholder value. For instance, with the cost of debt (4.1%) is lower than cost of equity (6.9%), it is logical for GSK to secure more debt should it need external financing. This action will lower its WACC and in a world of tax, leveraging would raise the value of GSK (Modigliani and Miller, 1963). Regarding operating margin, reducing operating costs is crucial to a higher margin and hence higher valuation. GSK is already ahead of schedule on its integration and restructuring programs and realized £1bn of incremental annual cost savings in 2015, with a £3bn of savings goal by the end of 2017 (GSK, 2015). Thus, the Group is expected to exhibit an even stronger operating margin in the coming years.
2.1 The transaction
The GSK-Novartis’s asset swap was a constituent of the £20-billion transaction between GSK and Novartis that completed on 28 January 2015. The deal involved the swap of GSK’s oncology business for Novartis’s global Vaccines business[8], and the creation of a world-leading Consumer Healthcare joint venture that GSK has controlling interest.
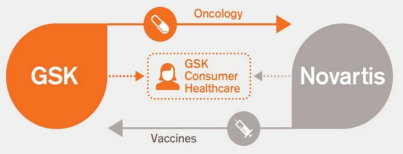
Figure 7: GSK-Novartis transaction
Source: GSK, 2014
In an asset swap, the parties involved play both the role of the seller and the buyer. While in theory it would lower the overall cost for both parties compared to buying and selling separately, the chance of finding a matching and willing counterparty is slight. Consequently, the GSK-Novartis asset swap was the first of its kind in the pharmaceutical industry. DePamphilis (2009) argues that asset swaps can be an attractive alternative to mergers and acquisitions as a restructuring tool only when there exists substantial similarity in the physical characteristics and use of the assets involved. In GSK-Novartis case, the acquisition of the highly complementary Novartis’s global Vaccines business significantly enhances the breadth of GSK’s existing vaccines portfolio and pipeline[9], as well as strengthens its manufacturing network and increase the overall capacity with Novartis’s global packaging and supply facilities (GSK, 2014a). The same situation applied to Novartis, who has always been a powerhouse in oncology and has significant global presence. Both parties paid cash, which was a demonstration of the Pecking order theory by Myers and Majluf (1984), in that when funding a new project, companies would consider the cost of financing and prefer internal source of finance to external sources like debt and equity. Despite the observable benefit, GSK’s oncology divestment raised many issues with investors.
Leading up to the deal finalization was a troubling year for GSK with a near 50% drop in its net profit[10], caused largely by the sales plunge of its blockbuster asthma drug, Advair, which at one point contributed 20% of GSK’s total revenue (Palmer, 2014). In addition, GSK’s oncology business was profitable with sales growth of 33% YoY (GSK, 2014b). The global oncology market was also expected to grow up at a rate up to 10.5% through 2020 (Parsippany, 2016). Understandably, in that context, GSK’s move received many critics for leaving one of the most lucrative and fastest-growing fields of the pharmaceutical industry for “toothpaste, headache pills and flu jabs” (Ward, 2015). The following section examines the swap deal from GSK’s perspective and discusses the underlying reason for GSK’s divestment of oncology, as well as the impact of the acquired vaccines business on GSK’s strategic position.
2.2 Discussion of GSK’s oncology divestment
GSK’s transition away from oncology business can be examined through the lens of resource-based competitive advantage, particularly “Resource heterogeneity” concept. Heterogeneity suggests that resources and capabilities underlying production are different across firms (Barney, 1991). Superior-resource firms thereby have higher level of efficiency, enabling them to achieve lower average costs. Nonetheless, firms with superior resources are usually big firms with high level of sales. Ultimately, “resource heterogeneity” implies that such firms can enjoy higher margin and with that, a competitive advantage over competitors[11].
Applying to GSK, despite having resources of a pharmaceutical giant, the company’s sales in oncology were insubstantial and never penetrated the top 10 leading oncology companies by sales. GSK’s sales of $1,377m in 2013 were at only 47% of the 10th position, Takeda and at 5% of the 1st position, Roche (Figure 8). Thus, one can infer that top oncology companies had much lower average costs than GSK did, granting them higher profitability and an edge in competitiveness over GSK. Dr. Moncef Slaoui, GSK’s Chairman of Vaccines commented that since GSK was not the first nor the biggest in oncology, the chance that it succeeds at commercial level was low (Asher, 2015). The difficulty intensifies with the fact that oncology research has the lowest overall success rate across major disease categories (Figure 9), and its market is saturated with a global set of over 500 companies actively pursuing oncology drug development (Parsippany, 2016). Consequently, GSK decided not to gamble its capital in the unpredictable boom and bust of the oncology pipeline success, and divested its oncology business to Novartis, a much more formidable player in the cancer field. Despite being profitable, GSK lacked the scale to advance its competitive advantage.
2.3 Impact on GSK’s strategic position
The acquisition of Novartis’s vaccines business effectively propelled GSK into becoming a market leader in vaccines field with substantial market share of over 20% (Figure 2). Somewhat like “resource heterogeneity” concept Buzzel, Gale, and Sultan (1975) argue that large-market share companies, through economies of scale, have advantage in procurement and manufacturing over their smaller rivals. This edge translates into higher sales and profitability. Post Novartis transaction, GSK’s vaccines sales grew 19% to £3,657million for the financial year 2015. The enhanced sales situation continued with sales for the nine months in 2016 reached £3,455million, with a 18% reported growth. (GSK, 2015, 2016).
GSK achieved what it could not in oncology field, having competitive advantage in Vaccines market. GSK’s margin improved with bigger market share. For the nine months in 2016, the operating profit margin of vaccines segment rose by 4.1 percentage points to 33.9% YoY. Peteraf (1993) argues that while heterogeneity is necessary for competitive advantage, such advantage is not sustainable without “Ex-post” limits to competition, i.e. there must be forces to keep competition from eroding the high margin enjoyed by firms with competitive advantage[12]. Indeed, GSK’s diverse set of patent-protected drugs across three segments offer protection from competitors for years, sufficient for the Group, with its substantial R&D spending, to have its next generation of patented drugs ready (Conover, 2013). Thus, by divesting its oncology business, GSK rises as a powerhouse in vaccines market with sustainable competitive advantage.
2.4 Potential issue and implication
Firstly, it is crucial to recognize that GSK’s improved performance was primarily the result of increased market share, not the fundamental changes in underlying capabilities that create higher level of competitiveness. Hence, it is expected for GSK’s acceleration in sales and operating margin to slow down once they have reflected the added benefit and combined capabilities of GSK and Novartis’s vaccines business. Moreover, when competitors start employing the same strategy that GSK and Novartis used[13] (Figure 10), the dynamic of market share will change and so will GSK’s competitive advantage. GSK must then make strategic decisions on what its future performance will rely on. Should it follow up the success with more deals to consolidate its strategic position in Vaccines and Consumer Healthcare, or should it focus on R&D of its pipelines for a fundamental improvement in its competitiveness? Either decision is likely to have significant impact on GSK’s long-term prospect.
Secondly, GSK, with the Novartis transaction, has solidified its strategic shift towards volume in emerging markets. However, it is uncertain if GSK can enjoy a high margin from these markets due to “differential pricing”[14]. As an adopter of differential pricing, GSK commits to offering substantially-reduced priced, and even not-for-profit vaccines and medicines for the many poor countries in emerging markets (Babar and Atif, 2014). Coupled with the inability and unwillingness to pay for innovative drugs since low-income countries only spend up to 6% of GDP on healthcare, compared to 10% of GDP in high-income countries (International Trade Administration, 2016), pharmaceutical giants like GSK effectively lose their pricing power and become price-takers. Consequently, while emerging markets can bring in sales, the artificially lowered prices may adversely impact GSK’s profitability and concern shareholders.
The aims of this report were to determine the valuation of GSK under SVA method, and evaluate the impact of the acquired vaccines business from Novartis on GSK’s strategic position. Firstly, the SVA method produces an equity valuation of £84,854m for GSK, which indicates that the company is being 9.2% undervalued by the market. Both “conservation bias” and underlying assumption errors could have been responsible for the price discrepancy. The evidence from sensitivity analysis suggests that by being most susceptible to changes in WACC, GSK may choose debt issuance when it needs external funding to exploit the lower cost of borrowing as well as reduce the WACC to benefit its value. Secondly, GSK’s divestment of oncology and move towards vaccines were justified through the lens of competitive advantage. However, it is advisable for investors to pay close attention to GSK’s future decisions because how the GSK chooses to stay competitive (through further deals or improvement of its underlying capabilities), and how it makes profit under differential pricing will significantly influence its shareholder value.
4.1 List of figures
Figure 1. Top pharmaceutical companies by sales in 2015
Cite This Work
To export a reference to this article please select a referencing stye below:
Related Services
View all


DMCA / Removal Request
If you are the original writer of this essay and no longer wish to have your work published on UKEssays.com then please click the following link to email our support team:
Request essay removal