Reasons for International Economy Stagnation 1970s
| ✅ Paper Type: Free Essay | ✅ Subject: Economics |
| ✅ Wordcount: 2013 words | ✅ Published: 29 Aug 2017 |
Discuss the reasons for the stagnation in the international economy during the 1970’s.
Introduction:
Countries generate economic growth by increasing their production capacity of tradable outputs, by increasing the supply of labour, by reducing their expenses and by increasing the level of education. In other words, a decrease in the rate of production, trade, employment, innovation and an increase in costs/expenses would engender a deceleration of the growth rate. In this case the economy of a country is likely to converge towards a stagnation or recession state.
“Stagnation is a prolonged period of little or no growth in an economy.”
“Economic growth of less than 2 to 3% annually is considered stagnation, it is highlighted by periods of high unemployment“
“Stagnation is a situation that occurs within an economy when total output is either declining, flat or rising just slightly.”
Source: http://www.investopedia.com/terms/s/stagnation.asp#ixzz4T2b1EUcu
This essay will discuss the different reasons of the 1970’s stagnation by analysing the international economic climate of the period before the stagnation and by examining the factors which lead and accelerated this international stagnation. This essay will also provide an outlook of the effect that this stagnation had on populations.
Background to the 1970’s stagnation
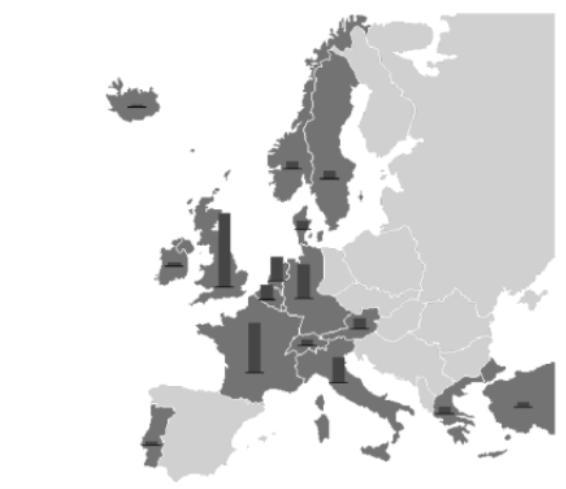
In 1947, two years after the world war 2 which generate a huge economic loss (1939-1945) and during the cold war which was a conflict between the CAPITALIST Western bloc (the United States of America with France, United Kingdom, West Germany and other capitalist countries) and COMUNIST Eastern bloc (the Soviet Union with Albania, Ukraine, Yugoslavia, and other communist/socialist countries), The USA established a loan of over $12.5 billion to help for the recovery of the western Europe and the reparation of the war’s damages. This help was “the marshal plan”. The marshal plan’s aims were to eliminate the trade barriers, boost the European economy and defeat the expansion of the communism. According to The Marshall plan 50 years later written by Martin A. Schain the majority of the loan was received by the UK which received approximately 26% percent of the total loan followed by France which had 18% and west Germany with 11%.
source:Â United States History – Part B – Page 101
From 1945 to 1953 The Asia benefited of an American loan of $5.9 billion which was not included in the Marshall plan. According to the U.S. Bureau of the Census, Statistical Abstract of the United States: 1954 (1955)
China/Taiwan ($1.051 billion), India ($255 million), Indonesia ($215 million), Japan ($2.44 billion), South Korea ($894 million), Pakistan ($98 million) and the Philippines ($803 million). In addition, another $282 million went to Israel and $196 million to the rest of the Middle East.
In total The United States of America provided 44.3 billion to boost the “post war” global economy and repair the damage caused by the war.
The Marshall plan and the aid given by USA to the rest of the world helped for the development of commercial aviation (which allows faster transport of goods) and the technological changes (widespread use and development of fertiliser and pesticide). It has also facilitated international trades and led to the world economic boom of 1945-1973.
According to The American Institute of Aeronautics and Astronautics, “Commercial air transportation came of age in the post-war world. World War II provided a legacy of well-traveled air routes stretching around the globe, experienced aviators, proven equipment, and experience in managing international air traffic. By 1950, the airliner was positioned to replace the railroad and the ocean liner as the primary means of long- distance travel.”
According to the article made by Bill Ganzel and Claudia Reinhardt in the Gazel Group “By 1950, the annual capacity for ammonia production had shot up from 1.6 million tons in 1946 to 2.6 million tons. Artificial fertilizers combined with new hybrid crops, new pesticides and developments in irrigation to produce an explosion in crop yields and production.“
The table shows the increase of international trade in agricultural and foods product from 1934 to 1954 in thousands of US dollars at 1925 prices
|
1934-38 |
1948-50 |
1952-54 |
|
|
US $ thousands |
14,157,433 |
13,531,753 |
15,462,611 |
|
Index Number |
100 |
96 |
109 |
Source: Agriculture in Capitalist Europe 1945-1960 From food shortage to food surplus by Carin Martiin, Juan Pan-Montojo, Paul Brassley
The Graph bellow shows the evolution of the Gross Domestic product per capita of France, Germany, Italy, UK, USA, USSR and Japan from 1900 – 1970. All these country has experienced a growth from 1945.
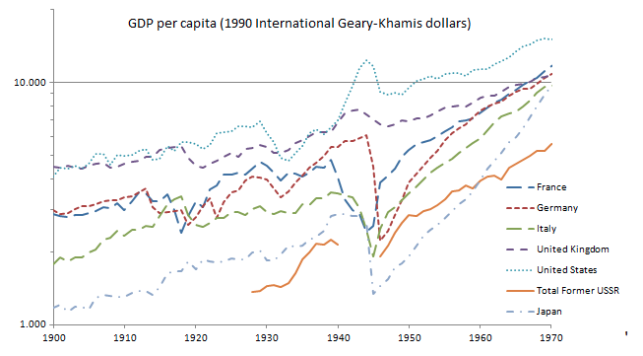
Source: Maddison Historical Statistics
The 70’s Stagnation
From the end 1973, the post-world war 2 economic boom became an international stagnation known as the 70’s stagnation (1973-1978).
“The largest slowdowns were in pipelines, auto repair, and oil and gas extraction – industries heavily affected by the energy crises of the 1970s. These industries also showed large declines in output growth over the same period.” Carlos Lozada- The National Bureau of of Economic Research
The bar bellow shows the world GDP annual growth in 1974 at 1.99%.
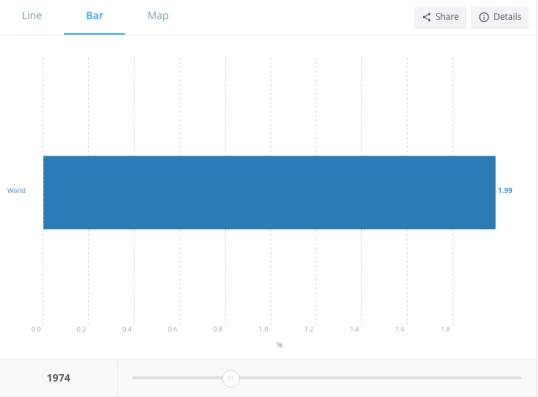
Source : http://data.worldbank.org/
Several event/change that happen during this period can be taken as the reasons of this stagnation.
- The collapse of the Brenton Wood system
Established in 1944, the Bretton Wood agreement is system a monetary and exchange rate management system which aim to offer a constant exchange rates to boost economic growth and investment, to stimulate countries to keep low inflation to conserve the value of the exchange rate and to prevent competitive devaluation which is a situation where a country try to get trade advantage on others by making the exchange rate of their currency fall while the currency of other countries stays the constant or rise.
According to the Reform of the International Institutions: The IMF, World Bank and the WTO
The dollar was fixed to the price of gold ($35 an ounce) – giving the US Dollar a fixed value. But this international settlement broke up in 1973 (Under the US president Mr Nixon) because of an overvaluation of the dollars with a failure in the negotiation with west Germany to revalue the Dutch mark, the trading at deficit of the US and the excessive U.S. monetary expansion.
A symptom of the vulnerability of this system was the devaluation of the pound in 1967 (from $2.80 to 2.40) according to The Collapse of the Bretton Woods Fixed Exchange Rate System Peter M. Garber this sterling crisis led to the abandonment of the gold leg of this system as the pound was the second important reserve currency behind the dollar.
- Oil crisis
According to The Oil Crisis by Fiona Venn, main economic powers such as the USA, UK or Japan suffered of the embargo imposed by members of the OAPEC (Organization of Arab Petroleum Exporting Countries) because of their assistance to Israel in 1973. In 1979 another rise of oil price’s happened this time it was because of the Iranian revolution. This embargo and the Iranian revolution led to the oil/energy crisis and pushed the countries affected to rise prices of certain commodities such as food, lower the exportation and make regulation to spend as less oil as possible. As an example to save oil, policies like speed limit was imposed in the UK. According to The Times. 1973-12-07. p. 4. The speed limit in the U.K. Was 50mph for all roads in 1973. The oil crises have restraint the transport of good and it also forced seller to raise the prices of certain commodities for example the commodity boom 1972-75 by ROBERT Z. LAWRENCE and RICHARD N. COOPER reported that the price of sugar rose more than five times as oil became expensive. This created a phenomenon of inflation. According to Davis, E. Philip (January 2003). “Comparing bear markets – 1973 and 2000”. National Institute Economic Review. 183 (1): 78-89. The inflation raised dramatically from 3.4% in 1972 to 12.3% in 1974.
The graph bellow shows the crude oil prices from 1946 to 2008. This graph shows that crude oil prices has known peaks in 1973 at $41 a barrel and in 1979 at $119.33. 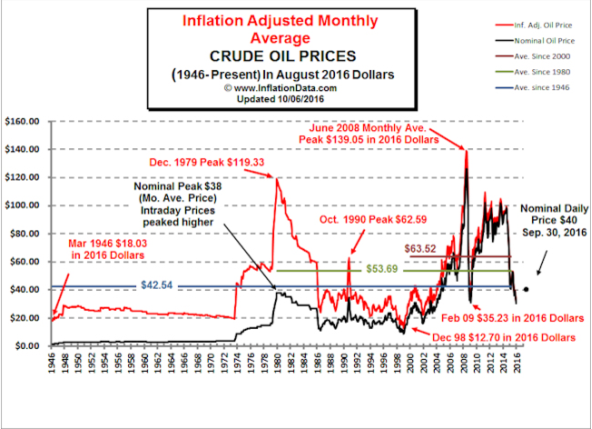
The graph below shows the annual growth of exports of goods and services in percentage with two fall corresponding to the two oil shock. One from 1973 to 1975 (from 10.63% to -4.346%) and another from 1979 to 1980 (from 5.801% to 1.981%)
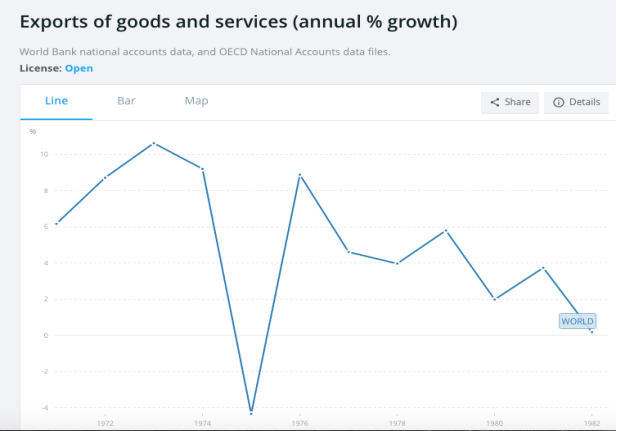
Source: World Bank
As the price of essential commodities rose and as the 1970’s known a period of international economic stagnation this resulted to a wage stagnation and push the population to protest. An example of protestation is the UK miners’ strike in 1972 and 1974 which both ended by an increase in miner’s wage by the government.
The graph bellow shows the evolution of food price index adjusted for changes in exchange rates with a rise from 1973 to 1975 and a peak in 1980 (correlation with the oil shocks).
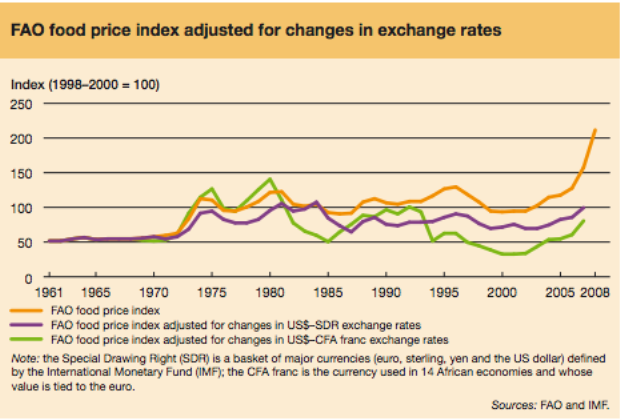
Another factor that have to be taken into account to explain the rise of food index price is the weather which is an exogenous factor that has decreased the productions while the demand for food and meat increased.
“However, in 1972, bad weather hit crops across the globe and world food production dropped for the first time in 20 years, down 33 million tonnes at a time when the world needed an extra 24 million tonnes to meet the needs of a rapidly rising population. In the following year, a new supply shock played its part in fuelling higher agricultural prices – oil prices quadrupled.“
Source: The Time 1974
- 1973-1974 Stock market Crash
The Financial crisis of 1973-1974 is also a reason of the 1970’s. This crisis has many origins. The failure of lord Anthony barber (the chancellor of the exchequer 1970-1974) to lower the rising unemployment rate caused by the falling output, the failure of the Heath government to fixes rent prices in 1971 and the ambiguity in the financial sector caused by the collapse of Bretton wood’s system.
The graph bellow shows the U.K unemployment rates from 1881-1995 with a rise of unemployment rate between 1974 and 1986 (from 2% in 1974 to a peak of 14% in 1983).
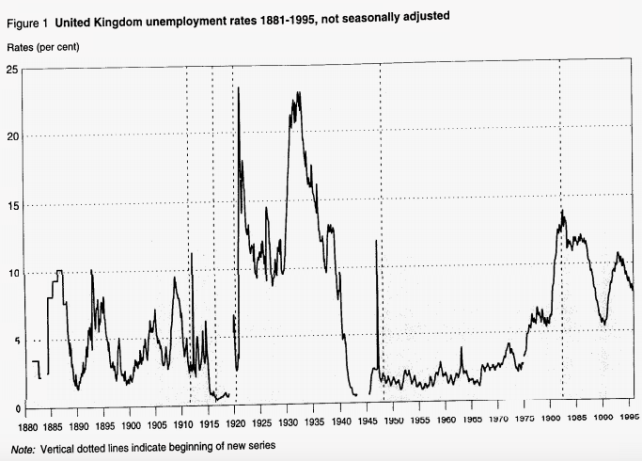
Source: Office for National Statistic
According to an article written in the guardian by Rupert Jones, “In 1973, house prices rose in real terms by 24.7%. At that time, the average price of a property was £9,942, compared with £155,467 today. The 1973 price equates to £81,226 at today’s values.”
Due to this crash, the Dow Jones average benchmark (New York stock exchange’s indices) lost approximately 45% of its value and the London stock exchange’s FT 30 lost 73% of its value.
Sources:Â Woodard, Dustin. “1973 – 1974 Stock Market Crash”. About.com. Dampier, Mark (6 May 2003). “Reading the stock market”
According to John D. Turner in the Banking in Crisis the Rise and Fall of British Banking Stability, 1800 to the Present, and the world bank data, this crash has partially participated to the slow of the U.S economy growth (from 5.263% of annual GDP growth in 1972 to -0.517% in 1974) and UK economy growth (from 4.294% of annual GDP growth in 1972 to -2.473% in 1974)
To resume, the major reason of the international stagnant economy of the 70’s was the collapse of the Bretton wood system, the oil crisis and the financial crash. This reduced the population’s purchasing power as wage were stagnant and prices rising. Another fact which can be seen as a brake to the international growth are the government public spending as percentage of GDP which is an expense that rose sharply during the 1970’s as an example the United Kingdom, according to Office for Budget Responsibility this figure rose from 40% in 1971 to a peak of 49% in 1978.
Some economist such as Christina D. Romer or Arthur Franck burn tend to argue that the reason of the 1970’s stagnation and other economics slow is the business/economic cycle. The history shows a correlation with this theory but the lack of regularity of the timing of this theory makes it not fully tangible.
(Example of cycle: boom of the roaring 1920’s – 1930 Great depression / 2000s commodities boom – Great Recession 2008).
“Just as there is no regularity in the timing of business cycles, there is no reason why cycles have to occur at all.” Source: the concise encyclopaedia of economics by Christina D. Romer
To conclude, the 1970’s has been a difficult period for the wealthy countries’ economy that is why from 1980 they set up policies to redirect their economy from a cold war economy to foreign direct investment and loan for the less developed countries and/or old colonies.
BIBLIOGRAPHY :
– “Milestones: 1945-1952 – Office of the Historian”. history.state.gov.
Cite This Work
To export a reference to this article please select a referencing stye below:
Related Services
View all


DMCA / Removal Request
If you are the original writer of this essay and no longer wish to have your work published on UKEssays.com then please click the following link to email our support team:
Request essay removal