Population Growth/Change in Poverty Reduction of India
| ✅ Paper Type: Free Essay | ✅ Subject: Economics |
| ✅ Wordcount: 2270 words | ✅ Published: 17 Oct 2017 |
- Satheesha B
Abstract
The population growth can affect poverty by either two channels, changing population size and age structure. This paper analyzes the effect of changing population size on poverty in Indian states. In states Bihar, Madhya Pradesh, Uttar Pradesh and Rajasthan poverty declining at a lower rate because the population growing a higher rate. In states like Kerala, Himachal Pradesh, Karnataka, Punjab and Tamil Nadu population growing at lower rates and poverty is declining at higher rate. The paper also verifying the major criticisms posed against the Head Count ratio (HCR), the common index used to measure poverty. The criticism is that it is built on the intuitions of unchanging population.
Views on Population Growth and Poverty
The multiple paths through which the population-poverty nexus could be working opens the discussion in many possible directions (Eastword and Lipton 2001). Debates surrounding the consequences of population growth on economic development can be trace back to more than 200 years since Malthus produced his famous ‘First Essay on Population in 1798. Malthus’s theory states that there is disparity between the potential growth of population and potential growth of food production. The population would be growing in geometric ratio where as food production would be growing in an arithmetical ratio, which in turn reduces the demand for laborers and real wage.
The age structure aspect of population growth emerged in the 1970s because no cross-national link between population growth and economic growth prior to the mid-1970s. Simon’s (1981) study postulates that population growth has positive effect on economic growth through increased workforce and dominate scale economies in production. Holden and Binswanger (1998) have argued that in several African countries low population density makes it uneconomic to install the infrastructure for agro0rural development, so that population and workforce increase are required to make faster growth of GDP. Recent research has looked at the linkages between population growth and poverty reduction at different stages of the transition from high to lower fertility (Birdsall 2001). When fertility starts to decline the ratio of potential workers to non-workers rises and creates window of opportunity during which high personal savings and investment become possible.
Another set of argument is that poverty reduction is determined by economic policies. Population only one among a number of factors that affects poverty and it is largely caused by bad governance, corruption, misguided agricultural policies and poor food distribution. For several decades global food production has exceeded population growth but still poverty is high (National Research council 1986).
From above discussion we can say that poverty can be affected by either of two demographic transition aspects
- Changing population size
- Age structure
This paper analyses effect of changing population size on poverty in India.
Demographic Transition in India
India is passing through the last phase of fertility transition, moving towards moderate to low fertility. Fertility decline is not uniform across the country and the differential rates are responsible for the differentials in population growth rates across states (Guilmoto and Rajan 2002). Fertility transition is a significant determinant of poverty reduction (Dupta and Dubey 2003).
Figure 1. Fertility Level in India during 1981 to 2010
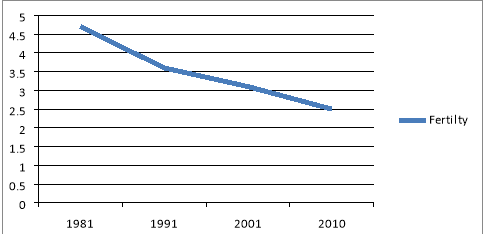
Source: Planning Commission
Recent studies which focused on the “demographic dividend” argue that when countries move to lower levels of fertility, age structure changes in such a way that the proportion of the population in the working ages increases for a period of some decades, thus providing an opportunity to achieve higher economic growth. India is now moving towards low fertility levels India is said to face a brighter future (Gavin 2009).
Role of Population Growth in Poverty Reduction of India
The study of Crook (1996) argues that India’s experience of past 150 years of colonization and independence does not support Malthusian theory. The study supports Marxian argument that poverty is caused by landlessness or unemployment, and not of high fertility. The different rates of population growth that were recorded in different states had little or no responsibility for the different levels of poverty prevailed in different states. Agricultural productivity and the process of landlessness provided better explanation for the existence of high poverty. During the period 1958 to 1991 agricultural growth substantially reduced poverty but industrial growth did not (Datt and Ravallion 1997).
These studies looking at the relation between population growth and poverty up to 1990. Here looking at the relation between poverty and population growth after 1991.
The table 1 shows the head count ratio and decadal population growth of Indian states. The head count ration given for the periods of 1993-94, 2004-05 and 2009-10. The decadal population growth given for the periods of 1991-2001 and 2001-2011, for the purpose of comparison 1991-2001 will consider equivalents to 1991-2001 and 2001-2011 equivalents to 2009-10.
Table 1. Headcount Ratio and Decadal population Growth across Indian States
|
Head Count Ratio |
Population Growth (Decadal) |
||||
|
states |
1993-94 |
2004-05 |
2009-10 |
1991-2001 |
2001-2011 |
|
Andhra Pradesh |
44.6 |
29.6 |
21.1 |
14.59 |
11.1 |
|
Assam |
51.8 |
34.4 |
37.9 |
18.92 |
16.93 |
|
Bihar |
60.5 |
54.4 |
53.5 |
28.62 |
25.07 |
|
Gujarat |
37.8 |
31.6 |
23 |
22.66 |
19.17 |
|
Haryana |
35.9 |
24.1 |
20.1 |
28.43 |
19.9 |
|
Himachal Pradesh |
34.6 |
22.9 |
9.5 |
17.54 |
12.81 |
|
Jammu&Kashmir |
26.3 |
13.1 |
9.4 |
29.43 |
23.71 |
|
Karnataka |
49.5 |
33.3 |
23.6 |
17.51 |
15.67 |
|
Kerala |
31.3 |
19.6 |
12 |
9.43 |
4.86 |
|
Madhya Pradesh |
44.6 |
48.6 |
36.7 |
24.26 |
20.3 |
|
Maharashtra |
47.9 |
38.2 |
24.5 |
22.73 |
15.99 |
|
Orissa |
59.1 |
57.2 |
37 |
16.25 |
13.97 |
|
Punjab |
22.4 |
20.9 |
15.9 |
20.1 |
13.73 |
|
Rajasthan |
38.3 |
34.4 |
24.8 |
28.41 |
21.44 |
|
Tamil Nadu |
44.6 |
29.4 |
17.1 |
11.72 |
15.6 |
|
Uttar Pradesh |
48.4 |
40.9 |
37.7 |
25.85 |
20.09 |
|
West Bengal |
39.4 |
34.2 |
26.7 |
17.77 |
13.93 |
|
All India |
45.3 |
37.2 |
29.8 |
21.54 |
17.64 |
Source: Planning Commission
At all India level HCR declined from 45.3 percent in 1993-94 to 37.2 percent in 2004-05 and further declined to 29.8 percent in 2009-10. In all states poverty shows a declining trend. In states like Himachal Pradesh, Karnataka, Kerala, Punjab, Tamil Nadu and West Bengal poverty reducing at higher rate because the population growth is low. Where as in states like Bihar, Madhya Pradesh, Uttar Pradesh, Rajasthan the poverty declining at a lower rate because the population growing at higher rate.
Figure 2. Fertility Rates and Headcount Ratio across India States in 2010

Source: SRS Report 2012 & Planning Commission
The figure 2 shows the relationship between fertility levels and incidence of poverty across Indian states in 2010. Though it shows the relationship at one point in time, the states which have high fertility levels also have high incidence of poverty and incidence of poverty is lower in states which has lower level of fertility such as Kerala, Punjab, Tamil Nadu, and Jammu & Kashmir.
The difference in incidence of poverty visible in human development achievement also. At all India level the HDI has increased by 20 per cent between 2001 and 2008.
Table. 2 Human Development Index Values of States
|
States |
1991 |
2001 |
2008 |
|
Andhra |
0.377 |
0.368 |
0.473 |
|
Assam |
0.348 |
0.386 |
0.444 |
|
Bihar |
0.308 |
0.292 |
0.367 |
|
Gujarat |
0.431 |
0.466 |
0.527 |
|
Haryana |
0.443 |
0.501 |
0.552 |
|
Himachal |
– |
0.581 |
0.652 |
|
Jammu |
– |
0.465 |
0.529 |
|
Karnataka |
0.412 |
0.432 |
0.519 |
|
Kerala |
0.591 |
0.677 |
0.79 |
|
Madhya |
0.328 |
0.385 |
0.375 |
|
Maharashtra |
0.452 |
0.501 |
0.572 |
|
Orissa |
0.345 |
0.275 |
0.362 |
|
Punjab |
0.475 |
0.543 |
0.605 |
|
Rajasthan |
0.347 |
0.387 |
0.434 |
|
Tamil |
0.466 |
0.48 |
0.57 |
|
Uttar |
0.314 |
0.316 |
0.38 |
|
West |
0.404 |
0.422 |
0.492 |
|
All India |
0.381 |
0.387 |
0.467 |
Source: National Human Development Report 2001 & 2011
It is evident from the table that the states which experienced lower population growth achieved higher poverty reduction such as Kerala, Himachal Pradesh, Punjab, Tamil Nadu etc. The states like Bihar, Uttar Pradesh, Rajasthan and Madhya Pradesh experienced very high growth in population and achieved very low reduction in poverty.
Fraction or Count Matters
The major poverty indexes like HCR, Sen’s index, SST (Sen-Shorrocks-Thon) index do not satisfy ‘no mere addition axiom’. No mere addition axiom states that merely adding non-poor to a population should not decrease poverty (Hassoun 2010). Standard measures of poverty built on the intuitions of unchanging population (Kanbur 2006).
The most commonly used measurement of poverty is Head Count Ratio (HCR) measures the number of poor as a percentage of the total population.
HCR = np/n
Where ‘np’ is the number of poor and ‘n’ is total population size.
From 1987 to 1998, the number of people in the world surviving on less than two dollars a day increased from 2.5 billion to 2.8 billion but the percentage of people below the poverty line, fell from 61.0 percent to 56.1 percent (Chakravarthy et al., 2002).
Table 3. HCR and Head Count (number of poor) across Indian States
|
1993-94 |
2004-05 |
2009-10 |
||||
|
States |
HC |
HR |
HC |
HR |
HC |
HR |
|
Andhra Pradesh |
359.43 |
44.6 |
235.1 |
29.6 |
176.6 |
21.1 |
|
Assam |
139.38 |
51.8 |
97.7 |
34.4 |
116.4 |
37.9 |
|
Bihar |
353.68 |
60.5 |
493.8 |
54.4 |
543.5 |
53.5 |
|
Gujarat |
262.87 |
37.8 |
171.4 |
31.6 |
136.2 |
23 |
|
Haryana |
78.13 |
35.9 |
54.6 |
24.1 |
50 |
20.1 |
|
Himachal Pradesh |
21.36 |
34.6 |
14.6 |
22.9 |
6.4 |
9.5 |
|
Jammu&Kashmir |
40.23 |
26.3 |
14.5 |
13.1 |
11.5 |
9.4 |
|
Karnataka |
124.09 |
49.5 |
186.5 |
33.3 |
142.3 |
23.6 |
|
Kerala |
67.31 |
31.3 |
62 |
19.6 |
39.6 |
12 |
|
Madhya Pradesh |
252.04 |
44.6 |
315.7 |
48.6 |
261.8 |
36.7 |
|
Maharashtra |
286.51 |
47.9 |
392.4 |
38.2 |
270.8 |
24.5 |
|
Orissa |
125.01 |
59.1 |
221.6 |
57.2 |
153.2 |
37 |
|
Punjab |
102.19 |
22.4 |
53.6 |
20.9 |
43.5 |
15.9 |
|
Rajasthan |
209.09 |
38.3 |
209.8 |
34.4 |
167 |
24.8 |
|
Tamil Nadu |
180.58 |
44.6 |
194.1 |
29.4 |
121.8 |
17.1 |
|
Uttar Pradesh |
659.95 |
48.4 |
730.7 |
40.9 |
737.9 |
37.7 |
|
West Bengal |
353.36 |
39.4 |
288.3 |
34.2 |
240.3 |
26.7 |
|
All India |
4034.65 |
45.3 |
4072.2 |
37.2 |
3546.8 |
29.8 |
Source: Planning Commission
In states of Bihar, Karnataka, Madhya Pradesh, Maharashtra, Orissa, Rajasthan, Tamil Nadu and UP absolute number of poor increasing but incidence of poverty falling during the period 1993-94 to 2004-05. In all India level also we can see the same pattern, HC increasing from 40.34 crores to 40.72 crores but HCR fell from 45.3 percent to 37.2 percent. The main argument is that poverty declines because non-poor growing faster than the poor in total population (Kanbur 2006).
Table 4 provides compound annual growth rate of poor and non-poor during the period 1993-94 to 2005-05 for states which experienced increase in absolute number of poor.
Table 4. CAGR of Poor and Non-poor (1993-94 to 2004-05)
|
States |
CAGR of poor |
CAGR of non-poor |
|
Bihar |
3.08 |
-2.45 |
|
Karnataka |
3.77 |
0.65 |
|
Madhya Pradesh |
2.07 |
-2.68 |
|
Maharashtra |
2.90 |
1.46 |
|
Orissa |
5.34 |
-1.94 |
|
Rajasthan |
0.03 |
4.01 |
|
Tamil Nadu |
0.66 |
1.48 |
|
Uttar Pradesh |
0.93 |
2.33 |
|
All India |
0.08 |
3.18 |
Source: Planning Commission
In Rajasthan, Tamil Nadu and Uttar Pradesh and at national level non-poor is growing faster than the poor. In all India level number of poor growing at 0.08 percent per annum and non-poor growing at 3.18 percent per annum. So among these states and at national level the hypothesis holds. But the hypothesis does not hold for Bihar, Karnataka, MP and Maharashtra.
During the period of 2004-05 to 2009-10 incidence of poverty and number of poor falling in all states except Assam. Kanbur (2006) argues that poverty declined because poverty has killed the poor. This phenomenon will arise whenever mortality is higher among the poor than among the rich, which is of course a very commonly observed phenomenon.
Normalized Index
HCR and HC cannot combine together. By normalizing these values and converted to a same scale (0 to 1) following which they are averaged to get a final normalized value.
Normalized HCR= Actual – Min/Max – Min
The averaged normalized value is transformed back to get the revised HCR under the assumption of the given range being the same.
The Head Count (HC) and Head Count Ratio (HCR) are not comparable. For example if we take number of poor then Uttar Pradesh has highest poverty whereas according to HCR Bihar has highest poverty. This problem solved by normalizing these values and converted to a comparable scale following which they are averaged to get a final normalized value. The averaged normalized value is transformed back to get the revised HCR under the assumption of the given range being the same.
Except for Maharashtra and Uttar Pradesh revised HCR follows actual HCR. But still revised HCR provides better poverty comparison among states.
Table 5. Normalized Values of HCR and Head Count (HC)
|
2009-10 |
HCR |
HC |
Normalized HCR |
Normalized HC |
Average |
Revised HCR |
|
Andhra Pradesh |
0.211 |
176.6 |
0.263 |
0.232 |
0.248 |
0.204 |
|
Assam |
0.379 |
116.4 |
0.628 |
0.150 |
0.389 |
0.269 |
|
Bihar |
0.535 |
543.5 |
0.967 |
0.732 |
0.850 |
0.481 |
|
Gujarat |
0.23 |
136.2 |
0.304 |
0.177 |
0.241 |
0.201 |
|
Haryana |
0.201 |
50 |
0.241 |
0.060 |
0.151 |
0.159 |
|
Himachal Pradesh |
0.095 |
6.4 |
0.011 |
0.001 |
0.006 |
0.093 |
|
Jammu&Kashmir |
0.094 |
11.5 |
0.009 |
0.007 |
0.008 |
0.094 |
|
Karnataka |
0.236 |
142.3 |
0.317 |
0.186 |
0.252 |
0.206 |
|
Kerala |
0.12 |
39.6 |
0.065 |
0.046 |
0.055 |
0.116 |
|
Madhya Pradesh |
0.367 |
261.8 |
0.602 |
0.349 |
0.475 |
0.309 |
|
Maharashtra |
0.245 |
270.8 |
0.337 |
0.361 |
0.349 |
0.250 |
|
Orissa |
0.37 |
153.2 |
0.609 |
0.201 |
0.405 |
0.276 |
|
Punjab |
0.159 |
43.5 |
0.150 |
0.051 |
0.101 |
0.136 |
|
Rajasthan |
0.248 |
167 |
0.343 |
0.219 |
0.281 |
0.219 |
|
Tamil Nadu |
0.171 |
121.8 |
0.176 |
0.158 |
0.167 |
0.167 |
|
Uttar Pradesh |
0.377 |
737.9 |
0.624 |
0.997 |
0.811 |
0.463 |
|
West Bengal |
0.267 |
240.3 |
0.385 |
0.319 |
0.352 |
0.252 |
Source: Planning Commission
For example comparing to AP and Bihar with respect to HCR incidence of poverty is higher in Assam but number of poor is higher in AP. In revised HCR still poverty is higher in Assam but the difference between Assam and AP in terms of incidence of poverty coming down due to differential in head count.
Conclusion
The analysis shows that population size provides only a partial explanation for poverty reduction. The states which experienced lower population growth achieved higher poverty reduction such as Kerala, Himachal Pradesh, Punjab, Tamil Nadu etc. The states like Bihar, Uttar Pradesh, Rajasthan and Madhya Pradesh experienced very high growth in population and achieved very low reduction in poverty. Age structure also may have significant impact on poverty. In India the share of working age group in total population is 62 percent. Important thing is that there is shift in employment from agriculture to secondary and tertiary sector where wage rate is three times higher than agriculture sector.
Head count ration only measures the incidence of poverty. The analysis shows that incidence of poverty declines when absolute number of poor in population increases. In states like Bihar, Karnataka, Madhya Pradesh, Maharashtra, Orissa, Rajasthan, Tamil Nadu and UP absolute number of poor increasing but incidence of poverty falling during the period 1993-94 to 2004-05. It proves that HCR not good measure of poverty. Indicators like HDI can explain the wellbeing of people better because it takes into account the educational attainment and life expectancy.
References
Birdsall, Nancy, Allen C. Kelleyand Steven W. Sinding. (2001). Population Matters Demographic Change, Economic Growth, and Poverty in the Developing World. New York: Oxford University Press.
Chakravarty, Satya R., Ravi Kanbur and Diganta Mukherjee. (2006). “Population Growth and Poverty Measurement.” Social Choice and Welfare, Vol.26
Crook, Nigel. (1996). “Population and Poverty in Classical Theory: Testing a Structural Model for India.” Population Studies, Vol 50 (2).
Datt, Gaurav and Martin Ravallion, (1992); “Growth and redistribution components of changes in poverty measure: A decomposition with application to Brazil and India in the 1980s”, Journal of Development Economics, Vol.38.
Dupta, N.D. and Amaresh Dubey. (2013). “Poverty and Fertility: An Instrumental Variables Analysis on Indian Micro Data”. Department of Economics Aarhus School of Business Working Paper 03-11.
Eastwood, Robert and Lipton Michel. (2001). “Demographic Transition and Poverty: Effects via Economic Growth, Distribution, and Conversion”. In Population Matters Demographic Change, Economic Growth, and Poverty in the Developing World, ed. Nancy Birdsall, Allen C. Kelleyand Steven W. Sinding, New York: Oxford University Press.
Guilmoto C.Z. and Irudaya Rajan S. 2002. “District Level Estimates of Fertility from India’s 2001 Census”, Economic and Political Weekly, Vol. 37 (7).
Hassoun, Nicole. (2010). “Another Mere Addition Paradox? Some Reflections on Variable Population Poverty Measurement.” UNU-WIDER Working Paper 2010/120.
Holden, S. and H. Binswanger. (1998). “Small-Farmer Decisionmaking, Market Imperfections, and Natural Resource Management in Developing Countries”. In Agriculture and the Environment: Perspectives on sustainable Rural Development, ed. Lutz, P. Hazell, and A. McCalla., World Bank.
Jones W.,Gavin. (2009). “Population and Poverty: The Situation in Asia and the Pacific.” Asia-Pacific Population Journal, Vol. 24 (1).
Kanbur, Ravi. (2006). Three Conundrums in Measuring Poverty with a Changing Population”. UNDP’s International Poverty Centre.
Malthus, T. R. (1798). An Essay on the Principle of Population. United Kingdom:Penguin Books.
National Research Council. (1986). Population Growth and Economic Development: Policy Questions. Washington DC: National Academy Press.
Simon, J. (1986). Theory of Population and Economic Growth. Oxford: Blackwell.
Cite This Work
To export a reference to this article please select a referencing stye below:
Related Services
View all


DMCA / Removal Request
If you are the original writer of this essay and no longer wish to have your work published on UKEssays.com then please click the following link to email our support team:
Request essay removal