Overview of the Production Possibility Curve
| ✅ Paper Type: Free Essay | ✅ Subject: Economics |
| ✅ Wordcount: 1839 words | ✅ Published: 19 Mar 2018 |
Production Possibility Curve
Production possibility curve is the curve that show the combination of two item or services that can be produce in the market in a certain amount of time provided that all other eternal factor that can effect the curve are kept constant such as, labour, technology land and capital. The curve shows the production between two item and how much can we produce with the current resources or technology. As the title says ‘possibility’ which also means that with this much of resources, how much of item can it produce or achieve.
There are 3 types of production possibility curve which are straight-line sloping down, concave and convex curve.
The first type of curve has a constant negative gradient or constant ratio which also means that as one item/good decreases by one, the other item/good will increase by one, and it will always be constant. Which also means that its opportunity cost will be always constant. But this type of curve is not realistic because it cannot represent the market/economy.
The second type of curve is known as concave curve, it has increasing ratio as moving on the curve which also means that we need to decrease more of a item/good to produce more of the good and the decreasing number will keep increase as a sacrifice for another item/good. Which also means that the opportunity cost will keep increasing. Thus this graph is also knows as increasing opportunity curve. This type of curve is more realistic and it represent the whole market or economy.
The last type of curve is known as convex curve, it has decreasing ratio as moving on the curve which is also means that we need to decrease less of a item/good to produce more of a good and the decreasing number will keep decrease as moving along the curve. Which is also means that the opportunity cost will keep decreasing. Thus the graph is also known as decreasing opportunity curve. This type of curve does not really exist in the real life economy, some says that in agriculture, this type of curve does exist but mostly it is not.
Assumptions of the Production Possibility Curve
There are assumption on the production possibility curve because the curve is not a live feed as the market always changes and it also could not show every possible detail of the market so we will have to keep it short and simple while still able to represent the market. There are four assumption of the production possibility curve which are assumption of two goods/items, constant resources, constant technology and efficiency.
The first assumption is that the curve assumed that the market/economy only have two goods/items or that the goods/items will represent the whole market/economy. This way we could define or assume the economy from the curve, because the two goods/items simplify the economy thus we only could interpret the economy because in reality there are too many goods/items to take into account or it is impossible to take everything into one curve. In conclusion this assumption of the two goods simplify the market/economy so that we could monitor the changes and the stands of the market/economy.
The next or second assumption is that the resources that is supply to the economy is constant or fixed. Resources will always change but we cannot use the real amount of resources to construct the production possibility curve, we will need to resources to be constant to construct the production possibility curve. Due to it constant resources at a time, we could use it to compare with another amount of resources at another time, with this we could analyse the increase in resources or decrease in resources.
The third assumption is quite similar to the second one as it assumed the technology is constant. This is an assumption of how well or how much the tools and machineries will produce goods/items given the same amount of resources. It can be seen when a tool or machine produces 10 cake with 10 kg of flour while another tool with a higher or more advanced technology produces 10 cake with 5kg of flour or produces 20 cake with 10 kg of flour. This technological advancement will cause the production possibility curve to change and technology advances everyday thus we need to make it constant. Similar to the assumption of the constant resources, we can use it as comparison as shown is the example, we can use the amount of goods/items produce to compare because is the technology advances, more goods/items will be produce and the other way when the technology degrades.
The last assumption is the efficiency, the production possibility curve assume that all the resources are utilize fully but in reality the resources are never been utilize fully. This can be seen where the some labour have no motivation or heart to work and work at its fullest. This is the hardest factor to control so the possibility of the labour force will be fully utilize is very less. There are times when the machineries are old and did not sent for maintenance which will cause the efficiency of the production to drop which will be another factor to contribute to efficiency cannot be fully achieved. Thus it assumed that the work force is fully utilize and no waste of resources to produce the production possibility curve.
Opportunity Cost

Production Possibility Curve A
Opportunity cost is the cost or expenses needed to be given or sacrifice to gain something, like the production possibility curve A above, we can produce either guns or butter but to increase the production of one type of goods/item we need to decrease the other, for example now we are producing at point A and we want to produce more of butter so we decided to shift our production to B, when our production for butter increases, at the same time we need to decrease the guns production in exchange because of scarcity.
There are 3 type of opportunity cost which are increasing opportunity cost, constant opportunity cost and decreasing opportunity cost.
Production possibility curve A shows increasing opportunity cost which can be seen at between point AB and Point CD, to increase the production of butter by 10, the quantity of guns needed to be reduced by 5 but as going down the curve like point C and D, to increase the production of butter by 10, the production of 50 guns need to be reduced. From that we can say it is increasing opportunity cost because the opportunity cost increase as going down the curve from 5 to 50 to produce the same amount of butter.
Unemployment
Unemployment in terms of business refers to a situation whereby a graduate or a working age adult fails to get a job. There are many types of unemployment, which includes classical, cyclical, structural, frictional, hidden and long-term. This problem would bring about negative impact in the long run to the country’s economic growth.
In terms of economics, unemployment is defined as the wastage of resources in a production. When this occurs the economy would not be able to reach the production possibility curve which is a result of any point that appears INSIDE the curve. This can be further illustrated by the production possibility curve whereby the point which shows unemployment is at Point D which is located INSIDE the curve. At this point the resources are not fully used in the production of goods but would still attainable. Point A, B and C on the other hand achieve full employment in the production of capital goods and consumer goods.In addition to this, point E is an example of the production that is unattainable based on the current advancement of technology and resources.

There are many ways to improve the production possibility curve in order for all the resources to be fully utilized. The government would provide insurance, compensation, and subsidies to aid in restraining of the demand. Besides, the labor market is never 100% efficient, therefore, the minimum wage policy should be reconsidered and the power of unions should be reduced at the same time. This would then improve the economic in the long run.
Economic Growth
Economic growth can be easily defined as the output shift of the production possibility curve due to the rise of the economy over a certain period or an increase in the production due the fully utilization of scare resources. This shift on then production possibility curve shows that the economy has successfully increased its capacity to produce more.
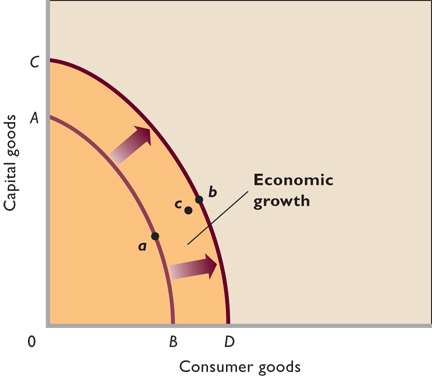
The few factors that contribute to the economic growth is the advancement in technology, the increase in man power, the discovery of new production methods as well as raw materials. When there is an advance in technology, the production of goods or services would be more efficient. For example in countries like China, the rapid economic growth is due to application of new technology to then manufacturing process. An economy would not be able to grow if there is an insufficient amount of resources allocated especially to the capital goods.
Next, the increase of labor force is important to enable a more number of people to contribute physically in the production. A particular country allows specialization between the laborers to enable better quality and a well divided task to improve the productive capacity and to ensure to outward shift on the production possibility curve in the time to come.
Over the years new production methods as well as raw materials are discovered to improve the economic growth of the country. For example the first usage of technology such as computers or other electronic gadgets to control the production methods such as robots has greatly improve the productivity of the economy and many other firms contributing to this economic growth. Alternative types of raw materials were introduced to ensure the continuous supply for the production of the good.
Diffence Between Constant Opportunity Cost and Increasing Opportunity Cost
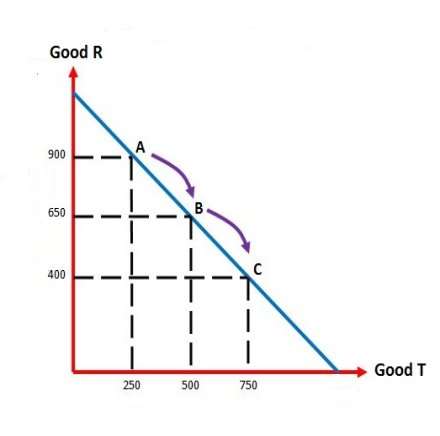
Constant opportunity cost occurs when the production possibility curve is linear. The relationship between opportunity cost and quantity supplied is the same. Assuming that a factory wishes to increase their production of good T from 250 units to 500 units, the factory has to sacrifice 250 units of good R in order to increase the production of good T. Thus, the ratio between opportunity cost and quantity supplied is constant, 1:1.
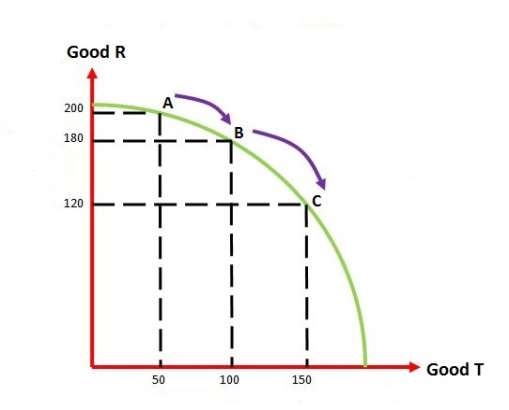
The production possibility curve of increasing opportunity cost is concave from its origin. Increasing opportunity cost means the more units of good T produced, the more the opportunity cost of good R. Assuming that the factory has to forgoes 20 units of good R so that the factory is able to produce 50 more units of good T. If the factory wishes to increase the production of good T from 100 units to 150 units, they have to let go 60 units of good R. In this case, it clearly shows us an increasing opportunity cost.
Reference
2000. Assumption of Production Possibility Curve. 3 February 2015.
Available from :<
http://www.amosweb.com/cgi-bin/awb_nav.pl?s=wpd&c=dsp&k=assumptions,+production+possibilities
2014. Unemployment. Viewed on 7 February 2015.
Available from :<
2000. Unemployment. Viewed on 7 February 2015.
Available from :<
http://www.amosweb.com/cgi-bin/awb_nav.pl?s=wpd&c=dsp&k=unemployment,+production+possibilities
2015. Economic Growth. Viewed on 7 February 2015.
Available from :<
http://www.economicsonline.co.uk/Competitive_markets/Economic_growth.html
Cite This Work
To export a reference to this article please select a referencing stye below:
Related Services
View all


DMCA / Removal Request
If you are the original writer of this essay and no longer wish to have your work published on UKEssays.com then please click the following link to email our support team:
Request essay removal