Macroeconomic Factors of Slovenia and Latvia
| ✅ Paper Type: Free Essay | ✅ Subject: Economics |
| ✅ Wordcount: 1466 words | ✅ Published: 20 Nov 2017 |
Macroeconomic factor are factors that describe the economy as a whole at the regional or national level and it affects the whole population rather than a few selected individuals (Investopedia, 2010).These factors include the Gross domestic product (GDP), Per Capita GDP, Consumer Price Index (CPI), Inflation, Human Development Index (HDI), Interest rate, Export and Import (Foreign Trade), Exchange rate, Unemployment rate (Labour force) etc.
Gross Domestic Product (GDP)
GDP can be defined as the monetary value of all finished goods and services produced within a country’s borders within a specific time (Investopedia, 2003).
Latvia
The Latvian Gross Domestic Product (GDP) was worth 30.96 billion US dollars in 2014. Its GDP represents 0.05 percent of the world economy. It later averaged 13.56 billion USD starting in 1987 till 2013, and reaching 28.8 billion USD in 2008 and recording 4.50 billion USD in 1993(Tradingeconomics.com, 2015).

Slovenia
The Gross Domestic Product (GDP) in Slovenia is 47.99 billion US dollars in 2014. It represents 0.08 percent of the world economy .Also, it has an average of 30.35 USD Billion from 1990 till 2013, reaching as high as 55.59 USD Billion in 2009 and as low as 12.52 USD Billion in 1992(Tradingeconomics.com, 2015).

Per Capita Gross domestic Product
Per Capita Gross Domestic Product measures the total output of a country i.e GDP divided by the population. The Gross Domestic Product per capita in Latvia was recorded at 8863.20 USD(2013)(Tradingeconomics.com). 
Slovenia
The Gross Domestic Product per capita in Slovenia was recorded at 18634.25 US dollars in 2013. It had an average of 15868.33 USD from 1990 until 2013, getting as high as 20987.05 USD in 2008 and a record of 10787.04 USD in 1992. (Tradingeconomics.com)

Consumer Price Index (CPI)
This measures and examines the weighted average of prices of a basket of consumer goods and services, which include food, medical care e.t.c. CPI is calculated by taking price changes for each item in the predetermined basket of goods and finding their average; and also, the goods are weighted according to their importance (Investopedia, 2003).
LATVIA
Consumer Price Index CPI in Latvia increased to 106.90 Index Points in February of 2015 from 106.60 Index Points in January of 2015. It had an average of 72.49 Index Points from 1993 until 2015, reaching108.10 Index Points in June of 2014 and as low as 22.60 Index Points in January of 1993(Tradingeconomics.com, 2015).

Consumer Price Index (CPI) in Slovenia increased to 121.02 Index Points in February 2015 from 120.75 Index Points in January 2015. It has an average of 105.01 Index Points from 2000 until 2015, reaching an index of 123.92 in 2014 (June) and went as low of 73.55 Index Points in the year 2000 (January) (Investopedia.com).

Inflation
It is an increase in prices, as measured by some broad index (such as consumer price index) over months or years, and mirrored in the corresponding decreasing purchasing power of the currency.
The inflation rate in Latvia was -0.10 percent in February of 2015. It had an average of 4.12 percent from 1998 until 2015, reaching as high as 17.70 percent in 2008 (May) and a record of -4.30 percent in 2010(February) (Trading economics.com, 2015). 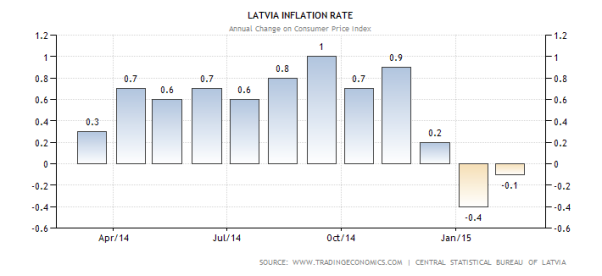
Slovenia
The inflation rate in Slovenia was recorded at -0.40 percent in February of 2015. Inflation Rate in Slovenia had an average of 5.64 percent from 1994 until 2015, reaching as high as 22.60 percent in August of 1994 and a recorded -0.60 percent in 2009 (July) (Tradingeconomics.com, 2015).

Interest rate
This can be described as the amount charged, as a percentage of principal, by a lender to a borrower for the use of assets (Investopedia, 2003).
Latvia and Slovenia
Latvia and Slovenia are both members of the European Union and have adopted the euro. There benchmark interest rates is set by the European Central Bank and they have both adopted the euro.
The benchmark interest rate in the Euro Area was last recorded at 0.05 percent. Interest Rate in the Euro Area had an average of 2.35 percent from 1998 until 2015, reaching as high as 4.75 percent in October of 2000 and a record as low as 0.05 percent in September of 2014(Tradingeconomics.com, 2015).

Export and Import (Foreign Trade)
Export and Import depicts the state of international trade by showing how much goods produced in one country are shipped to another country for future sale or trade. The sale of such goods adds to the nation’s gross output. If used for trade, exports are exchanged for other products or services .Import is described as the number of goods or services brought into one country from another countryr. Along with exports, imports form the backbone of international trade. The higher the value of imports entering a country, compared to the value of exports, the more negative that country’s balance of trade becomes (Investopedia, 2003).
LATVIA
Latvia recorded a trade deficit of 128.50 EUR Million in January of 2015. It had an average of -161.05 EUR Million from 1993 until 2015, and also reaching as high as 40.10 EUR Million in February of 1993 and as low as -557.10 EUR Million in July of 2007(Tradingeconomics.com, 2015).

Slovenia recorded had trade surplus of 29.98 EUR Million in January of 2015 and an average of -84.84 EUR Million from 1992 until 2015, and recorded as high as 153.40 EUR Million in September of 2014 and as low as -325 EUR Million in August of 2008(Tradingeconomics.com, 2015).

Unemployment
Unemployment can be said as a situation whereby a person who is actively searching for employment but is unable to find work.. The most frequently cited measure of unemployment is the unemployment rate. This is the number of unemployed persons divided by the number of people in the labor force (Investopedia, 2010)
Latvia’s unemployment rate reduced to 10.60 percent in the third quarter (2014) from 10.70 percent in the second quarter (2014) and had 11.84 percent from 2002 to 2014, reaching as high as 20.70 percent in the first quarter (2010) and a record of 5.40 percent in the fourth quarter (2007) (Tradingeconomics.com, 2015).
Slovenia’s unemployment rate increased to 13 percent in 2014 (December) from 12.50 percent in 2014(November). The Unemployment Rate had an average of 11.76 percent from 1991 until 2014, reaching as high as 15.50 percent in October of 1993 and a recorded 6.30 percent in September of 2008(Tradingeconomics.com, 2015).
Conclusion-
Having taken a broad look at the Macro economic factors of both economies, Latvia had a lower GDP and Per Capita GDP than Slovenia. Slovenia on the other hand had a higher Consumer Price index which amounts to a higher cost of goods and services. Latvia had a higher inflation and lower unemployment of -10.60% while Slovenia’s had a higher rate in export and unemployment. Given all these factors, I will say Slovenia has a better Macroeconomic environment compared to Latvia. In the long run, if more Foreign Direct Investment comes into play in the Slovenian economy, there will be a better performance compared to its present state. Thus its unemployment rate will be reduced.
Reference
BusinessDictionary.com,. (2015). What is a labor force? definition and meaning. Retrieved 15 March 2015, from http://www.businessdictionary.com/definition/labor-force.html
Countrymeters.info,. (2015). Slovenia population 2015 | Current population of Slovenia. Retrieved 15 March 2015, from http://countrymeters.info/en/Slovenia
Economicsonline.co.uk,. (2015). National income. Retrieved 15 March 2015, from http://www.economicsonline.co.uk/Managing_the_economy/National_income.html
Economywatch.com,. (2015). Latvia Trade, Latvia Exports, Latvia Imports | Economy Watch. Retrieved 15 March 2015, from http://www.economywatch.com/world_economy/latvia/export-import.html
Economywatch.com,. (2015). Slovenia GDP (Current Prices, National Currency) data, GDP (Current Prices, National Currency) Slovenia. Retrieved 15 March 2015, from http://www.economywatch.com/economic-statistics/Slovenia/GDP_Current_Prices_National_Currency/
Economywatch.com,. (2015). Slovenia Import and Export | Economy Watch. Retrieved 15 March 2015, from http://www.economywatch.com/world_economy/slovenia/export-import.html
Investopedia,. (2003). Export Definition | Investopedia. Retrieved 15 March 2015, from http://www.investopedia.com/terms/e/export.asp
Investopedia,. (2003). Gross Domestic Product (GDP) Definition | Investopedia. Retrieved 15 March 2015, from http://www.investopedia.com/terms/g/gdp.asp
Investopedia,. (2003). Import Definition | Investopedia. Retrieved 15 March 2015, from http://www.investopedia.com/terms/i/import.asp
Investopedia,. (2003). Import Definition | Investopedia. Retrieved 15 March 2015, from http://www.investopedia.com/terms/i/import.asp
Investopedia,. (2003). Inflation Definition | Investopedia. Retrieved 15 March 2015, from http://www.investopedia.com/terms/i/inflation.asp
Investopedia,. (2010). Macroeconomic Factor Definition | Investopedia. Retrieved 15 March 2015, from http://www.investopedia.com/terms/m/macroeconomic-factor.asp
Investopedia,. (2010). Unemployment Definition | Investopedia. Retrieved 15 March 2015, from http://www.investopedia.com/terms/u/unemployment.asp
Liaa.gov.lv,. (2015). Foreign Trade Statistics | LIAA. Retrieved 22 March 2015, from http://www.liaa.gov.lv/trade/foreign-trade-statistics
Staff, I. (2013). Gross National Income (GNI) Definition | Investopedia. Investopedia. Retrieved 15 March 2015, from http://www.investopedia.com/terms/g/gross-national-income-gni.asp
The Economic Times,. (2015). Human Development Index Definition | Human Development Index Meaning – The Economic Times. Retrieved 15 March 2015, from http://economictimes.indiatimes.com/definition/human-development-index
Tradingeconomics.com,. (2015). Latvia GDP | 1987-2015 | Data | Chart | Calendar | Forecast | News. Retrieved 15 March 2015, from http://www.tradingeconomics.com/latvia/gdp
Tradingeconomics.com,. (2015). Latvia Inflation Rate | 1998-2015 | Data | Chart | Calendar | Forecast. Retrieved 15 March 2015, from http://www.tradingeconomics.com/latvia/inflation-cpi
Tradingeconomics.com,. (2015). Latvia Unemployment Rate | 2002-2015 | Data | Chart | Calendar | Forecast. Retrieved 15 March 2015, from http://www.tradingeconomics.com/latvia/unemployment-rate
Tradingeconomics.com,. (2015). Slovenia Inflation Rate | 1994-2015 | Data | Chart | Calendar | Forecast. Retrieved 15 March 2015, from http://www.tradingeconomics.com/slovenia/inflation-cpi
Tradingeconomics.com,. (2015). Slovenia Unemployment Rate | 1991-2015 | Data | Chart | Calendar | Forecast. Retrieved 15 March 2015, from http://www.tradingeconomics.com/slovenia/unemployment-rate
Cite This Work
To export a reference to this article please select a referencing stye below:
Related Services
View all


DMCA / Removal Request
If you are the original writer of this essay and no longer wish to have your work published on UKEssays.com then please click the following link to email our support team:
Request essay removal