Inflation Targeting in UK and Australia
| ✅ Paper Type: Free Essay | ✅ Subject: Economics |
| ✅ Wordcount: 2884 words | ✅ Published: 11 Oct 2017 |
Many Central Banks have adopted inflation targeting in response to failed monetary policies not as a way of new economic thinking. Inflation targeting was dubbed “constrained discretion” as it combines both rules and discretion for the Central Bank taking part. The elements of an inflation targeting regime are as follows:
- Price stability is explicitly recognised as the main goal of Monetary Policy.
- There is a public announcement of a quantitative target for inflation.
- Monetary policy is based on a wide set of information, including an inflation forecast.
- Transparency.
- Accountability mechanisms
Most of the countries that have moved to inflation targeting have done so as part of political and economic reform to strengthen the institutional structure of policymaking.
Chart 1 below illustrates the 27 countries currently operating an inflation targeting regime, the date they started the process and the inflation rate at the beginning of the process.
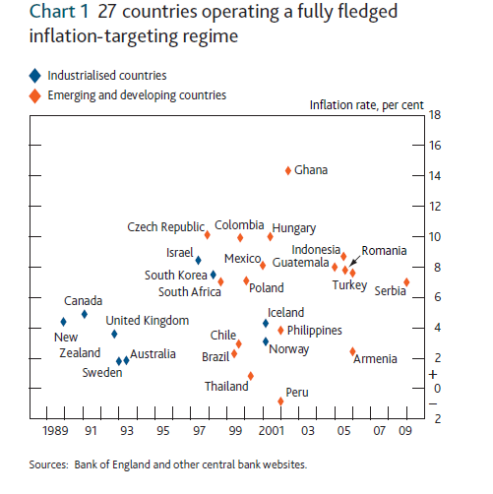
As illustrated above many countries including the United Kingdom and Australia embarked on Inflation Targeting when their inflation rates were low, UK 4% and Australia 2%. This highlights the studies that suggest the Inflation Targeting may not be the best way to help inflation decrease but it is an effective way of anchoring inflation levels around a target and keeping inflation at a low and stable rate.
Key for inflation targeting is operational independence for the Central Bank involved, all of the 27 countries above have this and 15 of them jointly determine the inflation target with the government. The involvement of the government in setting the target many believe helps with public support towards the target and the Inflation Targeting regime overall. In nine countries central bank sets the target, and in three countries, Norway, South Africa and the United Kingdom, the target is set by the government (Chart 2).

The United Kingdom embarked on inflation targeting in October 1992, as illustrated in Chart one it was the third country to do so. The reason it introduced Inflation targeting was because of its forced exit from The Exchange Rate Mechanism, it therefore needed a more predicable monetary policy – it needed more certainty about future inflationary rates and their effect on future prices. It also needed to demonstrate a creditable monetary policy.
Chart three illustrates inflation rates and monetary regimes since the 1940s in the United Kingdom. It is evident from this chart that the use of monetary targeting in 1970s and 1980s resulted in very high and volatile inflation levels, in excess of 20% at times.
Some blame high oil prices for the high inflation rates of 1970s however, oil cannot be blamed in isolation as inflation averaged 7.5% between 1970 – 1972 before escalating oil prices hit. By 1975 inflation hit 26%, 6 times its average of 4% over the previous 20 years. It fell back slightly, but by 1980 it was hitting 20%. These inflationary pressures drove up average wages and also prices in the economy which in turn resulted in substantial loss of employment.
Chart 3 UK inflation and monetary regimes

In contrast to this the recent Global Financial Crisis seen the UKs Monetary Policy Committee have the flexibility to deal with the sudden shocks to the United Kingdom’s economy but being mindful of the well-established low and stable inflationary rates and target. This period, since 2008, seen the devaluation of sterling to levels similar to levels during World War II, increases in commodity prices, indirect taxes and government regulated prices and has still managed to maintain an average inflation rate of 3.2%.
That said, the inflation target is 2% and the UK has seen inflation above this target for the last 3 years, mostly above 3% with a peak of 5.2% in September 2011. The expectation in 2013 was that it will remain above the target rate of 2% until at least the end of 2014.
In 1998 the Bank of England set out the objectives for the Monetary Policy Committee as
“To maintain price stability, defined as a target for annual consumer price inflation of 2%, and, subject to that, to support the government’s objectives for growth and employment.”
In March 2013, after 39 consecutive months of the inflation target of 2% being exceeded, the Chancellor of the United Kingdom announced a new mandate in which he acknowledges the damage that can be done to output if inflation is allowed to run out of control but also notes the effect over strict adherence to inflationary targets can negatively affect short term output. To this end the new mandate clarifies that the Monetary Policy Committee has the discretion to allow temporary deviation from the inflation target in order to provide a more stable output for the economy, known as flexible inflation targeting.
Flexible inflation targeting in the United Kingdom has always been a consideration, as far back as 1997 Meryvn King was quoted as saying that anyone who thought a country could focus only on Inflation Targeting to the detriment of everything else were “Inflation Nutters” (M King “Changes in UK Monetary Policy: Rules and Discretion in Practice,” Journal of Monetary Economics 39: 81-97).
Every year the Chancellor of the United Kingdom submits a remit of the Bank’s Monetary Policy Committee in a letter to the Governor. This remit has never confirmed an exact time frame as to how long it should take for inflation to be returned back to the target rate of 2%. The remit defines price stability as a target for annual consumer price inflation of 2% “at all times”, which leaves it open to interpretation. However two years was always used as the timeline, up until 2013, as it takes approximately two years for the effect of interest rate changes to work through the economy. Under the new mandate with flexible inflation targeting, the anchor is still 2% however, the Monetary Policy Committee can decide to take longer than the two years for their measures to take affect and bring inflation back to 2% if they believe in the longer term it would help anchor Inflation at 2% for longer and would be beneficial to the United Kingdom’s economy over all.
This is the reason in February 2013 they chose to maintain a large amount of stimulus already in place even though it meant forecasts were predicting inflation would be over the 2% target well into 2015. They “judged that removing it to bring inflation back to the target within two years would both risk derailing the recovery as well as risking undershooting the target further out”, (Inflation targeting and flexibility, Ian McCafferty, External Member of the Monetary Policy Committee, Bank of England, The Wall Street Journal at Eight Members Club, London 14 June 2013).
In his letter to the Governor on March 2013, the Chancellor outlined these changes and explained the change in remit, but also reconfirmed the anchor for inflation at 2% remained the same.
“I confirm that the Committee’s interpretation of the flexibilities provided by the remit is correct, and that these flexibilities are conditional on the Committee’s judgement that the risks to meeting the 2 per cent inflation target in the medium term remain balanced. The Committee should remain vigilant to those risks to ensure that medium-term inflation expectations remain anchored. This represents an appropriately balanced approach to the Committee’s objectives, while retaining the primacy of medium-term price stability and the inflation target” Remit for Monetary Policy Committee, G Osbourne, 20 March 2013).
As outlined previously since the Global Financial Crisis the United Kingdom’s economy have experienced a number of supply and cost shocks which has tested Inflation Targeting. The increase in VAT, indirect taxes, from 17.5% to 20% in 2011 added 1% to inflation in 2011 but this fell to 0% the following year – showing that it had a temporary effect on inflation.
The depreciation in sterling of 25% from 2007 to 2009 resulted in an increase in import prices and added approximately 2.5% – 4% to inflation in 2010, Chart 4.
Chart 4 UK Import Prices and Sterling Deprecation

There was a substantial increase in inflation in 2008 , 2010 and 2011 because of the global increase in energy prices and the resultant increase in petrol and domestic utility bills, illustrates in Chart 5 below.
Chart 5 Direct contribution Energy Prices to Inflation

The Monetary Policy Committee in the UK believe in accommodating price shocks like above only if the impact doesn’t unhinge inflation forecasts and therefore lead to secondary impact changes as seen in 1970s & 1980s with hugely inflated prices and wages leading to unemployment. In recent years no such inflationary impact has been seen, which may demonstrate that inflation targeting is working in the United Kingdom. The Monetary Committee have made a commitment in the 2013 remit to continue to communicate their decisions, as they have always done, to the public but to also help them, the pubic, understand why they are making these decisions, i.e. Flexible Inflation Targeting, and emphasising all the time that their anchor rate remains at 2%.
So is Inflation targeting working for the United Kingdom, and has the change in remit in 2013 with the introduction of Flexible Inflation Targeting helped? Let the numbers speak for themselves – the inflation rate as measured by the Consumer Prices Index (CPI) fell to 1.6% in March 2012 from 1.7% in February. It is the third consecutive month inflation has been below the Bank of England’s 2% target rate, following four years above it – Chart 6 draw your own conclusion.
Chart 6 UK Inflation Rate 2010 – 2014

Australia introduced Inflation Targeting in early 1993, as illustrated in Chart 1 they were the fifth country to do so. Similar to the United Kingdom, Australia experienced extremely high inflation in the 1970s and already had an inflation rate of 10% before escalating oil prices hit in 1973, this attributed to the Australian inflation rate of over 17%, seen in Chart 7. Following the recession of the early 1980s and during the Monetary Targeting era inflation fell to 5% but rose again quickly in 1985/6 on the back of the large depreciation of the Australian dollar; it fell by almost 40% in 18 months. This depreciation in the Australian dollar could have been more inflationary and indeed led to second round impact on wages and prices as seen in the United Kingdom had it not been for the Prices and Incomes Accord in place at the time.
Chart 7 Australian Historical Inflation
The Prices and Incomes Accord was an agreement between the Australian Council of Trade Unions and the Australian Labor Party government in 1983 whereby the government promised to minimise inflation and unions agreed to restrict wage demands. This was seen as a method to reduce inflation without reducing the living standards of Australians. Its first economic goal was to limit nominal wages increases in an effort to combat the endemic problem of that era, stagflation; (high unemployment and high inflation). The first Accord negotiated a pay rise for workers in September 1983 and April 1984 of just over 4%, and a deferred 2.6% pay rise over the initial 3-year period, improvements in family payments and child care, and the introduction of Medicare. Unemployment as a result fell from over 10% (in the 2nd quarter of 1983) to just under 8%. The Accord was successful in that it did help limit wage increases and therefore keep unemployment at bay and it also helped contain inflation at a lower level than would probably have accompanied the strong growth seen in the Australian economy in the middle to late 1980s. It was seen as so successful that By February 1985, it was clear that the monetary target would be substantially exceeded, and the target was ‘suspended’.
That said the average inflation of 1980s was 8% and in the 10 years before embarking on inflation targeting in 1993 the average rate of inflation was 6% with relatively low inflation in 1991 & 1992. In the past various Monetary Policies had failed. The decade of Monetary Targeting had seen targets hard to hit during the regulated era and also after financial liberalisation. Australia had seen two decades in all of high inflation so when the Inflation rate came down in 1991 & 1992 the Reserve Bank started to look at how to lock in this low inflation rate as economic growth recovered.
In March 1993 Bernie Fraser, the Governor of the Reserve Bank, gave a speech to a group of Sydney economists announcing;
“The appropriate degree of price stability to aim for is a matter of judgment. My own view is that if inflation could be held to an average of 2-3 per cent over a period of years , that would be a good outcome” (Address by Mr G.R. Stevens, Assistant Governor(Economic), to the Economic Society of Australia, Sydney, 20 April 1999).
This was the start of inflation targeting by Australia, The Reserve Bank of Australia suttley set a medium term target of 2%-3% and were very much aware of the short term effects on the economy of pushing the inflation target in the short term, hence the medium term, flexible target of 2% – 3% ‘on average, over the course of the cycle’ used in describing the target. However Inflation targeting was not formally endorsed until 1996 when the new government signed an agreement with the new Governor. The “Statement on the Conduct of Monetary Policy “ stipulated the Reserve Bank’s goals in the Reserve Bank Act, and endorsed the inflation target as the practical interpretation of the medium-term goal of price stability.
The joint announcement of the Inflation Target from the Government and Central Bank help demonstrate that there will not be inconsistency between the setting of monetary and fiscal policy.
The Statement on the Conduct of Monetary Policy requires the Governor and other senior Central Bank members to appear twice yearly before parliament to explain their actions on monetary policy, this allows the public to question whether their actions remain consistent with the inflation target.
The new regime was tested very early on with a number of shocks; The crisis in Asia, which resulted in a decrease in exports by approximately 20%, along with the devaluation of the Australian dollar both in the mid-1990s. The 10% goods and services tax introduced in 2000 all contributing factors that tested the new regime however due to the fact the Reserve Bank of Australia had adopted a flexible practice in the inflation targeting framework it was able to respond by altering and monetary policy, chart 8, to respond to these shocks and keep inflation within target over the medium term.
Chart 8

Overall as seen in chart 9 the first decade of Inflation targeting in Australia had seen an average inflation rate of 2.3%, with a few cyclical swings during the period with the lowest inflation rate being 1.3% in March 1998 and the highest 3.2% in late 2001. Overall, inflation stayed within target and importantly didn’t effect economic growth negatively, GDP during the same 10 year period averaged at approx. 3.9%.
However the biggest stress test for Inflation Targeting had yet to come, how did Australia’s Inflation Targeting regime preform during the Global Financial Crisis?
Chart 9 Average Inflation Australia

Between 2005 and September 2008, underlying inflation rose by more than 2% from around 2.5% to just above 4.5%. The Australian cash rate fell from 7% in 2008 in response to the Global Economic Crisis; the Reserve Bank of Australia cut interest rates by 4% between September 2008 and February 2009 in response to the slowdown of their economy – an effect of the Global Financial Crisis. In late 2008, underlying inflation steadily declined to be around 2.25% in 2011.
RBA cut interest rates again in 2012 in response a worsening outlook to the global economy and signs of their own weakening labour market to help maintain their Inflation target.
Chart 10

Last year, 2013, Australia’s inflation rate moderated to around 2.2% – 2.5%, and has been broadly stable since, reflecting ongoing strength in the Australian dollar, broad-based competitive pressures within the domestic economy and subdued growth in costs. The cash rate currently stands at 2.50%, the lowest on record. However, this is expected to edge higher this year as growth is expected to strengthen helped by the low interest rates and inflation is expected to stay within target of 2%-3%. The Reserve Bank of Australia (RBA) expects that inflation will stay at or below this until at least mid-2015, with wage growth forecast to remain contained.
Chart 11 Australia’s Inflation Rate 1998 – 2014

Australia started Inflation Targeting with a flexible regime and focusing on the medium term, since inception there have been times when it’s been both above and below the target range of 2% – 3%. However the framework allowed the Reserve Bank of Australia to respond at these events and as a whole over the medium term inflation has been anchored at the target range which has helped promote its economic stability.
In his speech in June 2011 Philip Lowe, Assistant Governor, summed up the importance of the Inflation Target to the Reserve Bank of Australia and the Australian economy by saying;
“Over the past 20years, low inflation has been a key ingredient to Australia’s economic success and maintaining that record will help us meet the challenges that lie ahead.”
References
- Inflation targeting and flexibility ,Speech given by Ian McCafferty, External Member of the Monetary Policy Committee, Bank of England
- Hosted by The Wall Street Journal at Eight Members Club, London
- Friday 14 June 2013
- http://www.bankofengland.co.uk/monetarypolicy/Pages/remit.aspx
- https://www.bondvigilantes.com/blog/2013/03/26/uk-inflation-the-bank-of-england
- http://www.bbc.com/news Economy tracker: Inflation 15 April 2014
- Address by Mr G.R. Stevens, Assistant Governor(Economic), to the Economic Society of Australia,Sydney, 20 April 1999.
- Inflation Targeting: A Decade of Australian Experience Glenn Stevens Deputy Governor Address to South Australian Centre for Economic Studies April 2003 Economic Briefing Adelaide – 10 April 2003
- http://www.rba.gov.au/speeches/2009/sp-ag-150509.html
- http://www.rba.gov.au/speeches/2011/sp-ag-240611.html
- http://www.rba.gov.au/publications/smp/2014/feb/pdf/0214.pdf
- Inflation: The Recent Past and the Future,Philip Lowe* Assistant Governor (Economic) Keynote Address to BankSA ‘Trends’ Business Luncheon Adelaide – 24 June 2011
- Tradingeconomics.com
Cite This Work
To export a reference to this article please select a referencing stye below:
Related Services
View all


DMCA / Removal Request
If you are the original writer of this essay and no longer wish to have your work published on UKEssays.com then please click the following link to email our support team:
Request essay removal