Industry Analysis: Soft Drinks
| ✅ Paper Type: Free Essay | ✅ Subject: Economics |
| ✅ Wordcount: 1563 words | ✅ Published: 12 Mar 2018 |
Submitted by:-
- Prof. K G SahadevanRishi Singh
- Tuhin Kanti Mondal
- Sunita Seetharam
Contents
Market characteristics and major players
Market characteristics and major players
Table of Figures
Figure 1………………………………………………………………………………………..2
Figure 2………………………………………………………………………………………..2
Figure 3………………………………………………………………………………………..4
Figure 4………………………………………………………………………………………..4
Figure 5………………………………………………………………………………………..5
Figure 6………………………………………………………………………………………..5
Figure 7………………………………………………………………………………………..6
Figure 8………………………………………………………………………………………..6
Figure 9………………………………………………………………………………………..7
Figure 10..……………………………………………………………………………..……….8
Figure 11..……………………………………………………………………………………10
Figure 12..……………………………………………………………………………………10
Executive Summary
The soft drinks industry includes carbonated as well as the non-carbonated drinks. The industry leaders are Coca-Cola and Pepsi. This industry is unique in the sense that the product is bought primarily for the brand image of the company rather that the utility of the product. The purpose of a carbonated drink can well be served by a glass of water or lemonade. The companies strive to capture market share through extensive advertising and branding. The carbonated drinks were perceived as a health concern so the companies introduced non carbonated drinks like juices.
The firms in this industry exercise tight control over the suppliers and compete on price to get customers. The industry is very competitive and makes it very difficult for a small player to exist. The bigger firms have an advantage due to economies of scale.
Introduction

 Soft drink industry has been a successful growth for a long time. In recent years, the sales of basic soft drinks have been depreciated highly due to increment of health awareness, change in consumer behaviour towards other varieties of soft drinks etc. But all over the changes have been directed net positive increment in sales due affinity of consumers towards juice and bottled drinking and mineral water. The big players of original soft drinks like Coke, Pepsico etc. are acquiring or diversifying their products toward juice and mineral water industry. They are doing product extension as well (ex. Diet Pepsi, Coke Zero etc.) to remain competitive in the market.
The definition of classic soft drink can be expressed as follows:


 Sometimes soft drink may contain alcohol but the within the limit of 0.5%.
The carbonated water is made in two ways. It is either using soda siphon or by home carbonation system. The latter one is made by putting dry ice on water. In modern industry, carbondioxide is used instead of dry ice. The carbondioxide is pressured and mixed with water with high pressure.
The type of soft drinks decide the addition of colour and customised flavours which distinggishes one from another.
The soft drinks can be categories in the following way:

Figure 3 Classification of Soft Drinks
Market Analysis

 The market volume of soft drink industry in India in 2013 was 11,755 liters, showing a growth of 170% compared to 4369 liters in 2008. As far as predicted growth rate is concerned, market is showing around 19% growth annually. For product wise analysis, it shows that 20% annual growth rate for next year five in bottled water while the carbonated drink shows. The same figure for juice is 21%. Interestingly, the annual growth rate of carbonated drink is only 10%. This increment will come from mostly due to penetration in rural market while there is considerable decrement in sales in urban area.

 But if we put the percentage growth, then juice shows more than 100% growth.

Market characteristics and major players
The soft drink industry market can be analysed using three economic factors. These are market size, growth rate and overall profitability. As compared to hard drink, soft drink contains a share of around 48% in no-alcoholic industry. But the as discussed earlier, the market of carbonated soft drink is shrinking due to the awareness of people for their health.

Figure 6 Change in consumer behaviour toward non-alcoholic drinks
The above graph is an example that how the consumer’s mindset has been changed from taste to health. It is to observe that sport drinks and bottled water have seen around 40% of growth whereas packet juice along with carbonated soft drink have faced a sharp decline even upto 20%. For example, if the sales of the largest leader is considered then a tentative area-wise sales’ trend is as follows:

Figure 7 year-wise change in sales of Coke in different areas
From the chart it is evident the increment in sales in year 2010 and 2011 were a world-wide event. But in a growing world like Europe and North America, the sales of Coke is decreasing for last two years. In other side, Pacific and Latin America are showing positive % change of sales over previous year. This discrepancy between growing world and grown world is mostly due to difference in level of education, crave of foreign money by growing world, socio-political difference. Evidently, the soft drink companies are depending mostly on third world market for increment of sales of their original products.
Market characteristics and major players


 The driver for most downstream operations in the soft drink industry is the syrup production. Thus, the CSD industry is largely dependent on the syrup producer. The product life cycle for soft drinks moves as follows:


Figure 8 Soft Drinks Industry Supply Chain
Market analysis
The top three brands in the soft drink industry had a 35 percent share of the market in 2011, According to the latest report from IBIS World. This industry is fiercely competitive. Small companies must conduct soft drink market research competitor analysis to know their current positions in the marketplace. These types of data help small organizations know which strategies are best for their products. Soft drink producers or distributors are not just competing with other soft drink manufacturers. They also must consider competitors in the functional soft drink sector, which includes sports drinks and health-oriented drinks.

Figure 9 Soft Drinks industry market share
Despite being the world’s two weakest performing regions in 2008, Western Europe and North America continue to hold the maximum revenue for soft drinks industry in the world. Together, they account for over half the total sales of the industry. This shows one of the major strategic problems faced by soft drinks companies globally – while second and third tier markets are showing a steeper growth curve in terms of revenue, their total market share remains small relative to developed markets.

Figure 10 Soft Drinks by region
Critically, the industry needs to continue investments in high-yield regions of the developed nations and at the same time strengthen their foothold in the emerging market economies. This poses a huge challenge at the time of adverse macroeconomic conditions.
Consumer Behaviour
Global consumption of soft drinks is said to be rising by around 7% a year, much faster than the growth rate of many other industries. Consumer behaviour for soft drinks is largely volatile and there is very little brand loyalty to be found among consumers.
But despite the choices given, a section of consumers tend to stick to one particular choice of CSD. The reason for this has less to do with taste, and more to do with subtle and careful marketing on the part of soft drink makers. The choice of a soda is as much about who you are as what you want to drink. Soda makers calibrate every aspect of their marketing- from their packaging, to their slogans, to the music that plays over their commercials- to create an identity around their products.
Porter’s Five Forces


Figure 11 Performance of Coke and Pepsi
USD $ in millions
The above chart shows the quarterly performance of the two biggest companies in this industry. It is evident from this chart that the revenue of Coca-Cola is much lesser than Pepsi, however the former has higher net income. The scale of the revenue generated by these companies gives a glimpse of the huge market. However a new entrant would find it very difficult to enter the market due to the high market share captured by these two companies.
The large difference between the revenues and the net income shows the magnitude of the costs involved.
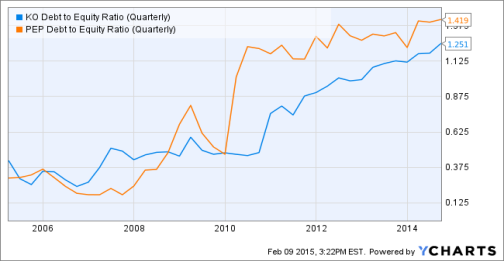
Figure 12 Financial Analysis
The increasing debt to equity ratio indicates that the biggest players are changing their funding profiles. This would be very difficult for a new firm to replicate.
Conclusion
From the above analysis, we found that the there was a huge change in the trend of sales of product in Soft Drink industry. We have seen that there were huge sales of traditional soft drinks earlier. But eventually the sales decreased due to rise in consciousness of people about health and increment in number of people suffering from different diseases and obesity which was partially caused by those drink. Big manufacturing companies are doing product extension in energy drink, juice etc or doing product diversification like Chips, snacks etc.
The industry has strong entry barriers and the suppliers do not hold much control. The buyers however are very price sensitive and are brand loyal till other factors like taste, content etc. remain constant.
References
Seth, P. (02.10.2008.). slideshare. In Soft Drink Industry. Retrieved Feb 10, 2015, from http://www.slideshare.net/sethaphat/soft-drink-industry-presentation.
Anonymous. (n.d.). sbtdc. In How to conduct an Industry Analysis. Retrieved Feb 10, 2015, from http://www.sbtdc.org/pdf/industry_analysis.pdf.
Anonymous. (n.d.). changeabsolutions. In A Guide To Soft Drink Industry. Retrieved Feb 10, 2015, from http://changelabsolutions.org/sites/default/files/ChangeLab-Beverage_Industry_Report-FINAL_%28CLS-20120530%29_201109.pdf.
Karimi, S. (n.d.). ehow. In How To Write An Industry Analysis. Retrieved Feb 10, 2015, from http://www.ehow.com/how_4811458_write-industry-analysis.html.
Abraham, S. (n.d.). writing.uscb. In How To Do An Industry And Competitive Analysis. Retrieved Feb 10, 2015, from http://www.writing.ucsb.edu/faculty/holms/109EC__industry.pdf.
1 | Page
Cite This Work
To export a reference to this article please select a referencing stye below:
Related Services
View all


DMCA / Removal Request
If you are the original writer of this essay and no longer wish to have your work published on UKEssays.com then please click the following link to email our support team:
Request essay removal