India’s Electricity Market Analysis
| ✅ Paper Type: Free Essay | ✅ Subject: Economics |
| ✅ Wordcount: 2778 words | ✅ Published: 24 Nov 2017 |
CHAPTER 1
INTRODUCTION
- INTRODUCTION TO DEREGULATED ELECTRICITY MARKETS
In the last few decades, electricity markets world-wide are being transformed from highly regulated Government controlled markets into deregulated and competitive markets. The traditional vertically integrated electric utility structure of yester-years has been replaced by a deregulated and competitive market scheme in many countries worldwide (Li et al., 2007). The main objective of electricity market restructuring and deregulation has been to introduce competition in the power industry especially in the way electricity and ancillary services are traded, thereby, providing more options for power market participants to choose from (Amjady and Daraeepour, 2009). With the deregulation and increased competition, today, participants of power markets are facing new challenges. Electricity trading is no more a technical business and it has transformed in to one in which, the product is treated similar to any other commodity (Pilipovic, 1997).
Electricity is a very unique commodity which cannot be economically stored and the end-user demand exhibits strong seasonality. Events such as non-availability of resources (e.g., non-availability of coal for thermal power stations), power plant outages, imperfect transmission grid reliability or breakdown of electrical transformers may have extreme effects on electricity spot prices. In the framework of competitive electricity markets, power market participants (both power producers and consumers) need accurate price forecasts. Forecasting spot prices with lead times of few hours to a few days is of prime importance. A power market participant with accurate short-term price forecasts can adjust his own production schedule by buying/selling power from power exchange depending on when it is more profitable, ensuring power requirements are met and thereby maximizing his profits. This makes spot electricity price forecasting extremely critical for all power market participants.
Electricity price forecasts embody crucial information for producers and consumers when they plan bidding strategies to maximize their benefits and utilities. Spot electricity prices are far more volatile than any other commodity and are known for their extreme price volatility (Weron, 2006; Karakatsani and Bunn, 2004; Weron and Misiorek, 2005; Girish et. al. 2014; ). In a power market, for both spot markets and long-term contracts, price forecasts are necessary input so that power market participants can develop effective bidding strategies or negotiation skills to maximize their own profit. An Independent power producer (IPP) or a Generator, if it is able to forecast spot prices correctly, then, it can adjust its own production schedule accordingly and thereby maximize its profits. Since day-ahead spot market typically consists of 24 hourly auctions that take place simultaneously one day in advance, forecasting with lead times of few hours to a few days is of prime importance in day-to-day market operations.
- INDIAN ELECTRICITY MARKET AND POWER INDUSTRY STRUCTURE
The Indian electricity market is broadly divided into five regions namely Northern region, North-Eastern region, Southern region, Eastern region and Western region. (See Figure 1)
Figure 1: Indian Electricity Market
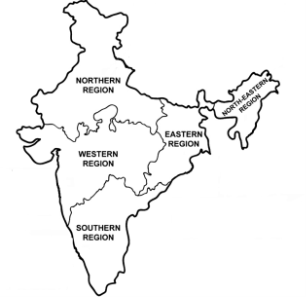
The figure shows the different regions of Indian Electricity Market namely Northern region, North-Eastern region, Southern region, Eastern region and Western region
Source: Central Electricity Regulatory Commission; Girish et al. (2013); Girish et al. (2014)
The Ministry of Power (MoP) of the Indian Government oversees policy formulation, planning and has been entrusted with the responsibility of effective implementation and administration of The Indian Electricity Act (IEA) 2003 which introduced competition and has completely reorganized the power sector. In India, Power/Electricity is the responsibility of both Central Government and the State Governments who are the stakeholders. Central Electricity Authority (CEA) has been entrusted with statutory functions including overseeing the technical coordination and supervising implementation of various programs and schemes of the Government. Central Electricity Regulatory Commission (CERC) is the independent regulator for power sector in India along with State Electricity Regulatory Commissions (SERCs) for each of the state. National Load Despatch Centre (NLDC) which was constituted in 2005 is the apex body in India for ensuring integrated operation of the national power system. NLDC is entrusted with supervising the functioning of other Regional Load Despatch Centres (RLDCs). NLDC and RLDCs together overlook scheduling, dispatch of power/electricity both intra as well as inter-regional links, maintaining grid security and proper monitoring of system operations. Transmission in India is entrusted with Central transmission utilities, State transmission utilities and transmission licensees. Power sector companies should get license and prior approval from the Central Electricity Regulatory Commission for commencing operations. The Indian Electricity Act (IEA) 2003 has paved way for trading of electrical power and is now a separate and completely distinct activity (with licensing from CERC). Post the enactment of IEA 2003, private players and licensees have started their operations in Ahmedabad, Mumbai, Kolkata, Surat, Delhi and other major cities in India for Generation of electric power, Distribution of electricity and proper Operations in system. Electricity sector in India has been opened 100% Foreign Direct Investment (FDI) in Generation, Distribution and power trading. Appellate tribunal is responsible for hearing appeals against any of the orders of adjudicating officer or any Commission under the Indian Electricity Act 2003. The structure of Indian power sector is as shown in Table 1.
Table 1: Structure of Indian Power Industry
|
Centre |
State/Private |
|||
|
Policy |
Ministry of Power |
State Government |
||
|
Plan |
Central Electricity Authority (CEA) |
|||
|
Regulations |
Central Electricity Regulatory Commission (CERC) and Central Government Appointed Committee (CAC) |
State Electricity Regulatory Commission (SERC) and State Government Appointed Committee (SAC) |
||
|
Generation |
Central Generating Stations (CGS) and Mega Power Projects |
Generation Companies (Gencos) and Independent Power Producers (IPP) |
Private Licensees in Ahmedabad, Kolkata, Delhi, Mumbai, Noida and Surat |
|
|
System Operations |
National Load Dispatch Centre (NLDC) and Regional Load Dispatch Centre (RLDC) |
State Load Dispatch Centre (SLDC) |
||
|
Transmission |
Central Transmission Utilities (CTU) and Transmission licensees |
State Transmission Utilities (STU) and Transmission licensees |
||
|
Distribution |
Distribution Licensees |
|||
|
Trading |
Power Exchanges (i.e. Indian Energy Exchange (IEX) and Power Exchange India Limited (PXIL)) and Trading Licensees |
Trading Licensees |
||
|
Appeal |
Appellate Tribunal |
Source: Girish et al. (2013); Girish et al. (2014)
Table 2 gives details about total electricity generated in India as on 30th June 2014. Table 3 highlights region-wise power Supply position (Demand and availability) met for the month of June 2014 in India.
Table 2: Total Electricity Generation in India (as on 30th June 2014)
|
Region |
Thermal |
Nuclear |
Hydro (Renewable) |
RES (MNRE) |
Total |
||
|
Coal |
Gas |
Diesel |
|||||
|
Northern |
36793.5 |
5331.26 |
12.99 |
1620 |
16529.44 |
5935.77 |
66222.96 |
|
Western |
59114.51 |
10915.41 |
17.48 |
1840 |
7447.5 |
11271.07 |
90605.97 |
|
Southern |
26582.5 |
4962.78 |
939.32 |
1320 |
11398.03 |
13784.67 |
58987.3 |
|
Eastern |
25927.88 |
190 |
17.2 |
0 |
4113.12 |
432.86 |
30681.06 |
|
North Eastern |
60 |
1208.5 |
142.74 |
0 |
1242 |
256.67 |
2909.91 |
|
Islands |
0 |
0 |
70.02 |
0 |
0 |
11.1 |
81.12 |
|
All India |
148478 |
22608 |
1199.75 |
4780 |
40730.1 |
31692.1 |
249488 |
Note: All values are in megawatts (MW)
Source: Central Electricity Authority
Table 3: Power Supply position (Demand and availability) met for June 2014
|
Region |
Demand |
Availability |
Deficit (%) |
|
Northern |
30540 |
28922 |
-5.3 |
|
Western |
26647 |
26325 |
-1.2 |
|
Southern |
23521 |
22255 |
-5.4 |
|
Eastern |
9880 |
9770 |
-1.1 |
|
North-Eastern |
1177 |
1075 |
-8.7 |
|
All India |
91765 |
88347 |
-3.7 |
Note: All values are in Million Units (MU)
Source: Central Electricity Authority
- POWER EXCHANGES IN INDIA
India currently has two power exchanges namely The Indian Energy Exchange (IEX) and The Power Exchange India Limited (PXIL). The Indian Energy Exchange has been India’s first and leading energy exchange[1] with approximately 97% market share based on Electricity volumes traded for the financial year 2012-13. IEX began its operation in June 2008 after seeking approval and clearance from the Central Electricity Regulatory Commission (CERC). The activities of IEX and PXIL are regulated under the provisions made in Power Market Regulations 2010 which was issued by the Central Electricity Regulatory Commission. The power exchanges are transparent in their operation, nationwide covering all the five regions, neutral, demutualized and are completely automated offering online electricity/power trading platform for the power market participants.
IEX and PXIL enable efficient price discovery and electricity price risk management for power market participants which is also applicable for those industries which find themselves eligible for open access through an anonymous platform. IEX and PXIL were established with the objective of developing a marketplace for power/electricity trading in India offering transparent and efficient platform for power trading and most importantly – bridging the ever growing demand and supply gap for electricity in India. Table 4 gives details about the Volume of Short Term Transactions of Electricity in India in comparison with the Total Electricity Generation in India. We observe an increasing trend in the volume of electricity procured through short-term transactions.
Table 3: Transactions of Electricity in India
|
Year |
Total Electricity Generation in India (Billion Units) |
Total Volume of Short Term Transactions of Electricity (BU) |
Total volume of Short-term Transactions of Electricity as % of Total Electricity Generation |
|
2009-10 |
764.03 |
65.9 |
9% |
|
2010-11 |
809.45 |
81.56 |
10% |
|
2011-12 |
874.17 |
94.51 |
11% |
|
2012-13 |
907.49 |
98.94 |
11% |
Source: Central Electricity Regulatory Commission
Figure 2 highlights the share of different segments in Total Electricity Generated in India for the year 2012-13. Approximately 89% of the total electricity generated in India for the year 2012-13 was transacted through Long Term Power Purchasing Agreements (PPA’s). Volume of total electricity transacted by bilateral agreement between distribution companies accounted for 2% and Unscheduled Interchange transactions accounted for 3%. For the year 2012-13, bilateral transactions through traders accounted for 4% and transactions through Power exchanges accounted for approximately 3%.
Figure 2: Share of different segments in Total Electricity Generated for the year 2012-13

The figure shows the Share of different segments in the Total Electricity Generated in India for the year 2012-13
Source: Central Electricity Regulatory Commission
Over the years, IEX has emerged as a preferred trading platform nationwide covering approximately 2600 participants belonging to 27 different states, 5 Union Territories of India, 500 plus Private producers/Independent producers and over 2300 Open Access consumers. offered by IEX offers Products and Services under The Day-Ahead Market (DAM), Contingency Hourly Market for Next day having Continuous Trading and Intra-day continuous Trading which fall under Spot markets, Term-Ahead Market (TAM) and The Renewable Energy Certificates (RECs) comprising of both Solar REC and Non-Solar REC.
- SPOT ELECTRICITY MARKET
In power exchanges around the world, one of the important product and service in wholesale competitive deregulated electricity market is that of day-ahead spot market. The spot electricity markets operate all 24 hours, 365 days of a year. A day-ahead spot electricity market consists of 24 hourly auctions which simultaneously take place one day in advance (Weron, 2006; Girish et al., 2013; Girish et al., 2014). In such a market, short-term spot price forecasting having lead times of less than a few couple of hours to a few days is of extreme importance. Market clearing spot electricity price in a power exchange having two-sided auction is given by the “intersection of total demand curve and the total supply curve, for a given particular hour, for each region of the electricity market” {Weron, 2006; Girish et al., 2014}. Figure 3 depicts how Market Clearing Price (MCP) is arrived at, in a power exchange, having two-sided auction.
Figure 3: Spot Electricity Price in Power Exchange having two-sided auction

The figure shows how Market Clearing Price (MCP) is arrived at, in a power exchange, having two-sided auction.
Source: Weron (2006); Girish et al. (2014)
- MOTIVATIONS FOR THE RESEARCH
In the framework of competitive electricity markets, power market participants (both power producers and consumers) need accurate price forecasts. Forecasting spot prices with lead times of few hours to a few days is of prime importance. A power market participant with accurate short-term price forecasts can adjust his own production schedule by buying/selling power from power exchange depending on when it is more profitable, ensuring power requirements are met and thereby maximizing his profits.
Electricity price forecasts embody crucial information for producers and consumers when they plan bidding strategies to maximize their benefits and utilities. Spot electricity prices are more volatile than any other commodity and are known for extreme price volatility (Weron, 2006; Karakatsani and Bunn, 2004; Weron and Misiorek, 2005). In a power market, for both spot markets and long-term contracts, price forecasts are necessary input so that power market participants can develop effective bidding strategies or negotiation skills to maximize their own profit. An Independent power producer (IPP) or a Generator, if it is able to forecast spot prices correctly, then, it can adjust its own production schedule accordingly and thereby maximize its profits. Since day-ahead spot market typically consists of 24 hourly auctions that take place simultaneously one day in advance, forecasting with lead times of few hours to a few days is of prime importance in day-to-day market operations. Table 4 gives the timeline of establishment of Organized Day-Ahead Markets.
Table 4: Timeline of Establishment of Organized Day-Ahead Markets
|
Country |
Year |
Company |
|
U.S. |
1998 |
California Power Exchange (CalPX) |
|
U.S. |
1999 |
New York ISO (NYISO) |
|
U.S. |
2000 |
Pennsylvania-New Jersey-Maryland (PJM) Interconnection |
|
U.S. |
2003 |
ISO New England |
|
U.S. |
2005 |
Midwest ISO (MISO) |
|
U.K. |
2001 |
UK Power Exchange (UKPX) |
|
U.K. |
2001 |
Automated Power Exchange (APX UK) |
|
Canada |
2001 |
Alberta Watt Exchange |
|
Canada |
1996 |
Power Pool of Alberta |
|
Australia |
1998 |
National Electricity Market (NEM) |
|
New Zealand |
1996 |
New Zealand Electricity Market (NZEM) |
|
Germany |
2000 |
Leipzig Power Exchange (LPX) |
|
Germany |
2000 |
European Energy Exchange (EEX) |
|
Spain |
1998 |
Operadora del Mercado Espanol de Electricidad (OMEL) |
|
Finland |
1998 |
Nord Pool |
|
Denmark |
2000 |
Nord Pool |
|
Poland |
2000 |
Towarowa Giełda Energii (Polish Power Exchange, PolPX) |
|
Netherlands |
1999 |
Amsterdam Power Exchange (APX) |
|
Slovenia |
2001 |
Borzen |
|
Poland |
2002 |
Platforma Obrotu Energia¸ Elektryczna¸ (POEE) |
|
Italy |
2004 |
Italian Power Exchange (IPEX) |
|
Czech Rep. |
2004 |
Operator Trhu s Elektrinou (OTE) |
|
France |
2002 |
Powernext |
|
Austria |
2002 |
Energy Exchange Austria (EXAA) |
|
Belgium |
2006 |
Belgian Power Exchange (Belpex ) |
|
India |
2008 |
Indian Energy Exchange (IEX) |
|
India |
2008 |
Power Exchange of India Ltd (PXIL) |
Source: Weron, 2006; Girish et al., 2013; Girish et al., 2014
Table 5: Number of Open Access Consumers Month-wise in Indian Energy Exchange for the year 2012-13
|
Month |
Number of Open Access Consumers |
|
April |
1408 |
|
May |
1460 |
|
June |
1507 |
|
July |
1547 |
|
August |
1591 |
|
September |
1645 |
|
October |
1752 |
|
November |
1831 |
|
December |
1925 |
|
January |
2012 |
|
February |
2111 |
|
March |
2227 |
Source: Central Electricity Regulatory Commission
Table 5 shows the increase in number of open access consumers comprising both buyers and sellers of power in IEX for the year 2012-13 month-wise. Table 6 gives details about price of electricity transacted through power exchanges and trading licensees which have been expressed in Rs/kWh. Over the years we find that the price of Electricity transacted through Power Exchanges has reduced barring 2012-13 where it seems to have flattened out. The fact that Price of electricity transacted through Power exchange is lesser than average price of electricity transacted through trading licensees (in the last three years) further indicating the future prospects of power trading through exchanges especially for Open Access consumers and Independent Power Producers. To the best of our knowledge, till date, no study has been done to forecast short term electricity prices for organized Indian Electricity market i.e. for Indian Energy Exchange (IEX) or Power Exchange India Ltd (PXIL).
Table 6: Prices of Electricity traded through Licensed Power Traders and Power Exchanges
|
Year |
Price of Electricity transacted through Trading Licensees (Rs/kWh) |
Price of Electricity transacted through Power Exchanges (Rs/kWh) |
|
2008-09 |
7.29 |
7.49 |
|
2009-10 |
5.26 |
4.96 |
|
2010-11 |
4.79 |
3.47 |
|
2011-12 |
4.18 |
3.57 |
|
2012-13 |
4.33 |
3.67 |
Source: Central Electricity Regulatory Commission
For participating in day-ahead spot electricity market of a power exchange, predicting spot electricity price is critical. With practical relevance and stakes for implications of price forecasting being high for Open Access Consumers, be it a Power market participant like Generator, Independent Power Producer (IPP) or a power trading firm, i.e. next-day electricity price forecasts is a crucial input variable for developing strategies for power producers, open access consumers and energy service utilities; accurate price forecasts are immensely valued by power-market participants. The fact that India is the only country in the world having power exchanges in-spite of demand outstripping supply and peak power shortage even to this day, further emphasizes the significance and criticality of spot electricity price forecasting from a power market participant’s perspective. This is one of the biggest motivations for our research.
- ORGANIZATION OF THESIS
The deregulation and liberalization of electricity markets around the world have not only led to new challenges for market participants and regulators, but, has also created a new field of research. Liberalization coupled with deregulation and introduction of competition in power markets have propelled research in spot electricity price modeling and forecasting which is still at its nascent stage. Our study is the first study, as per our knowledge, which will make use of hourly Indian spot electricity price data for modeling and forecasting, further opening this new field of research wider. The fact that India is the only country in the world having power exchanges in-spite of demand outstripping supply and peak power shortage even to this day, further emphasizes the significance and criticality of our work. The rest of the thesis is structured as follows: In Chapter 2 we review the literature related to Short-term Electricity Price Modeling and Forecasting using Time series models and Volatility models. In Chapter 3 we discuss the Research Objectives and the Hypothesis formulation for our study. In Chapter 4 we discuss the Research Methodology and Data used for our study. In Chapter 5 we describe the data using descriptive and summary statistics and investigate the Impact of establishment of Power Exchanges on electricity prices and Stylized facts of Spot Electricity Price Series. In Chapter 6 we present our Empirical findings and discuss our results related to Forecasting short-term spot electricity prices using Univariate Time series Autoregressive models and Volatility models. In Chapter 7 we conclude our study emphasizing on the implications of our study, contributions made and limitations of our study and end the chapter with scope for future research in this area.
[1] Source: Market Monitoring Report of Central Electricity Regulatory Commission
Cite This Work
To export a reference to this article please select a referencing stye below:
Related Services
View all


DMCA / Removal Request
If you are the original writer of this essay and no longer wish to have your work published on UKEssays.com then please click the following link to email our support team:
Request essay removal