EU Development Differences: Western and Eastern Europe
| ✅ Paper Type: Free Essay | ✅ Subject: Economics |
| ✅ Wordcount: 2405 words | ✅ Published: 19 Oct 2017 |
In the EU there are some differences in development between western countries and those of Central and Eastern Europe, that joined the EU starting with 2004. The EU cohesion policy aims to minimize these differences by providing significant financial assistance to the underdeveloped areas. The present paper analyzes the general development level of these countries in the context of the EU accession. The evolutions are observed both at the states and regions level and reveal a growing GDP in these countries after the EU intergation – which caused a reduction in the existing disparities in the EU.
The eastward expansion of the EU has brought about growing development gaps within the EU. To reduce these gaps and prevent their increase, a regional development policy has been created. Essentially, this policy is based on special funds meant for poorer regions, which find, in this way, the premises to thrive. The absorption of these funds occurs in NUTS 2 regions, and in this context the regionalization has gained increasing importance in the EU. It is considered that, due to its large extent, the state can not conduct effective development policies. This is the reason why certain powers of the central government were transferred to the regions. To standardize the regional statistics and to effectively apply the regional policies of the EU, Eurostat created the Nomenclature of the Statistical Territorial Units (NUTS). A state (NUTS 0) consists of one or more macro-regions (NUTS 1), each macroregion being composed of one or more NUTS 2 regions. Similarly, there are NUTS 3 units as well. Even if the EU countries present a tendency towards regionalization, there are states where regions are non-administrative units (being made of a juxtaposition of smaller administrative units), which restricts their participation at decision-making process. The purpose of this paper is to see if the financial assistance contributed to the increase of the development level and if the regional disparities have decreased after the EU accession.
Disparities in the E.U. and the Cohesion Policy
Regarding the funds, ERDF and ESF are meant for all European regions, but the amount allocated depends on the level of GDP per capita in these regions. According to this level, the regions are divided into less developed regions, transition regions and more developed regions. Helping the less developed regions (with GDP<75% of the EU-27 average) is one of the objectives of the cohesion policy, therefore they were supposed to receive a higher amount of these funds, to ensure the decrease of disparities. The transition regions have a GDP between 75% and 90% of the EU-27 average, replacing the system existing before 2013 of a progressive elimination and introduction of the financial assistance. There is also financial assistance for more developed regions (with GDP>90% of the EU-27 average), given in order to help them face the challenges of global competition, economy based on knowledge, pollution etc. The cohesion funds are for the countries that have a gross national income per capita below 90% of the EU-27 average, for investments in trans-European transport networks and in environment field.
For the next years, the reformed cohesion policy will make available up to 351,8 billion Euro to invest in Europe’s regions, cities and the real economy, in order to achieve the Europe 2020 goals: creating growth and jobs, tackling climate change and energy dependence, and reducing poverty and social exclusion[1]. Among the priorities of the European Regional Development Fund is the support for small and medium-sized enterprises, aiming at doubling support from 70 to 140 billion Euro during 2014-2020.
As with the previous period (2007-2013), the period between 2014-2020 has also received a considerable amount allocated to the less developed regions, but the most significant allocations are directed mainly to the countries of Central and Eastern Europe that joined the EU beginning with 2004 (except for Cyprus and Malta). Poland has by far the highest amount, but there are substantial allocations to other countries, too, older EU states (Italy, Portugal and Greece), which have underdeveloped regions.
Of the total financial resources which the cohesion policy is based on, over 50% are directed to less developed regions, 15% to more developed regions, 10% to transition regions and 18% are for the Cohesion Fund.
The evolution of the development level in the E.U. countries of Central and Eastern Europe
One of the most important development indicators is the Gross Domestic Product (GDP), which measures the output of a country or region. It reflects the total value of goods and products, without the value of goods and services used for intermediary consumption of their production.
The evolution of GDP per capita, both in the EU and in Central and Eastern Europe has been upward, except 2009. The countries which joined the EU after 2004 have a GDP per capita lower than the EU average. The highest value is registered in Cyprus, followed by Slovenia, Malta, the Czech Republic and Slovakia. Other Eastern and Central European countries have values ​​of GDP per capita smaller than half the EU average. The lowest values ​​are recorded in Romania and Bulgaria (about ¼ of the EU average) (Fig. 1).
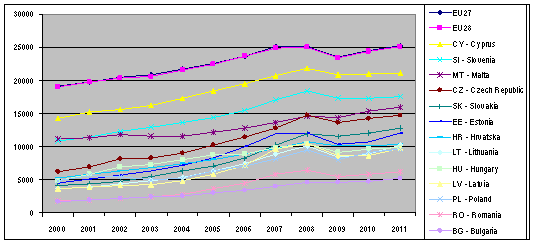
Fig. 1. The GDP (Euro/inhabitant) evolution in the Central and Eastern Europe countries
Source: elaborated using Eurostat data (http://appsso.eurostat.ec.europa.eu/nui/submitViewTableAction.do)
To better highlight the trends in the context of the EU accession and the influence of the integration process on the overall development, we calculated the GDP values relative to the EU average. They were calculated choosing symmetric periods of two years pre- and post-accession[2]. We note that GDP/inhabitant relative to the EU average greatly intensified in the Czech Republic, Hungary, Estonia, Slovakia and Lithuania (Table 1). These facts show that per total the EU integration has had beneficial effects on development, favoring the increase of GDP per capita relative to the EU average.
Taking into account the EU average, from the moment before accession with two years to the one after accession with two years, we can see that the values ​​kept increasing (the increases moving from 11.98%-77.27% to 18.33%-81.78%). Considering the EU average, in the period under discussion, most countries registered rising values​​, except Malta (Table 1). In subsequent years the GDP per capita in these countries has got nearer to the EU average, Cyprus reaching 83.73 in 2011. Only in the case of Romania, the average remains around 25%, but the lowest value, compared to the EU average, was in 2011 the one corresponding to Bulgaria – 20.63%.
Table 1. Evolution of GDP (Euro/inhabitant) relative to the EU average in the Central and Eastern Europe countries
|
No. |
Country |
– 2001 |
% of the EU-27 average – 2005 |
% of the EU-27 average – 2011 |
|
1 |
CY – Cyprus |
77.27 |
81.78 |
83.73 |
|
2 |
SI – Slovenia |
58.08 |
64.00 |
69.84 |
|
3 |
MT – Malta |
57.58 |
54.22 |
63.49 |
|
4 |
CZ – Czech Republic |
35.35 |
45.33 |
58.73 |
|
5 |
HU – Hungary |
29.29 |
39.11 |
39.29 |
|
6 |
EE – Estonia |
25.76 |
36.89 |
48.02 |
|
7 |
SK – Slovakia |
22.22 |
31.56 |
50.79 |
|
8 |
PL – Poland |
28.28 |
28.44 |
38.10 |
|
9 |
LT – Lithuania |
19.70 |
28.00 |
40.48 |
|
10 |
LV – Latvia |
19.70 |
25.78 |
38.89 |
|
% of the EU-27 average – 2004 |
% of the EU-27 average – 2008 |
% of the EU-27 average – 2011 |
||
|
11 |
RO – Romania |
12.90 |
25.90 |
24.60 |
|
12 |
BG – Bulgaria |
11.98 |
18.33 |
20.63 |
|
13 |
HR – Croatia |
* |
41.27 |
* Croatia joined EU in 2013, so, at the time there is no data available for 2014 in order to calculate the post-accession indicators.
Source: elaborated using Eurostat data (http://appsso.eurostat.ec.europa.eu/nui/submitViewTableAction.do)
NUTS 2 regions differ both in area and population, as well as in the general prices level. Hence the fact that sometimes the comparability of GDP data expressed in Euro/capita is affected. For this reason, it is often used the GDP expressed in purchasing power per capita instead of the classic indicator expressed in Euro/capita. GDP in purchasing power is used even within the EU regional policy for determining the eligibility of NUTS 2 regions in the allocation process of Structural Funds.
Expressing GDP in purchasing power standard (PPS) excludes differences in price levels between countries. Thus, using GDP in PPS per capita, it becomes possible to compare the economies of the significantly different regions. In order to calculate, the total value of goods and services produced in an economy is divided by the number of inhabitants; the quantification of GDP in PPS per capita occurs in conventional currency that eliminates the influence of interstate differences that exist in prices.
Given that prices are not identical in the EU, it imposes an observation of GDP expressed in PPS. Compared to the previous chart, these data are slightly smoothed. Besides the existence of a positive trend, both at EU level and in Eastern and Central Europe, we notice a closeness to the EU average, which means a reduction of disparities. Cyprus and Malta have values ​​close to the EU average, followed by Slovenia, the Czech Republic and Slovakia. Romania and Bulgaria hold the last positions, but it is noted that, if at the beginning of 2000, the GDP expressed in PPS was less than one third of the EU average, in 2011 it has grown to be about 50% (Fig. 2).

Fig. 2. Evolution of regional GDP (PPS/inhabitant) in the Central and Eastern Europe countries
Source: elaborated using Eurostat data (http://appsso.eurostat.ec.europa.eu/nui/submitViewTableAction.do)
The evolution of the GDP expressed in PPS in the context of EU accession is positive: in most Central and Eastern European states there is an increase in GDP along with the EU integration. Considering the EU average, the countries that have experienced notable increases during accession, getting closer by over 10% to the average, are Estonia, Latvia, Lithuania and Romania. This shows that there has been some progress in reducing disparities between the East and the West within the EU (Table 2).
Table 2. Evolution of GDP (PPS/inhabitant) relative to the EU average in the Central and Eastern Europe countries
|
No. |
Countries |
% of the EU-27 average – 2001 |
% of the EU-27 average – 2005 |
% of the EU-27 average – 2011 |
|
1 |
CY – Cyprus |
89.90 |
92.44 |
93.65 |
|
2 |
SI – Slovenia |
79.80 |
87.11 |
84.13 |
|
3 |
MT – Malta |
81.31 |
80.00 |
85.32 |
|
4 |
CZ – Czech Republic |
72.73 |
79.11 |
80.56 |
|
5 |
HU – Hungary |
58.08 |
63.11 |
67.06 |
|
6 |
EE – Estonia |
46.46 |
61.33 |
69.05 |
|
7 |
SK – Slovakia |
52.02 |
60.00 |
75.00 |
|
8 |
LT – Lithuania |
41.92 |
54.67 |
67.06 |
|
9 |
PL – Poland |
47.47 |
51.11 |
65.08 |
|
10 |
LV – Latvia |
38.38 |
49.33 |
59.52 |
|
% of the EU-27 average – 2004 |
% of the EU-27 average – 2008 |
% of the EU-27 average – 2011 |
||
|
11 |
BG – Bulgaria |
34.56 |
43.60 |
46.43 |
|
12 |
RO – Romania |
34.10 |
46.80 |
48.41 |
|
13 |
HR – Croatia |
* |
60.71 |
* Croatia joined EU in 2013, so, at the time there is no data available for 2014 in order to calculate the post-accession indicators.
Source: elaborated using Eurostat data (http://appsso.eurostat.ec.europa.eu/nui/submitViewTableAction.do)
In subsequent years the gaps have decreased, so that the analyzed countries have recorded GDP ​​in PPS values which are getting closer to the EU average. Considering the EU average, substantial increases are to be noted in Slovakia, Latvia, Lithuania and Poland. The only countries whose GDP in PPS remains low (below 50% of the EU average) are Romania and Bulgaria.
The evolution of the development level in the regions of the E.U. countries from Central and Eastern Europe
A clearer picture of the differences between the EU regions in terms of GDP is shown by Fig. 3. This presents GDP expressed in PPS compared to the EU-28 average. The level of the indicator value is represented on the map by different colours. Typically, lower values than the EU-28 average are found in the Eastern EU countries. The lowest values ​​are in Romania, Bulgaria, Hungary, Croatia, Slovakia, Poland, Latvia, Lithuania and Estonia. Some higher values ​​are recorded in the regions which include capitals of Poland, Hungary, Slovakia, Slovenia, Czech Republic and Romania. Among Eastern countries, only Cyprus has a value close to the EU average. It is also to be noticed that in the same country there may be notable interregional differences in terms of GDP. Such differences exist in Poland, Spain, Portugal and Italy. The GDP expressed in PPS is higher in Western countries, except for some regions in Southern Italy, Spain and Portugal, and in the northern United Kingdom, which have lower values ​​of the GDP expressed in PPS- between 62% and 80% of the average .

Fig. 3. Regional GDP (PPS/inhabitant in % of EU-28) in the NUTS 2 regions – 2011
Source: Eurostat (http://epp.eurostat.ec.europa.eu/tgm/mapToolClosed.do?tab=map&init=1&plugin=1&language=en&pcode=tgs00006&toolbox=types)
The analysis of the overall development level is continued by observing the trends that have occurred in the NUTS 2 regions in the context of the EU accession. From Table 3 it can be seen that the regional GDP (in PPS), expressed as a percentage of the EU-27 average, has registered remarkable increases in the period of EU accession. The lowest value in 2004 was 22.58% and in 2008 it reached 28%. If two years before accession there were only two regions that exceeded the EU average of the GDP expressed in PPS (Prague and Bratislava), 2 years after accession there were already five regions that exceeded the EU average, while in 2011 there were six. These are the regions which include capitals of the Czech Republic, Slovakia, Slovenia, Romania, Hungary and Poland. The six regions together with Cyprus and Malta recorded a GDP in PPS higher than 75 % of the EU average, thus getting out of the category of underdeveloped regions. In the case of the states that have more NUTS 2 regions, the area that includes the capital has a GDP expressed in PPS above the EU average.
Table 3. Evolution of GDP (PPS/inhabitant) relative to the EU average in the NUTS 2 regions of Central and Eastern Europe countries
|
No. |
Region |
% of the EU-27 average – 2001 |
% of the EU-27 average – 2005 |
% of the EU-27 average – 2011 |
|
|
1 |
CZ01 – Praha |
147.98 |
165.78 |
170.24 |
|
|
2 |
CZ02 – Strední Cechy |
68.69 |
72.00 |
72.22 |
|
|
3 |
CZ03 – Jihozápad |
67.17 |
73.33 |
69.84 |
|
|
4 |
CZ04 – Severozápad |
59.60 |
64.00 |
62.30 |
|
|
5 |
CZ05 – Severovýchod |
65.15 |
66.67 |
66.27 |
|
|
6 |
CZ06 – Jihovýchod |
66.16 |
69.78 |
73.02 |
|
|
7 |
CZ07 – Strední Morava |
59.09 |
61.33 |
65.48 |
|
|
8 |
CZ08 – Moravskoslezsko |
57.07 |
67.11 |
70.63 |
|
|
9 |
EE00 – Eesti |
46.46 |
61.33 |
69.05 |
|
|
10 |
CY00 – Kypros |
89.90 |
92.44 |
93.65 |
|
|
11 |
LV00 – Latvija |
38.38 |
49.33 |
59.52 |
|
|
12 |
LT00 – Lietuva |
41.92 |
54.67 |
67.06 |
|
|
13 |
HU10 – Közép-Magyarország |
90.91 |
101.78 |
109.52 |
|
|
14 |
HU21 – Közép-Dunántúl |
54.04 |
59.56 |
58.73 |
|
|
15 |
HU22 – Nyugat-Dunántúl |
59.60 |
63.11 |
67.86 |
|
|
16 |
HU23 – Dél-Dunántúl |
42.93 |
44.00 |
44.44 |
|
|
17 |
HU31 – Észak-Magyarország |
38.38 |
41.78 |
39.68 |
|
|
18 |
HU32 – Észak-Alföld |
39.39 |
40.44 |
42.46 |
|
|
19 |
HU33 – Dél-Alföld |
42.93 |
43.56 |
44.05 |
|
|
20 |
MT00 – Malta |
80.81 |
80.00 |
85.32 |
|
|
21 |
PL11 – Lódzkie |
42.42 |
47.11 |
60.32 |
|
|
22 |
PL12 – Mazowieckie |
74.24 |
80.89 |
105.95 |
|
|
23 |
PL21 – Malopolskie |
39.90 |
44.00 |
55.95 |
|
|
24 |
PL22 – Slaskie |
51.01 |
55.56 |
70.24 |
|
|
25 |
PL31 – Lubelskie |
33.84 |
35.11 |
44.05 |
|
|
26 |
PL32 – Podkarpackie |
33.84 |
35.56 |
44.05 |
|
|
27 |
PL33 – Swietokrzyskie |
35.86 |
38.22 |
48.41 |
|
|
28 |
PL34 – Podlaskie |
36.36 |
37.78 |
46.83 |
|
|
29 |
PL41 – Wielkopolskie |
50.51 |
54.67 |
67.46 |
|
|
30 |
PL42 – Zachodniopomorskie |
46.46 |
47.11 |
54.76 |
|
|
31 |
PL43 – Lubuskie |
41.92 |
46.22 |
53.57 |
|
|
32 |
PL51 – Dolnoslaskie |
47.47 |
52.89 |
73.41 |
|
|
33 |
PL52 – Opolskie |
37.88 |
42.22 |
51.98 |
|
|
34 |
PL61 – Kujawsko-Pomorskie |
43.43 |
44.44 |
53.17 |
|
|
35 |
PL62 – Warminsko-Mazurskie |
36.36 |
39.11 |
46.83 |
|
|
36 |
PL63 – Pomorskie |
46.97 |
50.67 |
61.90 |
|
|
37 |
SI01 – Vzhodna Slovenija |
67.17 |
72.00 |
70.24 |
|
|
38 |
SI02 – Zahodna Slovenija |
94.95 |
104.89 |
99.60 |
|
|
39 |
SK01 – Bratislavský kraj |
115.15 |
146.22 |
184.92 |
|
|
40 |
SK02 – Západné Slovensko |
48.48 |
56.89 |
71.83 |
|
|
41 |
SK03 – Stredné Slovensko |
43.43 |
46.22 |
58.73 |
|
|
42 |
SK04 – Východné Slovensko |
39.90 |
42.67 |
50.79 |
|
|
% of the EU-27 average – 2004 |
% of the EU-27 average – 2008 |
% of the EU-27 average – 2011 |
|||
|
43 |
BG31 – Severozapaden |
26.73 |
28.00 |
28.57 |
|
|
44 |
BG32 – Severen tsentralen |
27.19 |
30.00 |
30.95 |
|
|
45 |
BG33 – Severoiztochen |
30.41 |
37.60 |
37.30 |
|
|
46 |
BG34 – Yugoiztochen |
31.80 |
36.00 |
37.70 |
|
|
47 |
BG41 – Yugozapaden |
50.69 |
72.40 |
77.78 |
|
|
48 |
BG42 – Yuzhen tsentralen |
26.73 |
30.40 |
32.14 |
|
|
49 |
RO11 – Nord-Vest |
32.26 |
42.00 |
41.67 |
|
|
50 |
RO12 – Centru |
33.64 |
44.40 |
45.24 |
|
|
51 |
RO21 – Nord-Est |
22.58 |
28.80 |
28.57 |
|
|
52 |
RO22 – Sud-Est |
30.41 |
37.20 |
39.29 |
|
|
53 |
RO31 – Sud – Muntenia |
28.57 |
38.40 |
39.68 |
|
|
54 |
RO32 – Bucuresti – Ilfov |
70.97 |
116.40 |
121.83 |
|
|
55 |
RO41 – Sud-Vest Oltenia |
28.11 |
34.80 |
36.90 |
|
|
56 |
RO42 – Vest |
37.79 |
51.20 |
53.57 |
|
|
57 |
HR03 – Jadranska Hrvatska |
* |
58.33 |
||
|
58 |
HR04 – Kontinentalna Hrvatska |
* |
61.90 |
* Croatia joined EU in 2013, so, at the time there is no data available for 2014 in order to calculate the post-accession indicators.
Source: elaborated using Eurostat data (http://appsso.eurostat.ec.europa.eu/nui/submitViewTableAction.do)
The regional GDP expressed in PPS continued to approach the EU average in the years that followed, the disparities decreasing more or less, depending on the growth rate of the GDP recorded in each region.
Conclusions
Along with the eastward expansion of the EU, the differences in development between the EU states and regions have become more pronounced. The EU cohesion policy has been created just for reducing these disparities, the most significant allocations being meant for the underdeveloped regions.
From the analysis carried out, we noticed that Central and Eastern European states, that joined the EU beginning with 2004 have values ​​of GDP per capita (expressed in Euro and PPS) significantly lower compared to the EU average. The differences are l
Cite This Work
To export a reference to this article please select a referencing stye below:
Related Services
View all


DMCA / Removal Request
If you are the original writer of this essay and no longer wish to have your work published on UKEssays.com then please click the following link to email our support team:
Request essay removal