Economic Models for Scarcity of Resources
| ✅ Paper Type: Free Essay | ✅ Subject: Economics |
| ✅ Wordcount: 1133 words | ✅ Published: 29 Aug 2017 |
Scarcity of resources is one of the basic issue in the economy. Countries all around the world has limited amount of economic resources to fulfill the unlimited needs and wants. Therefore people need to select what to produce, how to produce and for whom to produce. These three fundamental questions required to accomplish in the most ideal way by effective utilization of resources. In this situation Economic models play a vital role in order to drive country towards it’s development and success.
It was found that “Economic models are simplified versions of reality used to analyze real world economic situations” (Hubbard, Garnett, Lewis and O’Brien, 2015, p.10). In other words Economic model is a simple explanation of reality. It is comprise of mathematical equations and it represent the expected behavior of the economy. It assist economist to examine, recognize and make perditions about real world economic. As the economy is consist of many economical problems, economic models help to simplify the complex economic process and find the answers to problems. Furthermore economist use several models to analyze the one economic problem.
The below graph explains the production possibility frontier (PPF) of rubber and plastic. For example assume that the economy produces only two types of products called rubber and plastic at a time and all other goods and services are constant.

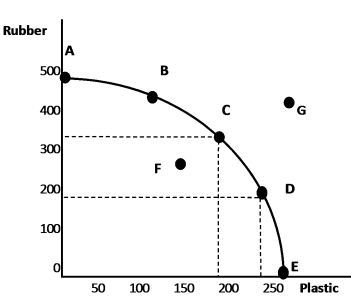
As indicated by the diagram, the points located on the frontier (A, B, C, D, E) are efficient and can be achieved by effective consumption of resource. This economy can produce 500 units of rubber per day if they occupied their all resources to produce rubber. In the event that they use all resources to produce plastic, they can produce 250 units of plastic every day. The point outside the frontier (G) is unachievable with existing resources. Point inside the frontier (F) is attainable but inefficient because the resource are not allocated properly. If economy produce both plastic and rubber they can achieve 350 rubber and 175 plastic such as point C. Economy will lose 150 rubber production if they produce more 50 plastic per day and it known as opportunity cost. The downward movement on the PPF experiences in rising marginal opportunity cost.
In this case the economist assume that only two goods are concerning at a time and all other goods and services are constant. Furthermore they assume that the consumers are knowledgeable, and they react to economic incentives and concerning the additional benefit or cost when making decision. But in real economy there are large number of products producing at a time. And also motives are different from each and every customers. Some customers may motivates for price and some are for quality. Moreover in trade off economist assume that the only two countries are involve in trade. Even all these assumptions are not perfectly realistic the predictions of economic models are not always realistic. But government should not ignore the prediction of economic models. Government can use those predication for decision making process and understand the complex economy. After testing the economic models economist can do revisions and moderate the economic models.
Question 02
Demand curve reflects the relationship between price and quantity demanded. Consumers generally demands more of a product when the price is lower. As price increases, quantity demanded is decreases. Price of the product, income of consumer, price of the related good (substitute good and complementary goods), taste and preference of the consumer, consumer expectation of future price, the number of consumers in the market are the demand determinants of the economy.
Dwivedi (1980) stated that the ” elasticity of demand is defined as the degree of responsiveness of demand for a product to change in its determinants” (p.166). According to the Rissel, B. (2011) “Price elasticity of demand measures how sensitive demand for a good or service is to a change in the price” . It measurements help to determine consumers’ sensitivity to price.In other words price elasticity of demand measures the percentage change in quantity demand caused by a percent change in price. As such, it measures the extent of movement along the demand curve. In these terms if the Ed > 1 demand is said to be elastic, Ed < 1 demand is inelastic, Ed = 1 demand is unit-elastic, Ed = ∞ demand is perfectly elastic and Ed = 0demand is a perfectly inelastic. Price elasticity of demand can be calculated by the below formula;
Price elasticity of demand = Percentage change in quantity demanded
Percentage change in price
When the percentage change in quantity demand will be greater than the percentage change in price it know as elastic demand. The elastic value represent greater than one. Goods which have large number of substitutes have higher elasticity. Motor vehicles can be taken as a good example for elastic demand. According to the Micro economic, it shows that the elasticity for motor vehicle at 1.14. As the price elasticity of demand in between 0-1 this illustrate that a motor vehicle price is elastic.
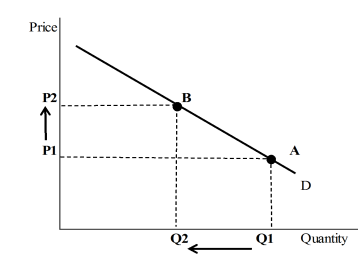
Table 1
People buy motor vehicles to travel from one place to another. But it is not a necessary product for life. There are more substitutes accessible in the market instead of motor vehicle. When the motor vehicle prices are increase the quantity demand will decrease in a larger extent. Because they can delay the purchase or use another transportation method such as public transportation method. The above graph explains when price increases from P1 to P2 the quantity demand decrease from Q1 to Q2 in a larger percentage.
When the percentage change in quantity demand will be less than the percentage change in price it know as inelastic demand. It elastic value represent the greater than one. Goods that are more essential to life, and that have fewer substitutes, typically have lower elasticity. The below graph shows the demand elasticity of food. It represents 0.12.
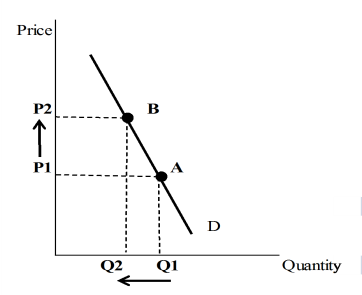 Table 2
When demand is inelastic, it doesn’t much respond to price changes. When the price of inelastic product increase from P1 to P2 the quantity of product decrease from Q1 to Q2. On the other hand if the price of food increase it will affect the demand in less percentage. Because food has few substitutes and it is an essential requirement of people. People will never stop purchasing food even though the price increase rapidly. So the price change of a inelastic product respond a lesser amount of change in quantity.
Reference List
Anderson, P. L., McLellan, R. D., Overton, J. P., & Wolfram, G. L. (1997). Price elasticity of demand. McKinac Center for Public Policy. Accessed October, 13, 2010.
Rissel, B. (2011). Price elasticity of demand. Credit Union Management, 34(10), 22-23. Retrieved from https://search-proquest-com.ezproxy.csu.edu.au/docview/902758503?accountid=10344
N. Gregory Mankiw Principles of Microeconomics, Volume 1
|
Title |
Principles of Microeconomics, Volume 1 |
||||||||
|
Author |
|||||||||
|
Publisher |
Elsevier, 1998 |
||||||||
|
ISBN |
0030245028, 9780030245022 |
||||||||
|
Length |
488 pages 90 p |
||||||||
|
Cite This Work
To export a reference to this article please select a referencing stye below:
Related Services
View all


DMCA / Removal Request
If you are the original writer of this essay and no longer wish to have your work published on UKEssays.com then please click the following link to email our support team:
Request essay removal