Economic Analysis of Australia
| ✅ Paper Type: Free Essay | ✅ Subject: Economics |
| ✅ Wordcount: 2472 words | ✅ Published: 23 Jul 2018 |
Australia has had a good track record of prudent fiscal policy, strong macroeconomic management and performance, and good financial regulation over the years but most importantly all through the global economic crisis. In fact compared to other OECD countries it’s weathered the current crisis extraordinarily well. In 2012 the Gross Domestic Product (GDP) in Australia accounted for 2.45% of the world economy at 1520.60 billion US dollars. Since 2008 its economy has grown by 14.3%.
If we take a look at Australia’s GDP per capita, the biggest rally is in 2009 if you measure it in US dollars. Where growth since 2007 is 42% compared to 24% using nominal Australian dollars. If we take inflation into account and look at Real GDP, which is a more realistic view as it’s used to define the standard of living; Australia has increased by 5% since 2007. Relative to the UKs decline by 6% during the same period, this is an outstanding result.
Growth of Australia GDP per capita (2007=100)

|
2006 |
2007 |
2008 |
2009 |
2010 |
2011 |
2012 |
2013 |
|
|
Real (A$) |
97.4 |
100.0 |
100.5 |
110.1 |
101.3 |
102.2 |
104.1 |
105.4 |
|
Nominal (A$) |
93.3 |
100.0 |
107.1 |
107.0 |
114.0 |
119.6 |
121.1 |
124.4 |
|
Nominal (US$) |
83.3 |
100.0 |
108.8 |
101.0 |
125.0 |
147.2 |
149.6 |
142.6 |
Data source: IMF
Australia’s economy is dominated by its services sector, yet its economic success is based on its abundance of agricultural and mineral resources. Mining, including oil and gas, accounts for 60% of Australia’s exports and over 10% of its Gross Domestic Product.

Source: Australian Government, Dept. of foreign affairs
Australia’s close proximity to China and its strong demand for commodities has also helped with the mining sectors rapid growth in the last 10 years. The expansion in the mining sector has had a knock on effect to other related sectors which have grown rapidly on the back of it – mining equipment, technology and services (METS), education exports, construction and financial services.
Australia’s terms of trade rose to an historic high in to 2011 mainly due to high global prices for its exports such as Iron ore and coal.
Australia acknowledges and it’s been well documented that the mining boom is over its peak and mining related investment is expected to fall dramatically. Therefore, Australia is building a sophisticated services export, converting its natural advantages in mining and agriculture into a wider knowledge-based, diversified and service-oriented economy.
Although some sectors unrelated to mining have struggled with Australia’s strong exchange rate, unemployment, albeit edging higher , remains at a low level, inflation is within targets and public debt is low relative to other OECD countries. Over the medium term the biggest external risk to the Australian economy is a slowdown in growth in China and a related fall in commodity prices. As outlined in the table below over 50% of its exports were shipped to China, Japan and Korea in 2012-2013, if demand from these markets were to fall dramatically it could be detrimental to the Australian economy.
|
Australia’s main export destinations |
2012-13 (e) (f) |
|
|
1 |
China |
31.60% |
|
2 |
Japan |
18.80% |
|
3 |
Republic of Korea |
7.70% |
|
4 |
India |
4.60% |
|
5 |
United States |
3.60% |
Source: Australian Government, Dept. of foreign affairs
Between 2008 and 2013 the Australian government took a number of steps to boost trade and investment, among these they reduced taxes on imports and simplified the screening process for foreign direct investment. Because of these alterations to policy Australia is 4th in OECD for ease of trade and investment flows, behind only the Netherlands, Poland and Belgium.
As pointed out by Brian Aitken, IMF Mission Chief to Australia- “Australia’s flexible exchange rate provides a buffer against shocks and the authorities have both monetary and fiscal policy space to react if the outlook deteriorates “ (Australia on Path to Broader-based Growth, IMF Survey, February 12, 2014).
The government aims to reach a fiscal surplus over the medium term and have put strategies in place to do so. Which will put them in a position to take the necessary steps; they believe, to counter act damage to their economy.
As noted above, Australia has a flexible exchange rate which means that the Reserve Bank (RBA) is able to react to shocks in the market by altering its independent monetary policy. As outlined in the graph below its exchange rate main trend has been growth since 2008/2009 with a slight decline in value recently. This strong exchange rate has boosted household income because of cheaper imports however it has had an adverse effect on the international competitiveness of manufacturing firms – particularly the car sector, education and tourism sectors. All that said, as outlined in the OECD Economic Survey 2012;
“The Stronger exchange rates together with capital-goods investment have increased imports and thus widened the current account deficit.”
In the IMFs Article IV the economists are noted to believe that “despite some recent depreciation , Australia’s exchange rate is still moderately overvalued and is weighing down non-mining activity. “

Unlike most OECD countries the Australian Banking Sector has continued to perform well, has kept pre crisis profits through 2008 to date, and continued to be rated favourably by international rating agencies, current rating AAA. Their exposure to the stressed banking sector in Euro zone is low and the Australian governments’ priority is to help preserve the banking sector as this will aid them in accessing international capital markets with relative ease. In February 2012 the government implemented a deposit guarantee scheme for all bank deposits up to 250,000 AUS dollars which will fully protect 99% of deposits in any Australian bank.

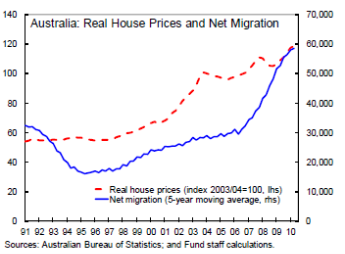
Over the last 12 months Australia has seen an upsurge in the housing markets, mainly concentrated in the major cities where house prices rose by 10%,the highest yearly growth in four years. This in turn has led to an upsurge in the construction sector, which had previously been weak. However, it is not envisaged that construction of new homes will meet demand which could attribute further to house price acceleration. Household credit has remained moderate; however, Australian government and banks need to learn from its peer’s mistakes in OECD and guard against the effect a sudden drop in house price which could mean a reduction in consumer confidence and an impact on economic activity.

Some point to Australia’s tax system as a major contributor to the house price surge, record low interest rates are being paid on savings and very attractive tax concessions being offered to property investors such as negative gearing and capital gains discount. However high taxes and charges on new homes, a difficult planning process and the urban consolidation policies are driving costs higher, which in turn is helping to further inflate house prices. That said, despite growth in the housing market being largest since 2009, there had been a decline in housing prices in 2011 & 2012 totaling 4.2% similar to the decline in 2008, so an increase was expected by most .The labour market is also effecting house prices with unempolyemnt rising and people moving mainly to the cities to get empolyment, a factor which is attributing to both house price and rental market increases.
Another contributing factor is Australias population growth and immgration. In 2009 the popluation grew by 2%, over half of this was net migration alone.
On the back of demand for new homes economists expect an increase in the construction sector in 2014 to help boost economic growth. Already Australia has seen an increase in the approval of residential homes, January alone seen an increase of almost 7%, which puts the annual growth rate at 34.6%.

Australia’s unemployment rate climbed to a 10 year high in January 2014 – 6%, a 2% increase since 2008 that said it is low compared to other OECD countries which are still feeling the effects of the Global Financial Crisis.
In the recent IMF Article IV report WA Chamber of Commerce and Industry chief economist John Nicolau said of these figures that the state’s economy remains buoyant despite the jump in unemployment. “We’ve got employment growth of around 16,500 new full-time jobs in this last month alone, coupled with 9,000 the month prior,” he said. “That’s the strongest two-month period of employment growth in this state for six years” (abc.net.au, 13th March 2014).

Unemployment Rate 2008 – 2014
Unemployment Rate versus other Economies

This year already new jobs have been generated and filled, approx. 50,000 in February, but the unemployment rate of 6% remains static as there was a 0.2% rise in the proportion of people in work or looking for it – the participation rate now stands at 64.8%. February 2014 marked the 15th consecutive month where unemployment grew less than the size of the labour force.

The inflation rate in Australia has remained relatively low in recent years (table below), down from 4.4% in 2008. This is consistent with the central bank’s objective of an average inflation rate of between 2% and 3% a year. The Reserve Bank of Australia (RBA) expects that inflation will stay at or below this until at least mid-2015, with wage growth forecast to remain contained.
Historical Inflation Rates (2008 – 2014)
|
Year |
mar |
Jun |
sep |
dec |
Ann |
|
2013 |
2.5% |
2.4% |
2.2% |
2.7% |
2.5% |
|
2012 |
1.6% |
1.2% |
2% |
2.2% |
1.7% |
|
2011 |
3.3% |
3.5% |
3.4% |
3% |
3.3% |
|
2010 |
2.9% |
3.1% |
2.9% |
2.8% |
2.9% |
|
2009 |
2.4% |
1.4% |
1.2% |
2.1% |
1.7% |
|
2008 |
4.3% |
4.4% |
5% |
3.7% |
4.4% |
Source:rateinflation.com
Last year, 2013, Australia’s inflation rate moderate to around 2.2% – 2.5%, and has been broadly stable since, reflecting ongoing strength in the Australian dollar, broad-based competitive pressures within the domestic economy and subdued growth in costs.
The absence of high inflationary pressures is another aid so the government can alter monetary policy as and when it needs to in order to help guard the economy against risks.
The Australian cash rate fell from 7% in 2008 in response to the Global Economic Crisis; the Reserve Bank of Australia cut interest rates by 4% between September 2008 and February 2009 in response to the slowdown of their economy – an effect of the Global Financial Crisis. RBA cut interest rates again in 2012 in response a worsening outlook to the global economy and signs of their own weakening labour market. The cash rate now stands at 2.50%, the lowest on record. However, this is expected to edge higher this year as growth is expected to strengthen helped by the low interest rates and inflation is expected to stay within target of 2%-3%. In the long run an increase in interest rates could help the spiraling house prices in the major cities come back to more realistic valuations.

A new government was voted into Australia in September 2013 and they are preparing for their first budget in May. The budget deficit for 2012 – 2013 was 2.6% of GDP an increase from 1.3% in 2008- 2009. Top of the new government’s agenda is to tackle public debt, and they are being very vocal in pointing the finger of blame at their predecessors.
“Of the 17 top surveyed IMF countries, Labour left us with the fastest growth in spending of anyone in the world… and they left us with the third highest growth in debt of anyone in the top 17,”( Mr Hockey, Treasurer, abc.net.au,13th March 2014)

Their aim is to return their budget to surplus and maintain a budget surplus going forward; to do this a huge cut in spending will be needed.
As highlighted in the IMFs article IV;
“If tax revenue is held at its average level over the last decade, the resulting budget deficit in 2023/24 would reach 2 percent of GDP. Reaching the government’s budget surplus target would thus require cutting spending by around 3 percent of GDP, either by reducing net non-social spending or by putting in place policy measures to contain increases in social spending”( IMF Article IV, 2014)
Consumer confidence has been low, Consumer spending was held back in 2013 because of uncertainty around the government election in that September, high household debt, and uncertainty in the economy. In the year to June 2013 retail sales growth rates were at their lowest rate in 51 years, rising just 2.5% from the previous year. Because of this consumers have increased their saving rates since 2007 and reduced their demand for loans.
Although household debt is high, Australian households seem to be able to meet this debt with only 1% non-preforming house loans and 50% of owner occupiers repaying ahead of their mortgage schedule.
Compared to other OECD countries tax to GDP in Australia is low. Since 1965 Australia has ranked in the bottom third of OECD countries and in 2010 it ranked fifth lowest over all.
Tax-to-GDP ratio for OECD countries, 2010

Source: OECD Revenue Statistics, 2012.
Of the OECD countries Australia also has the third lowest level of taxation on personal income which includes social security taxes and taxes on payroll.
Tax revenue (% of GDP) in Australia

Source: tradingecomomics.com
In 2008 tax revenues were steady at approx. 24% however as a result of the Global Economic crisis tax to GDP fell to approx. 20% in 2010 – 2011 since then total taxes have recovered one third of the lose but are still not back at 2008 level.
Australia’s tax components are very similar to other OECD countries but with one major difference, Australia is one of two countries in OECD which do not levy social security taxes.
Conclusion:
Over all the Australian economy has performed very well since 2008, mainly because of its mining sector and related industries. The big challenge ahead is whether and how quickly it can adapt to mining construction falling. Home building and mining exports could help boost the economy and drive economic growth in the medium term.
Now that the election is over and there is renewed demand for housing could be indicators of a boost consumer confidence and help the consumer start to spend again. If interest rates remain low this will help stimulate discretionary consumer spending and dwelling construction.
Unemployment is still low at 6% compared to Australia’s OECD peers and new jobs are being generated, aided by a rise in demand for new housing.
The main internal risk to the Australian economy is that the new government may be too aggressive in reducing government spending in their aim for budget surplus however this effect could be lessened by a further cut in interest rates.
The main external risk to the economy as outlined already is Australia’s reliance on the Chinese market and commodity prices. Chinas growth rate is currently at approx. 7%, their government are implanting fiscal stimulus which should boost economic growth which will have a positive effect on the Australian economy as there will be continued demand for commodities to be exported to China. This may also affect the demand for housing in Australia as Chinese investors buy to rent, thus boosting the employment sector.
The Australian banking sector is strong and both domestic and international markets have fate in it, it is one of only eight sovereigns globally to be rated AAA with a stable outlook by all the major credit rating agencies. This is a huge endorsement on the Australian Economy.
If any shocks were to apply to the Australian Economy, its government are one of few globally that have the fiscal and monetary policy that will enable them to adapt very quickly. Australia’s economic performance to date has been the result of good structural reforms, demand for commodities and sound macroeconomic policies, hence the IMF forecasting “annual average GDP growth for Australia of 3.1% between 2013 and 2018 – the highest growth forecast among major advanced economies” (IMF, World Economic Outlook, April 2013).
Bibliography
IMF, Article IV Australia, 2013
OECD, Ecomonic Outlook Australia, 2012
Macrobusiness.com
Tradingeconomics.com
GFmag.com
Reserve Bank Australia
Business.nsu.gov.au
Abc.net.au
Cite This Work
To export a reference to this article please select a referencing stye below:
Related Services
View all


DMCA / Removal Request
If you are the original writer of this essay and no longer wish to have your work published on UKEssays.com then please click the following link to email our support team:
Request essay removal