The Circular Flow Model Analysis
| ✅ Paper Type: Free Essay | ✅ Subject: Economics |
| ✅ Wordcount: 912 words | ✅ Published: 29 Aug 2017 |
The Circular Flow of Income Model
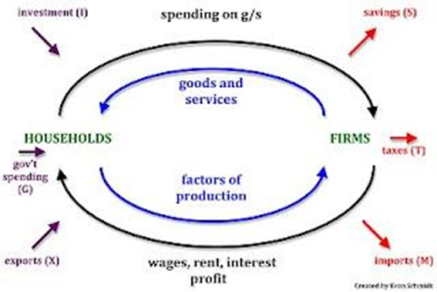
There are two main flows within the model shown above, the flow of physics, things, e.g. Good and services, and the flow of money, which pays for the physical things. There is a specific pattern that the circular flow of income follows: Production – Income – Expenditure – Production. As seen in the diagram above, the spending on goods and services is equal to the income receive by households, therefore National income = National expenditure.
Though not all income produced will be spent on domestically produced goods. Some of the income is used to pay taxes or can be saved or spent on imported products and services. So saving, tax and imports are leakages in the circular flow model. Similarly, sometimes there can be extra spending in the economy, from government expenditure, investment and spending on exports, which is added to the circular flow model. These are called injections.
Aggregate means total and in this case the term is used to help measure how much is being spent by consumers, the government, firms and the people and businesses overseas.
“Aggregate demand (AD) = total spending on goods and services
The formula for calculating aggregate demand is as follows:
AD = C + I + G + (X-M)” (Riley, n.d.)
Consumers (C) – Can also be known as consumptions. This is what households spend on goods and services, with the exception of purchases of new housing.
Capital Investment (I) – This is the money spent on capital goods, e.g. equipment and new buildings to produce more for the consumers.
Government Spending (G) – the spending in goods and services including public goods and merit goods.
Exports (X) – The exports sold overseas are an inflow into the circular flow of income, and also spending adding to aggregate demand.
Imports (M) – imports are a leakage from the circular flow of income and spending.
Net exports help measure the value of exports minus the value of imports.
Macroeconomics is the study of the economy as a whole and the variables that control the macro-economy. One of the key macroeconomic variables is growth. Economic growth is a rise in the capacity of an economy to produce good and services, related from one time to another. It is a measure of expansion of the economy over time. Economic growth is important as it helps achieve higher average incomes, this helps consumers enjoy more goods and services and helps them to enjoy a better standard of living.
Another key macroeconomic variable is full employment. Full employment in an economy situation is where all the available labour is used in the most efficient way possible. Full employment is necessary because it means there is less unemployment. Whenever the unemployment rate gets below 5.5%, the economy is said to be a full employment economy.
A third key macroeconimic variable is price stability. Price stability exists when normal prices are continuous over a period of time or when they are rising at an extremely low rate. Price stability is important as it helps to avoid inflation and deflation. Inflation occurs when the average prices rise above the extremely low rate and deflation occurs when the average price falls
The fourth key macroeconomic variable is favourable balance of payment. Upholding a balance of payments with the rest of the world is another key macroeconomic variable. The balance of payments is a report that reviews an economy’s communications with the world for a specified time. The balance of payments (BOP) accounts all the financial transactions that are made between consumers, firms and the government in one country with another country. Positive entries are the inflows of foreign currency, and the negative entries are the outflow of foreign currency.
How has economic growth changed in the past two years?
In 2014 the UKs economy grew 2.6%, this was the fastest pace since 2007. Figures from the ONS showed that in the final three months of 2014 the economy grew by 0.5%, that was a slowdown from the previous three months which was 0.7%. In 2015 the UK’s economy expanded 0.5% in the final months of the year. However, as a whole, the year was down markedly. Figures show that the GDP only grew 2.2% after rising 2.9% in 2014. In 2016 the UKs economy grew 0.6% in the last quarter of 2016, and by 2% for the entire year, this was better than expected after the Brexit result and it is all thanks to strong consumer spending.
How has employment changed in the past two years?
|
National Unemployment Rates 2014 – 2017 |
||||||||||||
|
Jan |
Feb |
Mar |
Apr |
May |
June |
July |
Aug |
Sep |
Oct |
Nov |
Dec |
|
|
2017 |
4.8% |
4.7% |
/ |
/ |
/ |
/ |
/ |
/ |
/ |
/ |
/ |
/ |
|
2016 |
4.9% |
4.9% |
5.0% |
5.0% |
4.7% |
4.9% |
4.9% |
4.9% |
5.0% |
4.9% |
4.6% |
4.7% |
|
2015 |
5.7% |
5.5% |
5.5% |
5.4% |
5.5% |
5.3% |
5.3% |
5.1% |
5.1% |
5.0% |
5.0% |
5.0% |
|
2014 |
6.6% |
6.7% |
6.7% |
6.3% |
6.3% |
6.1% |
6.2% |
6.1% |
5.9% |
5.8% |
5.8% |
5.6% |
Source: National Conference of Legislatures
The table above helps to illustrate the unemployment rates between 2014 – 2017. The tables shows that the unemployment rate has decreased 1.8% from January 2014 to January 2017
Cite This Work
To export a reference to this article please select a referencing stye below:
Related Services
View all


DMCA / Removal Request
If you are the original writer of this essay and no longer wish to have your work published on UKEssays.com then please click the following link to email our support team:
Request essay removal