Changes in UK Labour Productivity: Analysis
| ✅ Paper Type: Free Essay | ✅ Subject: Economics |
| ✅ Wordcount: 1908 words | ✅ Published: 20 Mar 2018 |
Introduction
The Agents’ scores for capacity constraints:
The series of scores inside the Agents’ Summary of Business Conditions, which is generated by 12 regional officies (Agencies), is a tool for Monetary Policy Committee (MPC) to track the underlying trend in economic factors. The Agents in each region gather the information on economic conditions from their contacts, then judge what value to score subjectively. The scores are the simple way that Agents alter the intelligence they gathered before into a quantitative assessment of the economy over time (Colin Ellis, Tim Pike, 2005).
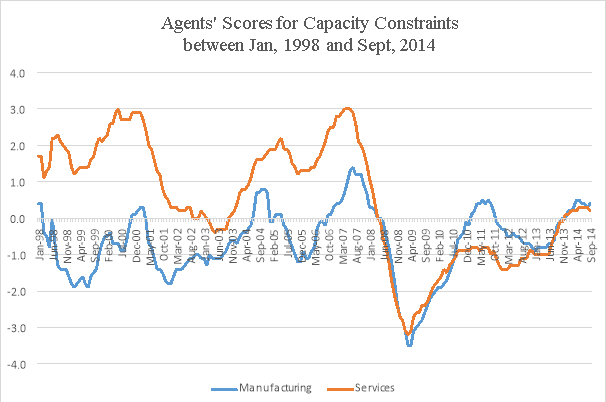
Figure 1: Capacity Constraints Scores in Agents’ Summary of Business Conditions from Jan, 1998 to Sept, 2014 (Source: Bank of England)
Most of the scores are based on a comparison of recent months with the same period a year earlier, however, there are some exceptions like employment intentions or capacity constraints, which are looking forward. The scores range from -5 to +5 with -5 is denoted that rapidly decreasing level and +5 is rapidly growth. In this case, a positive score in Capacity Constraints means that companies face with a little or no pressure on capacity demand and vice versa. In the chart above, it can be seen that there are two downward sloping periods between 2009 and 2013 when were the double-dip recession occurred in the UK. The trend also illustrates an improving progress within a year recently, with a rise of 0.6 points on both sectors.
The UK productivity puzzle
Productivity experience in cross-country and historical views:
The Global Financial Crisis (GFC) in 2007-2008 has caused a significant damage to the economy of most developed countries in the world, including the UK. The decline in output has led to a considerable decline in labor productivity in the UK. Labor productivity has been improving from 2013, but it still be less than its pre-crisis level of around 16% (see Figure 2 below). This shortfall can be referred as the “UK productivity puzzle and it has took a great effort from economists in order to explain the situations, however, it has yet to be answered completely so far.

Figure 2: The UK Labour Productivity (1998-2013). Sources: Moneymovesmarket.com
It can be seen from figure 3 that a weaker performance in labour productivity during the latest recession than all previous post-war recessions. In all recessions before, the first fall in productivity was usually short-lived and the productivity began to increase and regained its peak level after just only almost a year and a half.

Figure 3: Productivity per person after UK recessions (Source: Office for National Statistics)
However, this latest episode did not see the same stories as its two previous. Between early 2009 and mid-2010, the productivity made a rise of of approximately one percent and continually levelled off and it did not rise further over the next year as both output and employment saw really slow recoveries.At the time of Q3/2011, the employment was rising sharply while the growth of GDP has shrinked (see Appendix), therefore creating a renew decrease in labour productivity. As a result, the UK productivity still be underneath its pre-recession peak around 4 percent. One remarkable point is that the increasing employment and the weak labour productivity seem to be an odd thing to see among the GFC. If the business is expected to stay weak typical companies will shed labour to boost productivity up.
The productivity weakness of the UK is also unusual when comparing with some international stories for recent years. Despite their increasing growth before the GFC, it has been significantly weaker than some high-income countries’ economy. Looking at figure 4, it is easily seen that the UK productivity performance was consistent with that of other countries suggests that some common factors might be involved.Nevertheless, as mentioned above, there has been a downward slope in UK productivity in mid-2011 which was not encountered to the same level elsewhere.The weak productivity of Germany is due to the unusual strong employment referred to the past. One additional point is that only Italy has the similar trend with the UK, showing the impact of GFC on their labour productivity.
There are some reasons why these comparison might exaggerate the productivity puzzle’s size. Measurement inaccuracy could take account for a very small piece of productivity weakness. Moreover, expenditure on research and development (R&D) is considered as a part of GDP, therefore GDP can be lifted by around 1.5% points. Another reason here is that the decrease in North Sea oil and gas output (see Appendix) slowed trend growth in labour productivity in this sector. In total, although the measurement issues can explain up to 4% point of the shortfall in productivity there are lots of things to research the remaining.
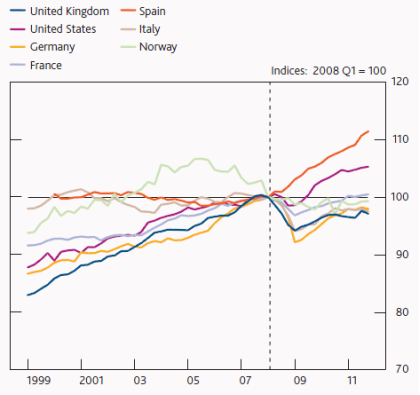
Figure 4: Labour productivity per person across countries between 1999 and 2013
Source: Thomson Reuters Datastream, Eurostat and ONS
Cyclical explanations on productivity shortfall
Lower factor utilisation as a result of weak demand conditions
The first hypothesis suggests that weakness in productivity is cyclical in nature, driven by weak demand conditions. Firms are unable or unwilling to shed labour or dispose of capital but sometimes, they are not as productive as they might have been. The difference between the lower utilisation level and more normal levels of capacity utilisation is called “spare capacity within firms”.
The first reason for this hypothesis is that they need to keep business going by holding a minimum level of staffs, so-called ‘overhead labour’. Therefore, some firms might not have been able to cut employment below the minimum base, like the guards for the construction until it is sold, for example.
Anothing reason should be remarked here is that companies believe the weak demand is temporary. In past experiences, companies made decisions to having fired workers in the early stages of the recession. Conversely, they found it hard to find workers with the appropriate, firm-specific skills. Thus, they missed the opportunities to make a breakthrough on the market. Recently, companies might desire to ‘hoard’ underutilised workers to avoid those lessons from the past. From 2007 to 2012, the proportion of reduced output companies but holding employment rose from about 20 percent than the pre-crisis period (see figure 5). It also suggests that these holding action of firms contributed to the decrease in productivity measured, shown by the diamonds in the chart.

Figure 5: Proportion of reduced output firms but holding labour (from 2005-2012).
Source: ONS and Bank calculations
Spare capacity is measured in the business survey that provide a significant degree of idle capacity within companies in the initial stages of the crisis. However, this business survey just uses the qualitative methods, thus it did not capture the amount of spare capacity in each firm. One additional thing is all answers are subjective so it can be changed over time. It might take no effect on the size of the UK productivity puzzle.
Other cyclical factors
Some sectors had diverted the resources toward activities which is not immediately counted as output. Consequently, it cannot tribute to the total productivity. In contrast, there are some point which indicated that the cyclical hypothesis alone cannot fully explain the productivity puzzle.

|
Pre Crisis (1998 Q1 – 2004 Q4) |
United Kingdom |
United States |
Germany |
France |
|
Total |
2.4 |
2.2 |
1 |
1 |
|
Manufacturing |
4.3 |
7.1 |
2.7 |
3.2 |
|
Services |
2.3 |
1.7 |
0.1 |
0.4 |
|
Recovery (2009 Q3 – 2011 Q4) |
United Kingdom |
United States |
Germany |
France |
|
Total |
0.5 |
2.2 |
1.3 |
1 |
|
Manufacturing |
2.9 |
8.5 |
4.9 |
4.2 |
|
Services |
0.4 |
1.2 |
0.5 |
0.8 |
Effect of persistent factors on productivity puzzle
Tangible and intangible capital investment effects on the shortfall
The consequences of the GFC made the firms’ desire in investment in physical capital more difficult because the tighter credit conditions may lead to a higher cost to obtain finance. The stagnated situation in this period also made investments become less efficient, causing directly the material deterioration in the capital stock of worker. Moreover, a considerable fall in real wages during the crisis (see Appendix) while the cost of capital went up have led the relative cost of labour to capital to be decreasing. Hence, it have provided a motivation to switch to use labor-intensive business and companies decided to increase the labour working hours. However, the production output did not go up due to the low demand conditions, therefore the productivity has been decreased.
Firms also invest in ‘intangible capital’ which include some types like intellectual property rights or brand names, etc. One main point here is the strong relationship between two types of capital investment mentioned above. For example, the innovated implementation can be processed alongside the introduction of plants and machinery. However, R&D expense is considered as the innovation input; that means even though firms have invest a huge amount of money but without new valuable output, which are some types of product or process innovation, there will be an inverse impact on the productivity. According to the data of the UK Innovation Survey, there has been a fall of about 30% in both product and process innovation among the crisis despite an increasing trend in spending budget on R&D (see figure …). These capital channels have explained a considerable proportion, about 3 to 4 percentage points, of the shortfall in the UK.
Impaired resource allocation and the higher firm survival

Figure 6: Decomposition of the UK Labour Productivity (2004-2012).
Source: ONS and Bank calculations.
Looking at the graph above, it is seen that there is a downward sloping trend in the contribution from reallocation, as a result of higher insolvencies or firing behavior (Riley et al, 2014), and its contribution decreased even further, becoming minor between 2010 and 2012. As mentioned above, uncertainty have made firms more wary when investing and labour reallocation. Moreover, the financial system have played a role to have impaired the movement of resources through two channels: impaired capital allocation and higher firm survival.
Broadbent (2012, 2013) declares that considerable changes in rates of return on capital across sectors might not be associated with the following movements of capital stocks. In addition, Barnett et al (2014b) highlight an economic model with multiple firms and sectors to analyse that a high price dispersion might be used to explain the productivity loss with around 3 to 4 percentage point.
According to Arrowsmith et al (2013), there has been a bank forbearance which provide the measures of support to firms struggling to meet its debt obligations. Although the direct impact have been a little at around one percentage point, the overall impact might have been greater because the widespread effect of the forbearance in the whole sector. Moreover, Arrowsmith et al (2013) indicated that the low level of Bank rate has supported to retain the borrowing costs for firms fairly low. The unusually low rate of firm collapse is to have lowered labour productivity by up to 5 percentage points.
Relationship between the labour productivity and monetary policy decision
The outlook for inflation in the medium-term depends on the balance of demand and supply in the economy. In theory, if supply is greater than the goods and services that people demand, prices will tend to fall and vice versa. Hence, the MPC should make an assessment about up-to-date indicators and prediction in supply, as well as demand.
In recessions, demand typically falls by more than supply. An output gap opens up – the economy can supply more than is currently demanded. And unless that gap is closed, it will push down on costs and prices. But assessing the size of the output gap is very difficult, for exactly the reasons we have been discussing today. Early estimates of economic activity can be revised substantially, so it is hard to know just how weak demand and output really are. And it is equally difficult to know the extent to which the supply potential of the economy has been affected by the recession.
1 | Page
Cite This Work
To export a reference to this article please select a referencing stye below:
Related Services
View all


DMCA / Removal Request
If you are the original writer of this essay and no longer wish to have your work published on UKEssays.com then please click the following link to email our support team:
Request essay removal