Calculating GDP and National Income of the US
| ✅ Paper Type: Free Essay | ✅ Subject: Economics |
| ✅ Wordcount: 1231 words | ✅ Published: 01 Dec 2017 |
Executive Summary
The economy of both the country effect the GDP of the US. I also wrote about national income and the way to calculate national income . The growth of GDP in the US is because the good and services that is exported. What causes the growth of of GDP increase when both of the country economic grow rapidly . Macroeconomists study aggregated indicators such as GDP, unemployment rates, and price indices to understand how the whole economy functions. Macroeconomists develop models that explain the relationship between such factors as national income, output, consumption, unemployment, inflation, savings, investment, international trade and international finance. In contrast, microeconomics is primarily focused on the actions of individual agents, such as firms and consumers, and how their behavior determines prices and quantities in specific markets.
In task 2 I wrote about the problems that encountered in calculating the national income . There are few problems that occur in calculating national income . Next ,calculate the gross domestic product at market price , calculate the gross market price at market price , gross domestic price at factor cost , net national product at factor cost , net national output at market price , the net investment and corporate profit .
- National Income
National income is the total value a country ‘s final output of all new goods and services produced in one year . Measuring the level and the rate of growth of national income ( Y ) is important for seeing the rate of economic growth , changes to average living standard and changes to the distribution of income between group within the population . Furthermore , the labor and capital of a country acting its natural resources produce annually a certain net aggregate of commodities material an immaterial including services of all kinds . There are three distinct flows of income , output and expenditure . Each of can be quantifiable and hence may be used to measure National Income .
1.1 GDP ( Gross Domestic Product )
GDP (Gross Domestic Product) is the monetary value of all the finished goods and services produced within a country’s borders in a specific time period. Through the GDP is usually calculated on an annual basis . It includes all of private and public consumption , government outlays , investments and exports less imports that occur within a defines territory .
Task 1
- Export for Euro between US
Export is a function of international trade where goods produced in one country are shipped to another country for future sale or trade . Moreover , sales of such goods adds to the producing nation ‘s gross output . If used for trade , exports are exchanged for other products or services . Exports is one of the oldest forms of economic transfers , and occur on a large scale between nations that have fewer restrictions on trade , such as tariffs or subsidies .
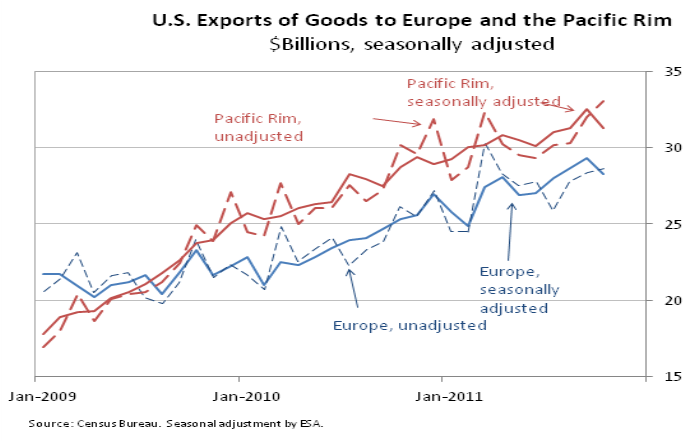 Graph of Export of US To Europe
The potentially affecting US exports directly , difficulties in Europe could also affect other regions of he world , such as the Pacific Rim countries , since Europe is a significant destination for their exports . Moreover , the US exports to those regions wuld be slowed as well . The chart above shows that seasonally adjusted US exports of goods to Pacific Rim countries .
2.1 Graph of Export of US To Japan

Japan has had some difficult times , but its economy is still vitally important to many US business . Exports to Japan totaled $ 60 billion last year . And so far this year they are running 10 percent higher . Japan ‘ s economic growth took a dive because of the natural disaster , but 2012 will clearly be a bounce – back year , fueled by rebuilding as well as the general economic strength of the areas not directly affected by the earthquake and tsunami In subsequent years , growth is likely to taper down to Japan ‘ s sustainable long – term growth rate of just over one percent .
Lastly , the growth of GDP of US rises because of the goods and service that has been export to Europe and Japan increases . This is the reason why the GDP of the US increases .
Task 2
- National Income
National income is the total value a country’s final output of all new goods and services produced in one year . National income can be denoted in different ways with different meaning attached to it .There are three approaches fo measuring national income . The first approach is income approach , expenditure approach and output approach . GDP measures the value of output produced within the domestic boundaries of the country . GDP incudes the output of the foreign owned firms with production plants located in the country . There are three ways of calculating GDP . National output = National expenditure = National income .
3.1 Problems Encountered in Calculating The National Income
The main difficulties which are involved in the measured of national income are following :
The first problem is non – availability of statistical material . Some people like electricians , plumbers do some job in their spare time and receive income . The state finds it very difficult to know the exact amount receives from such services . This income which , should have been added to the national income is not recorded due to lack of full information of statistics material . Secondly , the danger of double counting . For example , while computing the national income , there is always the danger of double or multiple counting . If it is not taken care in estimating the income , the cost of the commodity is likely to be counted twice or thrice and national income will be overestimated .
Moreover , the non – marketed services . It estimate the national income , only those services are included for which the payment is made . The unpaid services , or non – marketed services are exclude from the national income . Lastly , housing . For example a person lives in a rented house . He pays RM 5000 per month to the landlord . The income of the landlord is recorded in the national income . Suppose that the tenant – purchases the same house from the landlord . Now the income of the owner occupants has increased by RM 5000 . Is it not justifiable to include this income in the national income . Should or should not this income be recorded I the national income is still a controversial question .
|
Formula |
RM (Million) |
|
|
Private consumption expenditures + Gross investment +Government consumption expenditure + (Exports – Imports) |
900 + 1,000 + 800 + (2,000 – 1,000) =3,700 |
|
Gross Domestic Product at Market Price – interest rate + Depreciation |
3,700–500 + 200 = 3,400 |
|
Gross Domestic at Market Price + Subsidy – Indirect taxation |
3,700 + 200 – 500 = 3,400 |
|
Gross Domestic Price at Factor Cost + (Exports – Imports) – Depreciation |
3,400 + (2,000+ 1,000) – 200 = 4,200 |
|
Gross Domestic at Market Price + Net factor income from foreign countries – Depreciation |
3,700 + 900 – 200 = 4,400 |
|
Gross Investment – Depreciation |
1,000 – 200 = 800 |
|
Total Income (Exports, Net factor income from foreign countries, gross investment, Subsidy, Dividends, Undistributed corporate profits) – Total Expenses (Imports, Interest of national debt, Salaries and wages, Indirect taxation, Income tax, Corporate taxes) |
(2,000 + 500 + 1,000 + 200 + 200 + 100) – (1,000 + 775 + 1,150 + 500 + 575 + 200) = (4,000 – 4,200) = (200) |
References
Investopedia, (2009). Gross Domestic Product (GDP) – CFA Level 1 | Investopedia. [online] Available at: http://www.investopedia.com/exam-guide/cfa-level-1/macroeconomics/gross-domestic-product.asp [Accessed 12 May. 2014].
Investopedia, (2009). Gross Domestic Product (GDP) – CFA Level 1 | Investopedia. [online] Available at: http://www.investopedia.com/exam-guide/cfa-level-1/macroeconomics/gross-domestic-product.asp [Accessed 12 May. 2014].
Investopedia, (2009). Gross Domestic Product (GDP) – CFA Level 1 | Investopedia. [online] Available at: http://www.investopedia.com/exam-guide/cfa-level-1/macroeconomics/gross-domestic-product.asp [Accessed 12 May. 2014].
Jimeno, J. and Rodri´guez Palenzuela, D. (2002). Youth unemployment in the OECD. 1st ed. [Madrid]: FEDEA.
Kennedy, P. (2000). Macroeconomic essentials. 1st ed. Cambridge, Mass.: MIT Press.
Shapiro, E. (1970). Macroeconomic analysis. 1st ed. New York: Harcourt, Brace & World.
Cite This Work
To export a reference to this article please select a referencing stye below:
Related Services
View all


DMCA / Removal Request
If you are the original writer of this essay and no longer wish to have your work published on UKEssays.com then please click the following link to email our support team:
Request essay removal