Data Analysis: Descriptive Statistics and Assumption Testing
| ✅ Paper Type: Free Essay | ✅ Subject: Data Analysis |
| ✅ Wordcount: 1017 words | ✅ Published: 23 Sep 2019 |
Data Analysis: Descriptive Statistics and Assumption Testing
Correlation: Descriptive Statistics and Assumption Testing
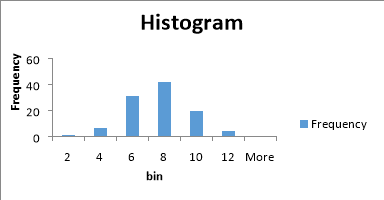
Frequency distribution table
|
bin |
Frequency |
|
2 |
1 |
|
4 |
6 |
|
6 |
31 |
|
8 |
42 |
|
10 |
19 |
|
12 |
4 |
|
More |
0 |
Histogram
Descriptive statistics table
|
Mean annual sick days per employee |
Descriptive statistics |
|
Mean |
7.126214 |
|
Standard Error |
0.186484 |
|
Median |
7 |
|
Mode |
7 |
|
Standard Deviation |
1.892605 |
|
Sample Variance |
3.581953 |
|
Kurtosis |
0.124923 |
|
Skewness |
0.14225 |
|
Range |
10 |
|
Minimum |
2 |
|
Maximum |
12 |
|
Sum |
734 |
|
Count |
103 |
Measurement scale
The minimum and maximum of Mean annual sick days per employee was 2 and 12.
Measure of central tendency
The analysis shows that mean, median, mode and standard deviation of Mean annual sick days per employee was 7.126214, 7, 7 and 1.89 respectively.
Evaluation
The Descriptive Statistics shows that the Kurtosis and skewness of Mean annual sick days per employee is 0.124923 and 0.14225. The assumptions for parametric statistical testing were met here.
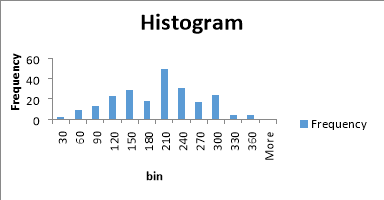
Simple Regression: Descriptive Statistics and Assumption Testing
Frequency distribution table
|
bin |
Frequency |
|
30 |
2 |
|
60 |
9 |
|
90 |
13 |
|
120 |
23 |
|
150 |
29 |
|
180 |
18 |
|
210 |
49 |
|
240 |
31 |
|
270 |
17 |
|
300 |
24 |
|
330 |
4 |
|
360 |
4 |
|
More |
0 |
Histogram
Descriptive statistics table
|
lost time hours |
Descriptive Statistics |
|
Mean |
188.0045 |
|
Standard Error |
4.803089 |
|
Median |
190 |
|
Mode |
190 |
|
Standard Deviation |
71.72542 |
|
Sample Variance |
5144.536 |
|
Kurtosis |
-0.50122 |
|
Skewness |
-0.08198 |
|
Range |
350 |
|
Minimum |
10 |
|
Maximum |
360 |
|
Sum |
41925 |
|
Count |
223 |
Measurement scale
The minimum and maximum of lost time hours was 10 and 360.
Measure of central tendency
The analysis shows that mean, median, mode and standard deviation of lost time hours was 188.0045, 190, 190 and 71.72542 respectively.
Evaluation
The Descriptive Statistics shows that the Kurtosis and skewness of lost time hours is -0.50122 and -0.08198. The assumptions for parametric statistical testing were met here.
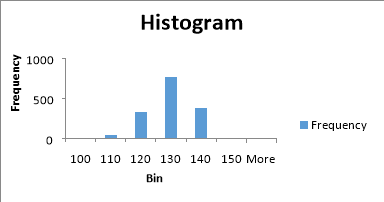
Multiple Regression: Descriptive Statistics and Assumption Testing
Frequency distribution table
|
Bin |
Frequency |
|
100 |
0 |
|
110 |
36 |
|
120 |
324 |
|
130 |
768 |
|
140 |
373 |
|
150 |
2 |
|
More |
0 |
Histogram
Descriptive statistics table
|
Decibel |
Descriptive Statistics |
|
Mean |
124.8359 |
|
Standard Error |
0.177945 |
|
Median |
125.721 |
|
Mode |
127.315 |
|
Standard Deviation |
6.898657 |
|
Sample Variance |
47.59146 |
|
Kurtosis |
-0.31419 |
|
Skewness |
-0.41895 |
|
Range |
37.607 |
|
Minimum |
103.38 |
|
Maximum |
140.987 |
|
Sum |
187628.4 |
|
Count |
1503 |
Measurement scale
The minimum and maximum of Decibel was 103.38 and 140.9871.
Measure of central tendency
The analysis shows that mean, median, mode and standard deviation of Decibel was 124.8359, 125.721, 127.315 and 6.898657 respectively.
Evaluation
The Descriptive Statistics shows that the Kurtosis and skewness of Decibel is -0.31419 and -0.41895. The assumptions for parametric statistical testing were met here.
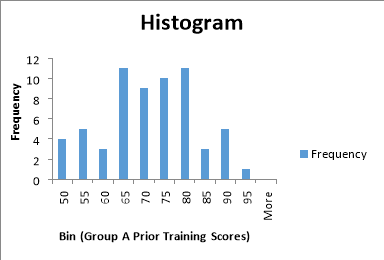
Independent Samples t Test: Descriptive Statistics and Assumption Testing
Frequency distribution table
|
Bin(Group A Prior Training Scores) |
Frequency |
|
50 |
4 |
|
55 |
5 |
|
60 |
3 |
|
65 |
11 |
|
70 |
9 |
|
75 |
10 |
|
80 |
11 |
|
85 |
3 |
|
90 |
5 |
|
95 |
1 |
|
More |
0 |
|
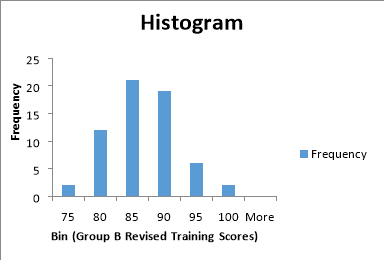
Bin (Group B Revised Training Scores) |
Frequency |
|
75 |
2 |
|
80 |
12 |
|
85 |
21 |
|
90 |
19 |
|
95 |
6 |
|
100 |
2 |
|
More |
0 |
Histogram
Descriptive statistics table
|
Group A Prior Training Scores |
Descriptive Statistics |
Group B Revised Training Scores |
Descriptive Statistics |
|
Mean |
69.79032258 |
Mean |
84.77419355 |
|
Standard Error |
1.402788093 |
Standard Error |
0.659478888 |
|
Median |
70 |
Median |
85 |
|
Mode |
80 |
Mode |
85 |
|
Standard Deviation |
11.04556449 |
Standard Deviation |
5.192741955 |
|
Sample Variance |
122.004495 |
Sample Variance |
26.96456901 |
|
Kurtosis |
-0.77667598 |
Kurtosis |
-0.352537913 |
|
Skewness |
-0.086798138 |
Skewness |
0.144084526 |
|
Range |
41 |
Range |
22 |
|
Minimum |
50 |
Minimum |
75 |
|
Maximum |
91 |
Maximum |
97 |
|
Sum |
4327 |
Sum |
5256 |
|
Count |
62 |
Count |
62 |
Measurement scale
The minimum and maximum of Group A Prior Training Scores was 50 and 91. The minimum and maximum of Group B Revised Training Scores was 75 and 97.
Measure of central tendency
The analysis shows that mean, median, mode and standard deviation of Group A Prior Training Scores was 69.79, 70, 80 and 11.04556 respectively. Similarly, mean, median, mode and standard deviation of Group B Revised Training Scores was 84.77, 85, 85 and 5.19 respectively.
Evaluation
The Descriptive Statistics shows that the Kurtosis and skewness of Group A Prior Training Scores is -0.77667598 and -0.086798138. It also shows that the Kurtosis and skewness of Group B Revised Training Scores is -0.352537913and 0.144084526. The assumptions for parametric statistical testing were met here.
Dependent Samples (Paired-Samples) t Test: Descriptive Statistics and Assumption Testing
Frequency distribution table.
|
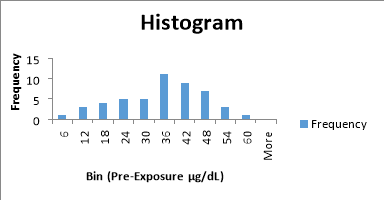
Bin (Pre-Exposure μg/dL) |
Frequency |
|
6 |
1 |
|
12 |
3 |
|
18 |
4 |
|
24 |
5 |
|
30 |
5 |
|
36 |
11 |
|
42 |
9 |
|
48 |
7 |
|
54 |
3 |
|
60 |
1 |
|
More |
0 |
|
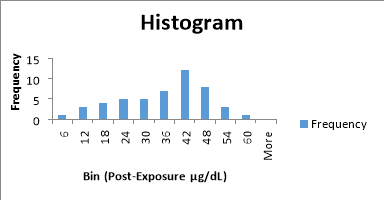
Bin (Post-Exposure μg/dL) |
Frequency |
|
6 |
1 |
|
12 |
3 |
|
18 |
4 |
|
24 |
5 |
|
30 |
5 |
|
36 |
7 |
|
42 |
12 |
|
48 |
8 |
|
54 |
3 |
|
60 |
1 |
|
More |
0 |
Histogram
Descriptive statistics table
|
Pre-Exposure μg/dL |
Descriptive Statistics |
Post-Exposure μg/dL |
Descriptive Statistics |
|
Mean |
32.85714 |
Mean |
33.28571 |
|
Standard Error |
1.752307 |
Standard Error |
1.781423 |
|
Median |
35 |
Median |
36 |
|
Mode |
36 |
Mode |
38 |
|
Standard Deviation |
12.26615 |
Standard Deviation |
12.46996 |
|
Sample Variance |
150.4583 |
Sample Variance |
155.5 |
|
Kurtosis |
-0.57604 |
Kurtosis |
-0.65421 |
|
Skewness |
-0.42511 |
Skewness |
-0.48363 |
|
Range |
50 |
Range |
50 |
|
Minimum |
6 |
Minimum |
6 |
|
Maximum |
56 |
Maximum |
56 |
|
Sum |
1610 |
Sum |
1631 |
|
Count |
49 |
Count |
49 |
Measurement scale
The minimum and maximum of both Pre-Exposure μg/dL and Post-Exposure μg/dL was 6 and 56.
Measure of central tendency
The analysis shows that mean, median, mode and standard deviation of Pre-Exposure μg/dL was 32.85714, 35, 36 and 12.26615 respectively. Similarly, mean, median, mode and standard deviation of Post-Exposure μg/dL was 33.28571, 36, 38 and 12.46996 respectively.
Evaluation
The Descriptive Statistics shows that the Kurtosis and skewness of Pre-Exposure μg/dL is -0.57604 and -0.42511. It also shows that the Kurtosis and skewness of Post-Exposure μg/dL is -0.65421 and -0.48363. The assumptions for parametric statistical testing were met here.
ANOVA: Descriptive Statistics and Assumption Testing
Frequency distribution table.
|
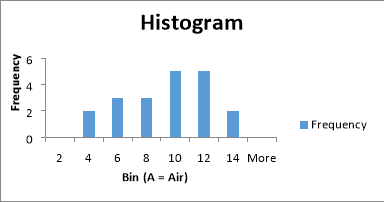
Bin (A = Air) |
Frequency |
|
2 |
0 |
|
4 |
2 |
|
6 |
3 |
|
8 |
3 |
|
10 |
5 |
|
12 |
5 |
|
14 |
2 |
|
More |
0 |
|
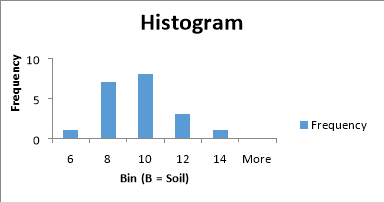
Bin (B = Soil) |
Frequency |
|
6 |
1 |
|
8 |
7 |
|
10 |
8 |
|
12 |
3 |
|
14 |
1 |
|
More |
0 |
|
Bin (C = Water) |
Frequency |
|
2 |
0 |
|
4 |
2 |
|
6 |
9 |
|
8 |
4 |
|
10 |
2 |
|
12 |
3 |
|
More |
0 |
|
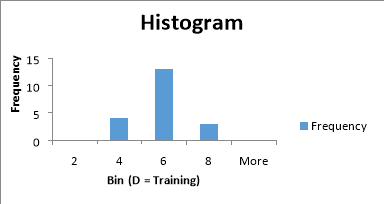
Bin (D = Training) |
Frequency |
|
2 |
0 |
|
4 |
4 |
|
6 |
13 |
|
8 |
3 |
|
More |
0 |
Histogram.
Descriptive statistics table.
|
A = Air |
Descriptive Statistics |
B = Soil |
Descriptive Statistics |
C = Water |
Descriptive Statistics |
D = Training |
Descriptive Statistics |
|
Mean |
8.9 |
Mean |
9.1 |
Mean |
7 |
Mean |
5.4 |
|
Standard Error |
0.684028 |
Standard Error |
0.390007 |
Standard Error |
0.575829 |
Standard Error |
0.265568 |
|
Median |
9 |
Median |
9 |
Median |
6 |
Median |
5 |
|
Mode |
11 |
Mode |
8 |
Mode |
6 |
Mode |
5 |
|
Standard Deviation |
3.059068 |
Standard Deviation |
1.744163 |
Standard Deviation |
2.575185 |
Standard Deviation |
1.187656 |
|
Sample Variance |
9.357895 |
Sample Variance |
3.042105 |
Sample Variance |
6.631579 |
Sample Variance |
1.410526 |
|
Kurtosis |
-0.6283 |
Kurtosis |
0.11923 |
Kurtosis |
-0.23752 |
Kurtosis |
0.253747 |
|
Skewness |
-0.36085 |
Skewness |
0.492002 |
Skewness |
0.760206 |
Skewness |
0.159183 |
|
Range |
11 |
Range |
7 |
Range |
9 |
Range |
5 |
|
Minimum |
3 |
Minimum |
6 |
Minimum |
3 |
Minimum |
3 |
|
Maximum |
14 |
Maximum |
13 |
Maximum |
12 |
Maximum |
8 |
|
Sum |
178 |
Sum |
182 |
Sum |
140 |
Sum |
108 |
|
Count |
20 |
Count |
20 |
Count |
20 |
Count |
20 |
Measurement scale
The minimum and maximum of air was 3 and 14. Similarly, the minimum and maximum of soil was 6 and 13. The minimum and maximum of water was 3 and 12. Similarly, the minimum and maximum of training was 3 and 8.
Measure of central tendency
The analysis shows that mean, median, mode and standard deviation of air was 8.9, 9, 11 and 3.059068 respectively. Similarly, mean, median, mode and standard deviation of soil was 9.1, 9, 8 and 1.744163 respectively. The mean, median, mode and standard deviation of water was 7, 6, 6 and 2.575185 respectively. Similarly, mean, median, mode and standard deviation of training was 5.4, 5, 5 and 1.187656 respectively.
Evaluation
The Descriptive Statistics shows that the Kurtosis and skewness of Air is -0.6283 and -0.36085. It also shows that the Kurtosis and skewness of soil is 0.11923 and -0.492002. Similarly, the Kurtosis and skewness of water is -0.23752 and 0.760206. Moreover, the Kurtosis and skewness of training is 0.253747 and 0.159183. The assumptions for parametric statistical testing were met here.
References
Linoff, G. S. (2010). Data Analysis Using SQL and Excel. John Wiley & Sons.
Whigham, D. (2007). Business Data Analysis Using Excel. OUP Oxford.
Nirel, R., Adar, S. D., Dayan, U., Vakulenko-Lagun, B., Golovner, M., Levy, I., . . . Peretz, A. (2018). Fine and Coarse Particulate Matter Exposures and Associations with Acute Cardiac Events among Participants in a Telemedicine Service: A Case-Crossover Study. Environmental Health Perspectives, 126(9), 097003. doi:10.1289/ehp2596
Cite This Work
To export a reference to this article please select a referencing stye below:
Related Services
View all


DMCA / Removal Request
If you are the original writer of this essay and no longer wish to have your work published on UKEssays.com then please click the following link to email our support team:
Request essay removal