Prediction of Heart Cancer Microarray Data Using Hybrid Particle Swarm Optimization
| ✅ Paper Type: Free Essay | ✅ Subject: Computer Science |
| ✅ Wordcount: 4252 words | ✅ Published: 18 May 2020 |
Prediction of Heart Cancer Microarray Data Using Hybrid Particle Swarm Optimization with Grey Wolf Optimizer and Machine Learning Techniques.
Abstract
The traditional methods of cancer diagnosis and cancer-type recognition have quite a large number of limitations in terms of speed and accuracy. However, recent studies on cancer diagnosis are focused on molecular level identification so as to improve the capability of diagnosis process. The process has been supported by data mining and machine learning techniques such that a smart combination of various algorithms and techniques can generate comparatively efficient and reliable output. By statistically analyzing the datasets using a set of protocols and algorithms, gene expression profiles are efficiently analyzed. For selecting the appropriate features two basic strategies are used viz., subset evaluation and individual particle evaluation. Besides this, various mathematical classifiers are used to classify the selected data. FSS (Feature Subset Selection) plays a vital role in improving the classification (accuracy, AUC) and to obtain more interpretable classifiers by figuring out the outliers. Two different types of feature selection algorithms: set-based and ranking-based are admitted for microarray gene expression data analysis. Various such processes are done on different ratios of training and testing data so as to conclude the best algorithm and technique. The data is optimized using optimization techniques like Particle Swarm Optimization (PSO), Grey Wolf Optimization (GWO) and Hybrid Particle Swarm Optimization with Grey Wolf Optimizer (HPSOGWO). The dataset is of heart cancer.
Keywords
Hungarian, Microarray Dataset, Gene Expression, Cleveland, Switzerland, Grey Wolf Optimization, Particle Swarm Optimization, Hybrid Particle Swarm Optimization with Grey Wolf Optimizer (HPSOGWO)
1. Introduction
Over the past few decades, scientists and researchers have been toiling to come up with more efficient ways to recognize and diagnose different types of cancers at an early stage. Inducting machine learning techniques have so far resulted in quite impressive outcomes. Machine learning (ML) is an artificial intelligence branch that pushes forward the concept that computers can learn on their own how to fix a particular issue by providing access to the correct data. ML makes machines capable of performing independently intellectual functions that have traditionally been solved by humans by leveraging complicated mathematical and statistical instruments. Besides sorting and classifying the datasets, the heart of machine learning technique is the optimization techniques that have been implemented on the raw data. Optimization is one of process integration’s most strong instruments. Optimization includes selecting the “best” solution from the candidate solution package. The solution’s degree of goodness is quantified using an objective feature (e.g., cost) to be minimized or maximized. One such category of optimization techniques is meta-heuristic optimization. Based on simple physical phenomena and some evolutionary concepts, meta-heuristic techniques allow the simulation of nature inspired algorithms on random datasets of cancer patients. Being stochastic, the method allows the coverage of entire search space without any constraints of size or dimension of data.
Thus, apart from obtaining the best quality of solution, another goal of optimization is to improve the convergence. For implementation, different ratios of training – testing data are considered so as to figure out the best solution. Ratios like 90-10, 80-20, 70-30 and 60-40 are considered in the presented work for the evaluation of algorithms.
2. Related Work
An innovative heuristic algorithm inspired by black hole phenomenon was proposed in [22]. In [22], similar to all the population-based algorithms, black hole algorithm (BH) starts with an original population of raw data to an optimization problem and determines a function for them. Further with each iteration the most suitable candidate is determined to be the black hole, which then starts pulling other applicants around it, called stars. If any star is found to be too close to the black hole, the black hole will swallow it and it gets permanently eliminated. In that case, a new star (another candidate solution) generates randomly and gets placed in the search space. To determine the efficiency of this algorithm, the issue regarding clustering is solved, which is a NP-hard problem. In [10], a new meta-heuristic optimization technique called Grey Wolf Optimizer (GWO) inspired by grey wolves (Canis lupus) was proposed. This algorithm is analogous to the leadership hierarchy and mechanism of hunting grey wolves. Four kinds of grey wolves are used to simulate the leadership hierarchy, such as alpha, beta, delta, and omega. For accurate simulation, 3 basic steps of hunting are implemented – looking for the prey, encircling prey, and attacking prey.
3. Dataset Description
The analysis and results in this paper are based on the dataset of heart disease. The primary source is the dataset which has been provided in the UCI machine learning repository. It is used for evaluating the efficiency of the suggested method based on the parameters like accuracy, sensitivity and specificity and other performance metrics. The implementation is done in MATLAB. The directory has four databases in regards with the diagnosis of heart disease.
All the utilized attributes are numeric-valued. The data has been selected from the following four locations:
- Cleveland Clinic Foundation (Cleveland.data)
- Hungarian Institute of Cardiology, Budapest (Hungarian.data)
- V.A. Medical 1center, Long Beach, CA (long-beach-va.data)
- University Hospital, Zurich, Switzerland (Switzerland.data)
The instance format is the same for all the databases. While the databases have 76 raw attributes, it effectively uses only 14 of them. Particularly, the Cleveland database is the only one that ML researchers have used to date. The field “goal” relates to the presence of heart disease in the patient. It is estimated to be an integer between 0 (no presence) and 4. Simulation with the Cleveland database has focused on differentiating the existence (values 1,2,3,4) from absence (value 0).
Attribute Information:
Only 14 attributes used:
1. #3 (age)
2. #4 (sex)
3. #9 (cp)
4. #10 (trestbps)
5. #12 (chol)
6. #16 (fbs)
7. #19 (restecg)
8. #32 (thalach)
9. #38 (exang)
10. #40 (oldpeak)
11. #41 (slope)
12. #44 (ca)
13. #51 (thal)
14. #58 (num) (the predicted attribute)
4. Methods
4.1 Grey Wolf Optimization (GWO)
GWO basically mimics the behavioral pattern of grey wolves in their pack. Their leadership quality as well as hunting pattern is implemented in solving the problem. Grey wolves of four different types such as alpha, beta, delta and omega are implemented for simulating their leadership quality [10]. The steps of solution include hunting, prey searching, encircling that prey and attacking it. The average group size considered is of 5 to 12 wolves. Alpha wolf is considered as the leader of the pack. It takes vital decisions regarding prey selection and sleeping schedules. The alpha wolf may not be the strongest wolf but surely the most dominating one in the pack. Next in the hierarchy is beta wolf. Beta wolves behave as subordinates to assist alpha wolf as and when required. If alpha wolf passes away in the mid of the process, beta wolf is the best choice of substitution.Omega wolf is the one with the lowest ranking. Omegas are the last one to receive all the benefits, including food and sleep. However, omega wolves are sometimes observed to babysit the rest of the wolves in the pack.The final category of wolf is delta wolves. They are subordinate wolves who hold superior position to the omegas. They keep an eye on the boundaries and keep warning the pack about their security and safety.
4.2Opposition Learning Based Grey Wolf Optimizer (OGWO)
To eliminate the drawback of slow speed of GWO, it was hybridized with parallel processing techniques so as to accelerate the convergence rate of GWO. The model is designed on cloud computing platform. The parallelization of tasks enables the quick completion of process and thereby, saves the processing time and energy. The two basic components of the method are tasks and resources. Each task is assigned to a resource in the data pool. Before assigning the components as alpha, beta, gamma or delta wolf, their fitness is ensured. Once assigned, they start the execution of tasks like encircling the prey, hunting and attacking the prey. The process is implemented based on parallel machine scheduling such that efficiency, cost and process time are balanced throughout the execution.
4.3 Particle Swarm Optimization (PSO)
PSO is one of the widest used data optimization algorithms. The technique is inspired from the group of swarms. This nature-based algorithm studies the behavior of swarm in their group and applies the characteristics on random `helps in solving some of the most complicated and complex datasets. Parameters like initial velocity of each particle and communication between the adjacent particles. However, the rate of convergence is remarkably slow, and this method also fails to manage the scattered data.
4.4 Hybrid Particle Swarm Optimization with Grey Wolf Optimization (HPSOGWO)
IN HPSOGWO, PSO and GWO are hybridized using a low level co-evolutionary hybrid. The method is co-evolutionary because instead of applying one after another, we implement both the optimizers parallel. As a result, the exploitation of PSO is improved and exploration of GWO is improved [12]. Thus, the hybridized method proves to be stronger as compared to both the individual methods. The method is applied along with the individual methods on different datasets of heart cancer and final results are discussed in the next section. The pseudocode of Modified Hybrid Algorithm (HPSOGWO). In my paper I have used pseudocode [11] and modified the pseudocode and have used in my research.
Pseudocode of Modified Hybrid Algorithm (HPSOGWO).
Initialization
Initialize l,a,w and c
//w = 0.5 + rand()/2
Evaluate the fitness of agents by using
while (t < max no. of iter)
For each search agent
Calculate objective function for each search agent
Update the velocity and position by using
vik+1 = w * (vik + c1r1 (x1 – xik) + c2r2(x2 –xik) + c3r3 (x3 – xik))
xik+1 = xik + vik
end for
Update l,a,w and c
Evaluate the fitness of all search agents
t = t + 1
end while
return// first best search agent position
4.5 Classification techniques
- SVM: Support Vector Machine is a new approach to supervised pattern classification that has been implemented effectively to a broad spectrum of pattern recognition problems and is also a training algorithm for learning classification and regression rules from data [13]. Besides that, SVM is based on strong mathematical foundations and results in easy manner and very powerful algorithms, it is best suited for operating correctly and effectively with high dimensionality feature spaces. Support vector machines (SVM) use a system called kernels, which practically calculates the distance between two observations. The SVM algorithm then discovers a decision boundary that maximizes the distance between distinct classes ‘ nearest members.
- Improved SVM with Gaussian Kernel: Based on the statistical learning process, Kernel methods, such as Support Vector Machines (SVMs), are the most popular classification tools in machine learning systems. Support vector classification accompanied with the Gaussian RBF kernel is highly influenced by the width of the kernel. Small kernel width can lead over-fitting while the large kernel width triggers under-fitting [14]. They help in mapping the input data into the Reproducing Kernel Hilbert Space (RKHS), where linear algorithms are used to study the non-linear relations in the input data. Such representation leads to better generalization performance, but the need to manipulate the kernel matrices of kernel methods has a noteworthy computational bottleneck with the computational time in O(N3 and the space cost in O(N2, where N is the size of the training set.
- Improved SVM with Radial Basis Kernel: This kernel maps the samples into a higher dimensional space in a nonlinear approach, so it, unlike the linear kernel, can deal with the situation when the relation between class labels and attributes seems nonlinear [15]. Radial Basis Polynomial Kernel (RBPK) assembles the characteristics of the two kernel functions: The Radial Basis Function (RBF) kernel and the Polynomial kernel and comes out as a better kernel function as compared to the two when applied individually [16].
- Random Forest: Random forests, also known as random decision forests, is a technique used to develop predictive models for classification and regression problems. Ensemble techniques use various learning models to generate efficient prediction results – the model constructs an entire forest of random uncorrelated decision trees to obtain to the best possible answer [17]. In [17], A random forest is a meta estimator that fits an amount of decision tree classifiers on various sub-samples of the selected datasets and does average to improve the accuracy of prediction and control over-fitting. The sub-sample size is necessarily same as the sample size of the initial input, but the samples are drawn with replacement if bootstrap= True (default).
- K-Nearest Neighbor Method: The K-nearest neighbors (KNN) algorithm is a lucid and easy-to-implement machine learning algorithm. It is normally used to solve both classification as well as regression problems. The algorithm determines the close proximity of similar things. In other words, similar things are assumed to be close to each other. KNN works by calculating the distances between the query and all the examples in the data space, selecting the specified number examples (K) closest to the query and then voting for the most common label (in the classification case) or averaging the labels (in the regression case). When KNN is used for regression, the prediction is done on the basis of their mean or median values [18]. When using KNN for classification, it is possible to determine the output as the class with the highest frequency out of the most similar instances. Each instance is considered as the prediction in votes for their class and the class with the most votes.
- Naïve Bayes: Naive Bayes is a simple yet extremely powerful algorithm for predictive modeling. Naive Bayes is basically an algorithm for binary (two-class) as well as multi-class classification problems class. When done using binary or categorical input values, the method seems to be easy. It is known as Naive Bayes because to make the calculations tractable as in this algorithm the calculation of the probabilities for each hypothesis is simplified [21]. Bayes’ theorem seeks many uses in probability theory and statistics [20]. Using Bayes’ theorem, one can design a learner which predicts the probability of the response variable belonging to some class, from a new set of attributes.
5. Results
5.1 Cleveland Output
Table2 shows the output of Cleveland evaluated on the dataset of heart cancer. The analysis has been done on different ratios like 90-10, 80-20, 70-30 and 60-40. The result is then classified using classifiers like Support Vector Machine (SVM), Radial Basis Kernel, Gaussian Kernel, KNN and, Random Forest. Optimization techniques like GWO, OGWO and HPSOGWO were applied so as to optimize the random dataset. Along with that, Raw data is also taken into consideration. A comparative result is presented so as to comprehend the analysis. In the tables, light blue color indicates highest AUC for the specified ratio whereas dark blue color indicates the highest AUC for the classifier. Similarly, yellow color represents the highest accuracy of the ratio and peach color represents the highest accuracy of the classifier. For Cleveland, the highest accuracy for SVM was 0.83457 and highest AUC was 0.89635. For Radial Basis Kernel, highest accuracy was 0.90728 and highest AUC was 0.98277. For Gaussian Kernel, highest accuracy was 0.89781 and highest AUC was 0.89478. For KNN, 0.91391 was the highest recorded accuracy and 0.91154 was the highest recorded AUC. For Bayesian Network, 0.88457 was the highest accuracy and 0.8982 was the highest AUC. 0.96026 was the highest recorded accuracy for Random Forest classification and 0.99434 was the highest AUC.
5.2 Hungarian Output
Table4 shows the Hungarian results taken over Raw data, OGWO, GWO and, HPSOGWO optimization algorithms. Analyzed over the ratio of 90-10, 80-20, 70-30 and 60-40, the data is further classified using various classifiers like KNN, SVM, Radial Basis, Gaussian Kernel, Bayesian Kernel and Random Forest. Using SVM, 0.83673 was the highest accuracy noted for 90-10 ratio and 0.93165 was the highest AUC obtained at 90-10 ratio. Using Radial Basis Kernel, the highest accuracy and AUC noted were 0.93197 and 0.98284 respectively for 90-10 ratio. For Gaussian Kernel, again the peak values were observed at 90-10 ratio. The highest noted accuracy and AUC for Gaussian Kernel were 0.90986 and 0.89437 respectively. For KNN, highest accuracy was 0.93197 and AUC was 0.93858, found using HPSOGWO algorithm at 90-10 ratio. Similarly, for Bayesian and Random Forest classifier also, highest accuracy and AUC were observed at 90-10 ratio and HPSOGWO algorithm.
5.3 Switzerland Output
Table6 shows the Switzerland results. For different combination of dataset algorithms and testing-training ratios, different classifiers show different data of accuracy and AUC. For SVM classifier, the highest accuracy obtained was 0.93443 and AUC was 0.82895, both for HPSOGWO. For Radial Basis Kernel, 0.98361 was the highest accuracy and 0.97807 was the highest AUC, obtained for 90-10 ratio. Using Gaussian Kernel, highest accuracy was obtained for GWO and highest AUC was 0.73789 obtained for GWO. Using KNN, 0.98361 was the highest accuracy and 0.99561 was the highest AUC, both obtained for HPSOGWO at 90-10 ratio. Similarly, for Bayesian Network and Random forest also, highest accuracy and AUC were noted at 90-10 ratio.
Table 1 displays the summary of the Cleveland output using different classifiers and optimizers. For SVM and Gaussian Kernel classifiers, the best output was classified for GWO and HPSOGWO respectively. However, HPSOGWO was the best optimizer when evaluated using radial basis kernel as well as KNN. For Bayesian Network, best accuracy was noted for GWO and best AUC was noted for OGWO. For Random Forest, best accuracy was obtained for GWO.
Table 1: Result Analysis of Cleveland
|
Classifier |
Optimization Technique |
Ratio |
Accuracy |
AUC |
|
SVM |
GWO |
(06:04) |
0.83457 |
|
|
GWO |
(06:04) |
0.89635 |
||
|
Radial Basis Kernel |
HPSOGWO |
(09:01) |
0.90728 |
|
|
HPSOGWO |
(09:01) |
0.98277 |
||
|
Gaussian kernel |
OGWO |
(07:03) |
0.89781 |
|
|
OGWO |
(07:03) |
0.89478 |
||
|
K-Nearest Neighbor |
HPSOGWO |
(09:01) |
0.91391 |
|
|
HPSOGWO |
(09:01) |
0.91154 |
||
|
Bayesian Network |
GWO |
(06:04) |
0.88457 |
|
|
OGWO |
(09:01) |
0.8982 |
||
|
Random Forest |
GWO |
(09:01) |
0.96026 |
|
|
OGWO |
(09:01) |
0.99434 |
Table 2 indicates the output data for Hungarian. For three different classifiers viz., KNN, Bayesian and Random Forest, HPSOGWO was observed to be the most optimum algorithm as best AUC and accuracy were recorded for the same method. For SVM, OGWO displayed the best accuracy and GWO showed the best AUC. For Gaussian Kernel, best accuracy and AUC were both noted for HPSOGWO.
Table 2: Result Analysis for Hungarian
|
Classifier |
Optimization Technique |
Ratio |
Accuracy |
AUC |
|
SVM |
OGWO |
(09:01) |
0.83673 |
|
|
GWO |
(09:01) |
0.93165 |
||
|
Radial Basis Kernel |
OGWO |
(09:01) |
0.93197 |
|
|
HPSOGWO |
(09:01) |
0.98284 |
||
|
Gaussian kernel |
HPSOGWO |
(08:02) |
0.90986 |
|
|
HPSOGWO |
(08:02) |
0.89437 |
||
|
K-Nearest Neighbor |
HPSOGWO |
(09:01) |
0.93197 |
|
|
HPSOGWO |
(09:01) |
0.93858 |
||
|
Bayesian Network |
HPSOGWO |
(09:01) |
0.85714 |
|
|
HPSOGWO |
(09:01) |
0.92874 |
||
|
Random Forest |
HPSOGWO |
(09:01) |
0.91837 |
|
|
HPSOGWO |
(09:01) |
0.98163 |
As indicated in table 3, in the results of Switzerland HPSOGWO gave the best accuracy and AUC output in case of SVM, Radial Basis, KNN and Bayesian Network. While, for Random Forest, HPSOGWO gave the best accuracy and best AUC was noted for HPSOGWO. For Gaussian Kernel, GWO showed the best accuracy as well as AUC.
Table 3: Result Analysis of Switzerland
|
Classifier |
Optimization Technique |
Ratio |
Accuracy |
AUC |
|
SVM |
HPSOGWO |
(09:01) |
0.93443 |
|
|
HPSOGWO |
(06:04) |
0.82895 |
||
|
Radial Basis Kernel |
HPSOGWO |
(09:01) |
0.98361 |
|
|
HPSOGWO |
(09:01) |
0.97807 |
||
|
Gaussian kernel |
GWO |
(09:01) |
0.93443 |
|
|
GWO |
(07:03) |
0.73789 |
||
|
K-Nearest Neighbor |
HPSOGWO |
(09:01) |
0.98361 |
|
|
HPSOGWO |
(09:01) |
0.99561 |
||
|
Bayesian Network |
HPSOGWO |
(09:01) |
0.93443 |
|
|
OGWO |
(09:01) |
0.83333 |
||
|
Random Forest |
HPSOGWO |
(09:01) |
0.99861 |
|
|
HPSOGWO |
(09:01) |
0.95175 |
Table 1 in the attached supplementary file shows detailed results for Cleveland output data. Parameters like sensitivity, specificity, accuracy, PPV, NPV, FPR, FNR, FDR, AUC, precision and recall are calculated for different 60-40 and 70-30 testing-training ratios and different classifiers. The highest of the table highlighted with different colors. Similarly, analysis is done for 90-10 and 80-20 ratio.
Table 3 in the supplementary shows the comprehensive output for Hungarian data at 06:04 and 07:03 ratio. The analysis is done on various parameters like specificity, sensitivity, accuracy, AUC, PPV, NPV, FPR, FNR, precision and recall. Highest accuracy and AUC are highlighted in the table. Similar analysis is done for 08:02 and 09:01 ratio.
Table 5 in the attached supplementary file displays the detailed analysis of Switzerland data for different training-testing ratios. The analysis is done on the basis of parameters like specificity, sensitivity, precision, recall, AUC, accuracy, FDR, FNR, PPV and NPV. The analysis is done for five different classifiers and three optimizers along with an evaluation without any feature selection technique. For each ratio, highest accuracy and AUC are marked with yellow and blue colors respectively.
6. Discussion
Figure 1 indicates the graphical analysis of Cleveland data. Taken over different training-testing ratio, the graph displays the best optimization technique for different ratios. As shown in the graph, we got highest accuracy 0.96026 using Random Forest with the Grey Wolf Optimizer with the ratio of 90-10. In the same way for AUC, we got highest AUC 0.99434 using Random Forest with Oppositional Learning based Grey Wolf Optimizer with the same ratio of 90-10.
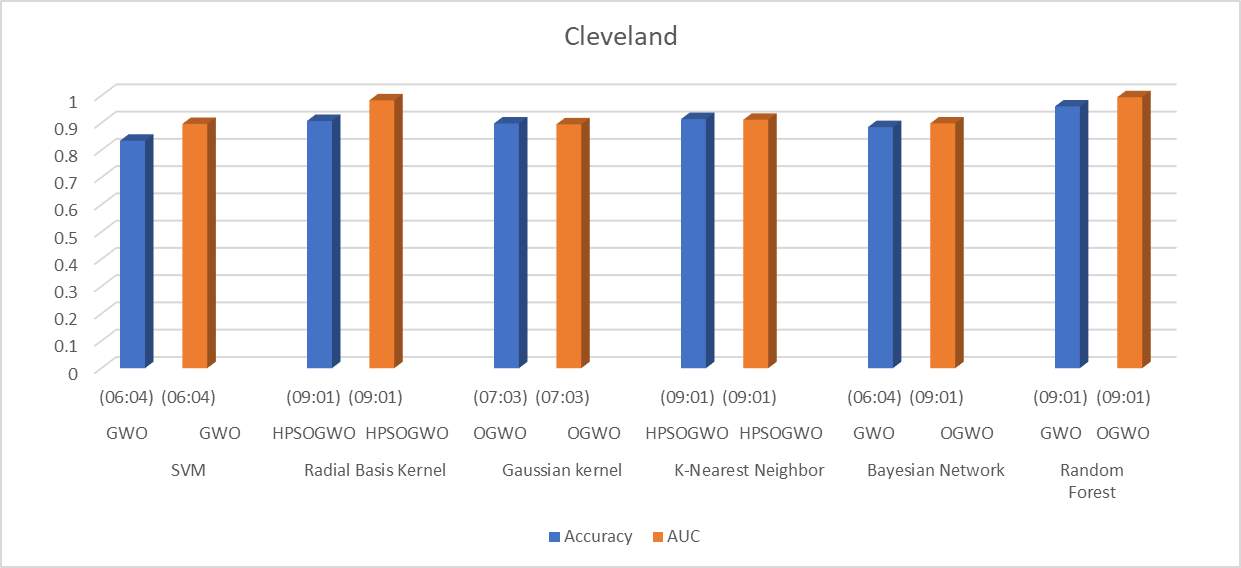
Figure 1: Graphical Analysis if Cleveland Data
Figure 2 represents the graph of Hungarian data. The graph represents the best accuracy and AUC values for different training-testing ratios and various optimization algorithms. In the dataset of Hungarian, the highest accuracy we got is 0.93197 using KNN classifier and HPSOGWO optimization technique with the ratio of 90-10. For AUC, we got highest AUC 0.98284 using Radial Basis Kernel classifier and HPSOGWO technique with the ratio of 90-10.
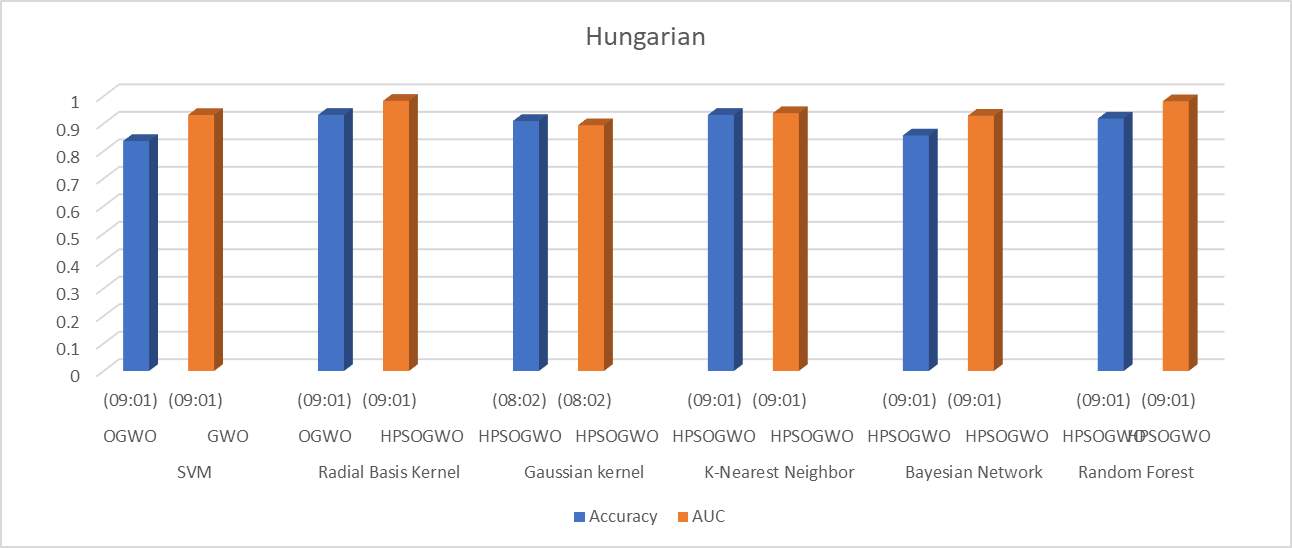
Figure 2: Graphical Analysis of Hungarian Data
Figure 3 shows the graph plotted for best accuracy and AUC of Switzerland data. The analysis is done for the datasets of various training-testing ratios. In Switzerland dataset, the highest accuracy 0.99861 is achieved using Random Forest classifier and HPSOGWO optimization technique with the ratio 90-10. For AUC, the highest AUC 0.99561 is achieved using KNN classifier and HPSOGWO optimization technique with the ratio of 90-10.
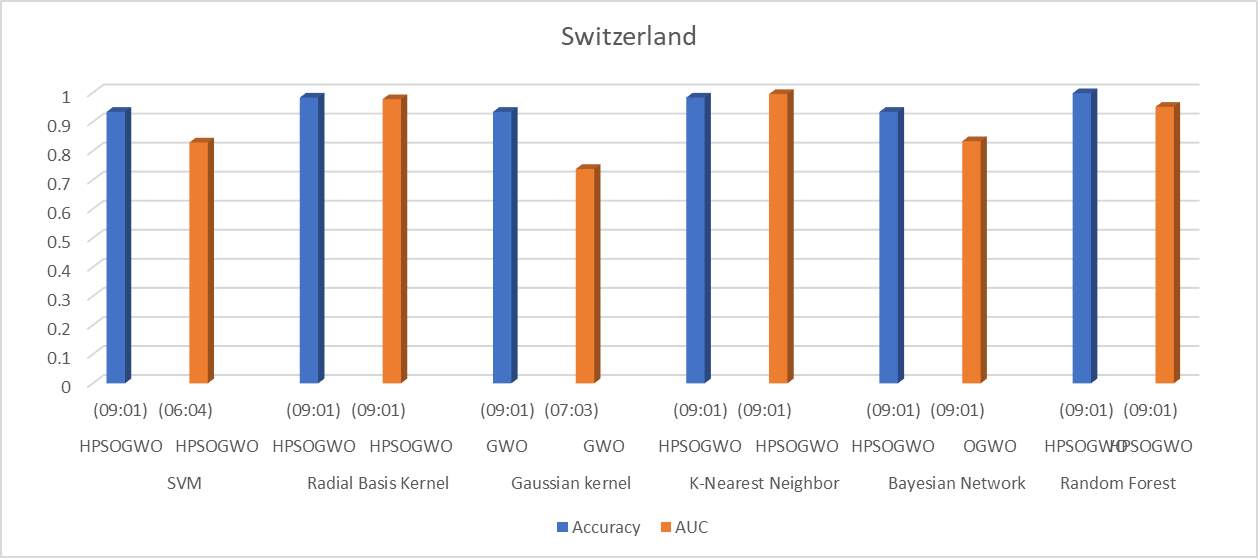
Figure 3: Switzerland Data Analysis
Figure 4 is the brief of the entire research work presented in this paper. The accuracy for all the three data sets have been taken into consideration and the best of all has been presented in the form of pie chart below.
The selected data that is referred data for plotting the pie chart has been mentioned in table 4. The table reflects the highest values of accuracy for each optimization technique, taking classifiers and ratios into consideration. From all the above research, it is seen that the dataset of Switzerland is accurate among all the dataset with the highest accuracy of 0.99861 using Random Forest classifier and HPSOGWO and optimization technique with the ratio of 90-10.
Table 4: Combined Data
|
Optimization Technique |
Accuracy |
|
GWO/Random Forest – Cleveland (09:01) |
0.96026 |
|
HPSOGWO/K-Nearest Neighbor – Hungarian (09:01) |
0.93197 |
|
HPSOGWO/Random Forest – Switzerland (09:01) |
0.99861 |
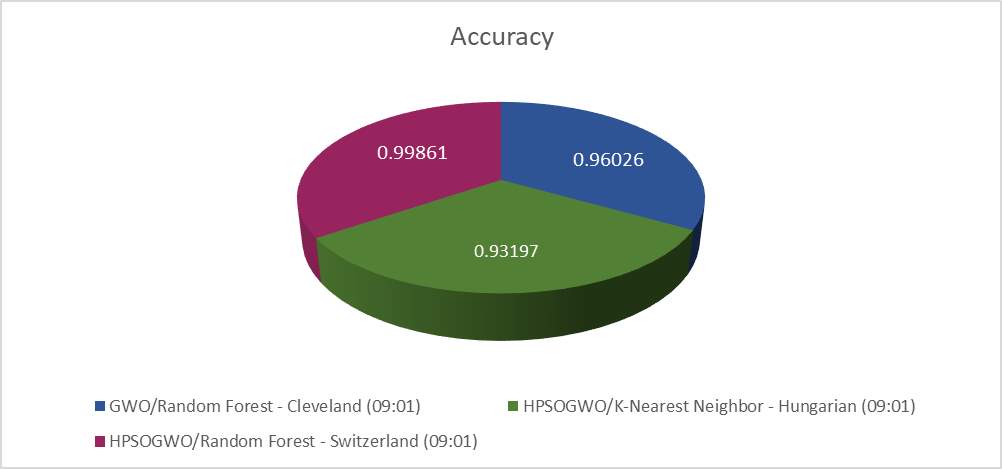
Figure 4: Combined Results Analysis Chart
7. Conclusion:
From the result table of each algorithm and each technique, it is evident that any single classification technique or optimizer cannot be picked up as the best one for a particular dataset. Different combinations of testing-training ratios have different effect of optimization techniques. Also, raw data was recorded to show the best accuracy and AUC in many cases. However, in quite a large number of cases, PSO when hybridized with GWO gave impressive results. Thus, instead of applying any individual optimization technique if hybrid technique like HPSOGWO is used, output is much more efficient. Again, this is not the only criterion that serves the outcome. Classifiers also play a major role in generating the results.
8. Electronic Supplementary Material:
- Table1.xlsxTable contains additional information about Cleveland Dataset for ratio 09:01, 08:02, 07:03 and 06:04.
- Table2.xlsx Table contains additional information about Cleveland Dataset for highest Accuracy and AUC.
- Table3.xlsx Table contains additional information about Hungarian Dataset for ratio 09:01, 08:02, 07:03 and 06:04.
- Table4.xlsx Table contains additional information about Hungarian Dataset for highest Accuracy and AUC.
- Table5.xlsx Table contains additional information about Switzerland Dataset for ratio 09:01, 08:02, 07:03 and 06:04.
- Table6.xlsx Table contains additional information about Switzerland Dataset for highest Accuracy and AUC.
References
[1] E.Bonabeau, M. Dorigo, and G. Theraulaz, Swarm intelligence: from natural to artificial systems: OUP USA, 1999.
[2] M. Dorigo, M. Birattari, and T. Stutzle, “Ant colony optimization,” Computational Intelligence Magazine, IEEE, vol. 1, pp. 28-39, 2006.
[3] J. Kennedy and R. Eberhart, “Particle swarm optimization,” in Neural Networks, 1995. Proceedings., IEEE International Conference on, 1995, pp. 1942-1948.
[4] D. H. Wolpert and W. G. Macready, “No free lunch theorems for optimization,” Evolutionary Computation, IEEE Transactions on, vol. 1, pp. 67-82, 1997.
[5] S. Kirkpatrick, D. G. Jr., and M. P. Vecchi, “Optimization by simulated annealing,” science, vol. 220, pp. 671-680, 1983.
[6] G. Beni and J. Wang, “Swarm intelligence in cellular robotic systems,” in Robots and Biological Systems: Towards a New Bionics?, ed: Springer, 1993, pp. 703-712.
[7] B. Basturk and D. Karaboga, “An artificial bee colony (ABC) algorithm for numeric function optimization,” in IEEE swarm intelligence symposium, 2006, pp. 12-14.
[8] O. Olorunda and A. P. Engelbrecht, “Measuring exploration/exploitation in particle swarms using swarm diversity,” in Evolutionary Computation, 2008. CEC 2008. (IEEE World Congress on Computational Intelligence). IEEE Congress on, 2008, pp. 1128-1134.
[9] E. Alba and B. Dorronsoro, “The exploration/exploitation tradeoff in dynamic cellular genetic algorithms,” Evolutionary Computation, IEEE Transactions on, vol. 9, pp. 126-142, 2005.
[10] S.Mirjalili, S. M. Mirjalili, A. Lewis, “Grey Wolf Optimizer”, Advances in Engineering Software, vol. 69, pp. 46-61, 2014, DOI: http://dx.doi.org/10.1016/j.advengsoft.2013.12.007
[11] S. Narinder and S. B. Singh, “Hybrid Algorithm of Particle Swarm Optimization and Grey Wolf Optimizer for Improving Convergence Performance”, Journal of Applied Mathematics, vol. 2017, pp. 1-15, 2017.
[12] K.Chandrasekhar, D.Raghunath Kumar Babu, D.Mahendra Reddy and A.Naresh, “Classifying Heart Disease Dataset using Machine Learning”, vol. 06, International Research Journal of Computer Science (IRJCS), IRJCS/RS/Vol.06/Issue05/MYCS10080.
[13] Ebrahim Edriss Ebrahim Ali, Wu Zhi Feng, “Breast Cancer Classification using Support Vector Machine and Neural Network”, International Journal of Science and Research (IJSR), ISSN (Online): 2319-7064
[14] Qun Chang Qingcai Chen Xiaolong Wang, “Scaling Gaussian RBF kernel width to improve SVM classification” ITNLP Lab, School of Computer Science and Technology, Harbin Institute of Technology, Harbin, 150001, China.
[15] Ms. Hetal Bhavsar, Dr. Amit Ganatra, “Radial Basis Polynomial Kernel (RBPK): A Generalized Kernel for Support Vector Machine”, International Journal of Computer Science and Information Security (IJCSIS), Vol. 14, No. 4, April 2018.
[16] Vasileios Apostolidis-Afentoulis, Konstantina-Ina Lioufi, “SVM Classification with Linear and RBF Kernels.
[17] Raul Eulogio, “Introduction to Random Forest”, 12.08.17.
[18] Jason Brownlee, “K-Nearest Neighbors for Machine Learning”, April 15, 2016.
[19] Onel Harrison, “Machine Learning Basics with the K-Nearest Neighbors Algorithm”, Sep 10, 2018.
[20] Prashant Gupta, “Naïve Bayes in Machine Learning”, Nov 6, 2017.
[21] Jason Brownlee, “Naïve Bayes for Machine Learning”, April 11, 2016.
[22] Abdolreza Hatamlou, “Black hole: A new heuristic optimization approach for data clustering”, vol. 222, pp. 175-184, 10 February 2013.
Cite This Work
To export a reference to this article please select a referencing stye below:
Related Services
View all


DMCA / Removal Request
If you are the original writer of this essay and no longer wish to have your work published on UKEssays.com then please click the following link to email our support team:
Request essay removal