Wheat Germ Acid Phosphatase Catalysed Hydrolysis of Para-Nitrophenyl Phosphate
| ✅ Paper Type: Free Essay | ✅ Subject: Chemistry |
| ✅ Wordcount: 2568 words | ✅ Published: 23 Sep 2019 |
Received 30th January 2019,
- marineh@uoregon.edu.
- Patrick.fajardo17@gmail.com.
Accepted 7th Febru 2019
Wheat Germ Acid Phosphatase Catalysed Hydrolysis of Para-Nitrophenyl Phosphate: Michaelis Menten Constant and Maximum Reaction Velocity
Marine Hall-Poirier,*a Patrick Fajardo b
Abstract: A range of different para-nitrophenol phosphatase concentration (0.5-5.0 mM) were reacted with wheat germ acid phophatase at a pH of 4.8 over 0, 10, 20 and 40 minute intervals. Measuring absorbance at different times and concentrations the reaction rate as fucntion of concentraion were plotted using the Michealis-Menten and Lineweaver-Burke fit to find the maximum reaction velocity and Michaelis constant coefficients. The optimum pH of the reaction rate were analyzed to see its effect on the efficiency of the reaction paying close attention to pH values around 4.5 to 5.5.

Figure 1: Para-nitrophenyl phosphate and water reacts with the enzyme, acid phosphatase, to produce an intermediate product of para-nitrophenol and phosphate. The reaction is then quenched with NaOH to stop the reaction from proceeding.
An enzyme is a necessary substance produced by living organisms whose primary function is to increase the rate of a reaction. Understanding the kinetics of enzymes can serve a wide array of uses including, the production of sweetening agents1, pharmacological sciences1, and are used regularly in our bodies to catalyze reactions. For instance, a single molecule of carbonic anhydrase, found in red blood cells, can catalyse the conversion of more than half a million molecules of carbon dioxide and water (substrates), into bicarbonate (product) ions. Bicarbonate ions coupled with protons are what regulate the pH levels of your blood creating an environment in which your cells can live1,2.
The purpose being to determine the maximum reaction velocity (
and the Michaelis constant (
by observing the kinetics of the reaction using the Michaelis-Menten equation, as shown below:
(1) 
In the above equation, ‘E’ represents the enzyme concentration, ‘S’ represents the substrate concentration, ‘E
S’ represents the bonded enzyme substrate concentration intermediate, and ‘P’ represents the product. The rates of the reactions are characterized by the following rate constants
and
. Assuming that the
is equal to k2 and
are almost equal, we are assuming a steady state approximation, which means the enzyme substrate complex ‘E
S’ has a net production of near zero. This would mean that the Michaelis constant and maximum reaction velocity can be defined with [E
being the total amount of enzyme and it follow these two equations which will be later used to fit the data:
The reaction velocity is described by the Michealis Menten equation, which can be linearized to Lineweaver-Burke equation:
In this experiment we reacted varying amounts of the substrate (para-nitrophenophosphate) with an enzyme (NPP) and quenched (NaOH) the reaction at various time intervals giving us our final product (para-nitrophenolate). We then were able to determine the absorbance of the resulting solution and using Beer’s law (
) we plotted the concentration of the product at 0, 10, 20 and 40 minutes. By fitting the plot, we found the Michaelis constant aiding in the understanding of enzyme function. The maximum velocity is found once all active sites on the enzyme are filled by the substrate, this will vary based on concentrations of substrate. This will result in a plot that is increasing in velocity until all active sites are filled and it which points it will begin to plateau. The point at which the reactions velocity levels off is defined as the
. The Michaelis constant is the concentration of the enzyme at half the maximum velocity. This constant indicates the affinity that the enzyme and substrate have for each other; an enzyme with high Km indicates that enzyme needs more substrate to react. While a low Km value indicates that the enzyme and substrate react readily with each other to produce the product and that very little of the substrate is needed to fill the enzyme active sites. We would expect the enzyme to have a high affinity for the substrate, therefore a low Km value.

Figure 2: Experimental setup of the test tubes with their respective concentrations. A tubes are 0 mins, B tubes are 10 mins, C tubes are 20 mins and D tubes are 40 mins.
To determine the rate of the reaction of NPP to phosphaphenol and phosphate, we followed the experimental procedure reproduced in figure 2. Five test tubes with varying concentrations of substrate (NPP) were added to a solution of 2mL of buffer (0.10M sodium citrate), and changeable amount of water, giving us a total volume 4.5mL. The test tubes, 1-5, were then placed in a water bath set to
and allowed to equilibrate, this took approximately 10-15 minutes. To begin the reaction, 0.50 mL of enzyme (0.12mg crude wheat germ phosphatase per mL Triton X-100) were added to the solution. The same procedure was followed for each test tube, but were done with a two minute interval in between for convenience. Test tube 1 was immediately swirled after the addition of the enzyme and the timer was set and allowed to run the entirety of the experiment. 1mL of aliquot was removed from test tube 1 using a micropipette and quenched in a test tube with 5mL of NaOH (0.10M). Test tube 1A (0 Min), followed by 2A, 3A, 4A and 5A and then again by 1B until all tubes were quenched and had an aliquot. We observed that the initial concentration of the substrate is proportional to how strong the yellow colour of the quenched solution appears. After all test tubes were quenched at their respective times, we were able to determine the absorbance of each. Using the Shimadzu BioSpec-1601 UV vis spectrometer to find the UV spectrum between 300 and 500nm. The program UVProbe was used to collect the data and samples were placed in 1cm cuvettes using NaOH as a reference sample. As seen in figure 3 there are two main peaks, the peak around 300-325 nm is the NPP substrate (starting material) and the peak around 400 nm is the para-nitrophenolate (product). Figure 3 a-c show the spectra for test tubes 1,2, and 3 and prominent trend seems to arise. As the reaction time proceeds, the absorbance of the product increases as the starting material peak decreases. Looking at figure 3a with 0.5mM of NPP to 3b or even 3c with 1.0mM and 1.5mM of NPP respectively, the higher the concentration of substrate results in a higher absorbance. Looking at the absorbance peaks for 3a compared to 3c we can see that there is a higher value of absorbance as NPP concentrations increase. 3a has an absorbance peak of the product at 0.79×10⁻³ while 3b and 3c have much higher values at 0.12 and 0.14.
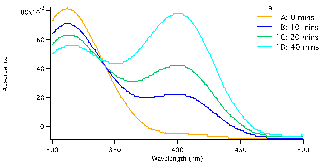
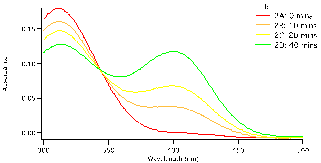
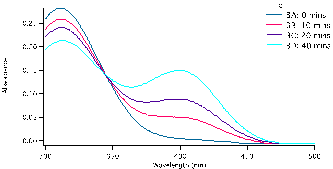
Figure 3: Absorbance versus wavelength (nm) for reaction tubes 1(a) with a substrate concentration of 0.5 mM of substrate, 2(b) concentration of 1.0mM, and 3(c) concentration of 1.5mM. For each graph it represents 4 different trials, but at varying concentration by graph.
Once the absorbance at 400nm were found the concentrations of each were calculated using Beer’s Law:
‘e’ being the extinction coefficient for para-nitrophenol, 17900
3 ,and the length, ‘l’, of the cuvette is 1 cm. The relationship of product concentration over reaction time is illustrated in figure 4. It shows that the concentration of the product increases whilst the concentration of the substrate decreases as seen with absorbance in figure 3. The trials were all fit to a linear model, ax+b, where the slope,’a’, represents the reactions rates for each concentration. In the table below, table 1, the fit parameters are defined for each concentration tubes 1-5 with error.
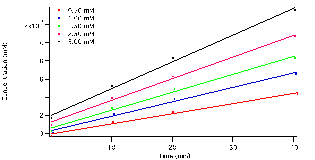
Figure 4: Concentration versus time linearly fit: ax+b.’ a’ represents the reaction rate for the specified substrate concentration represented in legend.
Table 1: The fit parameters and error for figure 4.
|
Tube # |
Slope (mM/min) |
λ |
Intercept a (mM) |
λ |
|
1 |
1.1×10⁻⁴ |
7.9×10⁻⁶ |
-9.33×10⁻⁵ |
0.0002 |
|
2 |
1.6×10⁻⁴ |
1.1×10⁻⁵ |
2.7×10⁻⁴ |
0.0003 |
|
3 |
2.0×10⁻⁴ |
1.4×10⁻⁵ |
5.3×10⁻⁴ |
0.0003 |
|
4 |
2.4×10⁻⁴ |
1.1×10⁻⁵ |
1.2×10⁻³ |
0.0003 |
|
5 |
3.0×10⁻⁴ |
1.4×10⁻⁵ |
2.0×10⁻³ |
0.0003 |
From the data the slopes, the reaction rate, are seen to increase with higher initial concentrations of substrate. Meaning that with more substrate present the enzyme active sites will be filled more frequently.
Using the reaction velocities (slopes), seen in table 1. and the initial concentrations of the substrates we plotted the data using the Michaelis-Menten equation (4) to determine how substrate concentration affect the rate of the reaction. Figure 5 is a plot of the reaction velocities versus the initial substrate concentrations fitted to the Michaelis-Menten equation (4). From the fit we found vM and KM, values given in table 2. The hyperbolic fit illustrate that there is a limit, at this point the enzymes are said to be saturated and the reaction plateaus. The value at which it plateaus is the vm, 3.7×10⁻⁴
1.1×10⁻⁵mM/min. The reaction cannot be catalysed any further because all active sites have been filled with the respective concentrations of substrate. The Michaelis-Menten. KM, constant is represented by half the value of vm,. The smaller the KM constant is the less substrate (NPP) needed to reach maximum reaction velocity. We found this value to be 1.2
0.1 mM.
The data was then linearized by fitting the same data listed in table 1 to the Lineweaver-Burke equation (5). Initially, the data didn’t fit correctly. Therefore, the data was then fit to a line and slope and intercept were used to determined the
and
values. Those values were then set as the initial guesses for the Lineweaver-Burke equation (5) to get the fit seen in figure 6.
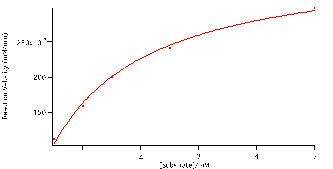
Figure 5:Reaction velocity versus substrate concentration fitted to the Michaelis-Menten equation: (V)*(S)/(S+M). Coefficients
one standard deviation:
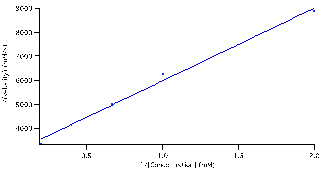
Figure 6: 1/(reaction velocities) versus 1/ substrate concentration fitted to the Lineweaver-Burke equation: (M/V)*(S)+(1/V). Parameters
one standard deviation:
.
Table 2: Constants from the Michaelis-Menten and Lineweaver-burke equations with error.
|
Michaelis-Menten |
Lineweaver-Burke |
|||
|
Point |
λ |
Point |
λ |
|
|
(mM/min) |
3.7×10⁻⁴ |
1.1×10⁻⁵ |
3.4×10⁻⁴ |
1.8×10⁻⁵ |
|
|
1.2 |
0.1 |
1.02 |
0.1 |
|
|
1.8 |
0.05 |
1.6 |
0.1 |
The k2 value was calculated using the following equation to:
Using this equation and the enzyme concentration, 2.029×10⁻⁷mM3, we calculated that the k2 value for the Michaelis-Menten was 1.8
0.05 and for Lineweaver-Burke it was 1.6
0.1. Table 2 depicts all the coefficients found using Michaelis-Menten and Lineweaver-Burke fit methods, with error. Looking at the values for vm, KM and k2 from the two methods the values for each (vm, KM and k2 )are essentially the same when taking error into account. Meaning that they are in agreement and are accurate models for the data collected.
Since the coefficients from the data collected fit both the Michaelis-Menten and Lineweaver-Burke models, we can examine other factors that could affect the reaction rate. For instance, there has been research into the determination of optimal enzymatic activity based on pH levels. Based on literature values the optimal pH of the reaction between wheat germ acid phosphatase and para-nitrophenylphosphate is approximately 5.04. In a separate experiments a series of reactions were run at different pH environments to find out at which pH the wheat germ acid phosphatase catalysed the hydrolysis of NPP with the most efficiency. The range of efficiency is centered around pH of 4.5 to 5.5. In figure 3, it depicts the data produced by Moyer and Tekin and a separate group Joyce and Grisolia versus the experimental results from this lab. It is clear that they do not all line up however, versus the data produced by Joyce and Grisolia the data lines up quite well. The difference between the two source, including the reaction velocity that we collected, differ by nearly a factor of 10. Moyer and Tekin attribute this difference in Joyce and Grisolia’s research to not only measuring NPP as a substrate, but rather they measured a range of different substrates. They did this to be able to determine the enzymatic activity with respect to the substrate4,5.
Table 3: The effect of pH on the the reaction velocity4,5
|
pH |
Moyer and Tekin |
Joyce and Grisolia |
|
4 |
0.022 |
0.025 |
|
4.8* |
– |
0.37* |
|
5 |
0.032 |
0.55 |
|
6 |
0.025 |
0.64 |
|
7 8 |
0.005 0.00015 |
0.4 0.12 |
As pH increases the enzymatic activity goes up to a point and then starts to decrease. It was observed that there is a greater delta change in the values descending from the ideal pH than leading up the ideal pH conditions. This could be due to a number of factors including how the experiment was run, what substrates were used or how the reaction was quenched. Between Moyer and Tekin and Joyce and Grisolia different substrates were used to determine the reaction velocities. Moyer and Tekin only conducted their experiments with p-NPP substrate, similar to what we did, but Joyce and Grisolia looked at several different substrates to determine the best enzymatic activity with respect to the substrate. Looking at the how the reactions were quenched could also be a factor in understanding why there was such a big difference in values. It is unclear how Joyce and Grisolia quenched their reaction, however, Moyer and Tekin conducted their experiment twice with different quenching procedures. The first one didn’t include 10.0mM molybate and the second one did. The use of molybate greatly effected the reaction velocity. Since the molybate works in competition with the enzyme, it ultimately effects the conditions at which the enzymatic activity is at its highest activity. It can also have an impact on the Michaelis Menten constant. Ultimately, when analysing the effects of pH and substrates used concurrently with the enzyme there is greater effect the reaction rate will go down then what was seen in the lab that we conducted. As pH increases reaction rates reach a point that is optimal and then decrease rapidly.
Notes and references
[1] P. Robinson, Essays Biochem 2015, vol. 59, pg.75
[2] M.Haasch, Marquette University Center for BioMoledcular Modeling,NIH, 2008
[3] Lab Manual.
[4] J. Moyer, M. Tekin, Bloomsburg University.
[5] B. Joyce, S. Grisolia, The Journal of Biological Chemistry 1960, vol235,No.8, pg.2276-2281
Cite This Work
To export a reference to this article please select a referencing stye below:
Related Services
View all


DMCA / Removal Request
If you are the original writer of this essay and no longer wish to have your work published on UKEssays.com then please click the following link to email our support team:
Request essay removal