Vapour Pressure as a Function of Temperature of Ether
| ✅ Paper Type: Free Essay | ✅ Subject: Chemistry |
| ✅ Wordcount: 2984 words | ✅ Published: 22 Jan 2018 |
- Xin Wang
Title
To measure the enthalpy of vaporization and the boiling point of diethyl ether by cooling the ether down and continuously recording a series of different temperature readings and their corresponding vapour pressure values.
Abstract
Vapour pressure p of ether under a series of different temperatures T were measured and three repeats were done. The three graphs of ln(p) against 1/T were plotted, all of them showed a nice linear relationship between ln(p) and 1/T . Then the gradient which was equal to ï²Hvap/R was used, and hence the average value of ï²Hvap of three repeats was decided as the final result . The boiling point was calculated by using ï²Hvap and the final value used of constant C was also the mean of three repeats’ constants obtained. Error analysis and improvements both focused on the leaking of apparatus and the validities of measurements obtained.
Introduction
Thermodynamics is a very important part of chemistry and chemical studies. It involves many studies about energy such as the transfer of energy and the conservation of energy. For this experiment which is to study the vapor pressure as a function of temperature, the thermodynamic part which should be focused on is that a system would tends to make its Gibbs Free Energy which is the energy free to do work minimum at a constant temperature and pressure.
In this experiment, a single and pure compound is used and the study is about the equilibrium between its liquid phase and its gaseous phase at a constant pressure and temperature. If the pure compound liquid is placed inside a closed container, under different temperature and different pressure, there will always be a equilibrium between the liquid phase and gaseous phase. This thermodynamic equilibrium will be at different position due to the temperature and pressure Therefore, the region of the temperature and pressure where the compound changes from liquid to gases or reversibly has been defined as phase boundaries, which can be found in a graph of pressure against temperature. To be more specific, the temperature is the temperature of the system, but the pressure mentioned is the vapour pressure. The vapour pressure is defined as the pressure of the vapour which is in equilibrium with its liquid in the closed container, and it does vary with the temperature.
According to the second law of thermodynamics which indicates “At equilibrium, the chemical potential of a substance is the same throughout a sample, regardless of how many phases are present.” [1] , a equation for the two chemical potentials of two phases can be obtained, which shows the chemical potential of the liquid is equal to the chemical potential of the gases in equilibrium in the closed container.
To make this simpler, the chemical potential “µ” which is the molar Gibbs free energy [1] is introduced. Therefore, at a constant pressure and temperature, µ is equal to the first derivative of G with respect to n, where G is the Gibbs free energy and n is the number of moles.
As phase boundary is represented by the line which separates the liquid phase region and gaseous phase region in a graph of vapour pressure against temperature, therefore the gradient of the phase boundary which is written as dp/dT can be considered. In the closed container, the overall chemical potential of the system is always constant by considering conservation of energy. Therefore, the change in µ of liquid phase should always be equal to the change in µ of gaseous phase when temperature and pressure change, which can be expressed as dµ(liquid) = dµ(gases)[1].
The fundamental equation “dU = TdS – PdV” [2] can be used to derive another equation of dµ. Because of H = U + pV [3], therefore dH = dU + d(pV) = dU + pdV + Vdp is derived. As known, G = H -TS and then dG = dH – d(TS) = dH – TdS – SdT is obtained. By combining the two derived equations and the fundamental equation mentioned above, dG = -SdT + Vdp can then be obtained finally. Due to the definition of µ, equation dµ = -SdT + Vdp can be derived.
If dµ = -SdT + Vdp is substituted into dµ(liquid) = dµ(gases), [V(gases) – V(liquid)]dp = [S(gases) – S(liquid)]dT can be derived. Therefore, dp/dT = ï²S/ï²T where ï²S is defined as the the entropy of phase transition which can be equal to S(gases) – S(liquid) and ï²T is defined as the volumes of phase transition which can be equal to V(gases) – V(liquid).
Due to the perfect gas law which is pV = nTR, where R is the gas constant which is equal to 8.314 J K-1 mol-1 and T is the temperature in kelvins. For µ which is molar, therefore n = 1 and then pV = RT, so V = RT/p is obtained for gases. The assumption that ï²V = V(gases) – V(liquid) ≈ V(gases) [2] can be made as the volume of liquid in the closed system is much smaller than the volume of gases, and hence ï²V = RT/p can be derived. For ï²S, as ï²Hvap = Tï²S can be derived due to the equilibrium, so ï²S = ï²Hvap /T is then derived. By substituting the two new equations for ï²S and ï²T into dp/dT = ï²S/ï²T, dp/dT = pï²Hvap /RT2 can be obtained. Then do the integration for the equation dp/dT = pï²Hvap /RT2 , ln(p) = -ï²Hvap/RT + C can be derived, where C is a constant.
For the equation ln(p) = -ï²Hvap/RT + C, a graph of ln(p) against 1/T can be plotted to find ï²Hvap which is the enthalpy of vaporization can obtained from the gradient of the graph due to the linear relationship between ln(p) and 1/T. Therefore, ï²Hvap = -gradient × R
To use the equation to find the boiling point of the compound used, due to the definition of boiling point, just substitute pressure = 1 atmosphere ≈ 1 bar into the equation to find the corresponding T which is therefore the boiling point. Therefore, ln(1) = 0 = -ï²Hvap/RTboil + C, and hence Tboil = ï²Hvap/RC can be used for calculation.
Equipment
Methylated spirits, cardice, ether(diethyl ether), tweezers, a large dewar flask, a smaller dewar flask, wasted dewar flasks, clamps, experimental vacuum set-up with air pump connected, stopwatch, electrical mixer, thermometers, funnels, beakers
Experiment
Turned on the digital vacuum gauge and then took down the bulb A from the apparatus set, some ether was added into the bulb and then the bulb was reconnected to the apparatus. Next, prepared methylated spirits was added to a large dewar, then enough cardice was transferred from the the main container into a small container and added to the dewar with methylated spirits by using a tweezer. Enough cardice was added to make the methylated spirits reach a very low temperature which was about -78℃. After the temperature of the methylated spirits was low enough, some of the mixture was poured into a smaller dewar and then the cold trap was submerged by the mixture in the smaller dewar which was clamped and therefore fixed to continuously cold the cold trap. Then the air pump was turned on, the Tap 1 which was vacuum to Ether in the bulb A and the Tap 3 which was vacuum to Atmosphere were both closed while the Tap 2 which was vacuum to Transducer was open. After the cold trap was cold enough, open Tap 1 to boil the ether for seconds to make sure all the air inside those tubes were pumped out, and then closed Tap 1 and measure the rate of leaking by closing Tap 2 as well and then measuring the amount of pressure increased by looking at the digital vacuum gauge in one minute by using a stopwatch. The thermometer and the electrical mixer were well setted up around the bulb A as a thermostat bath, then submerged the bulb A with ether inside into the remaining mixture in the large dewar and clamped the large dewar to make it fixed. Then continuously add cardice into the large dewar and the smaller dewar to cool down the ether and keep the cold trap still cold. When the temperature of the mixture in the large dewar reached about -78℃, the large dewar was removed and Tap 2 was closed with Tap 1 open. The mixture in the large dewar was the pored into a wasted dewar and then the dewar was allowed to warm up. Then the ether in the bulb A was allowed to warm up to room temperature and cold tap water in a beaker was used to submerge the bulb A to help warm up. After a enough long time was used for warming up, the thermometer was touched to the bulb A to measure the temperature of the ether at room temperature and this temperature reading and the corresponding pressure reading were both recorded as the first pair of data. The empty large dewar had also been warmed up already, fresh methylated spirits was then added to the dewar and the bulb A was submerged into the fresh mixture with the thermostat bath set also submerged in the mixture. The thermostat bath was started by turning on the electrical mixer, at the same time, Tap 3 and Tap 2 were still closed while Tap 1 was open. For obtaining data sets, a small amount of cardice was added each time to make sure the temperature only went down by 2 to 3 degrees or kelvins. The temperature reading and its corresponding pressure reading were both recorded after adding the cardice and waiting for both reading to be steady. The experiment was finished until the temperature had reached about -55 degrees . After finishing the experiment, the electrical mixer was then turned off and the Tap 1 and the Tap 2 were closed but the Tap 3 was then opened. The air pump was switched off after that. Next, both the large dewar and the smaller dewar were removed, and the methylated mixture in both dewars were poured back into the the container of methylated spirits using a funnel.
The experiment had been repeated for three times and therefore three data sets were obtained. And all the repeats were done by using the same apparatus under the same condition.
Results
During the experiments, the raw data recorded for temperature was in degree and pressure was in mbar. See Table 1. For 1/T, Temperature was changed into the unit of kelvin. For ln(p), pressure was changed into the unit of bar. See Appendix A, Appendix B and Appendix C.
|
Run 1 |
Run 2 |
Run 3 |
|||
|
T /degrees |
p /mbar |
T /degrees |
p /mbar |
T /degrees |
p /mbar |
|
15 |
661 |
8 |
511 |
14 |
582 |
|
9 |
547 |
5 |
448 |
4 |
432 |
|
7 |
476 |
3 |
393 |
1 |
385 |
|
4 |
424 |
-1 |
342 |
-2 |
316 |
|
2 |
378 |
-4 |
296 |
-6 |
268 |
|
-2 |
330 |
-7 |
253 |
-10 |
216 |
|
-4 |
291 |
-12 |
205 |
-14 |
182 |
|
-7 |
250 |
-15 |
174 |
-18 |
150 |
|
-10 |
220 |
-18 |
150 |
-21 |
126 |
|
-12 |
193 |
-21 |
132 |
-25 |
102 |
|
-14 |
175 |
-25 |
105 |
-27 |
91 |
|
-17 |
155 |
-31 |
80 |
-31 |
73 |
|
-20 |
132 |
-34 |
66 |
-35 |
59 |
|
-22 |
116 |
-37 |
53 |
-38 |
46 |
|
-26 |
95 |
-41 |
43 |
-42 |
37 |
|
-29 |
80 |
-44 |
38 |
-45 |
30 |
|
-33 |
65 |
-47 |
32 |
-48 |
26 |
|
-36 |
53 |
-51 |
26 |
-50 |
22 |
|
-40 |
41 |
-55 |
23 |
-52 |
20 |
|
-42 |
35 |
-60 |
18 |
-57 |
15 |
|
-44 |
32 |
-59 |
13 |
||
|
-48 |
25 |
-62 |
11 |
||
|
-52 |
20 |
||||
|
-54 |
17 |
||||
|
-56 |
14 |
||||
|
-59 |
12 |
Table 1. Raw data from the experiments
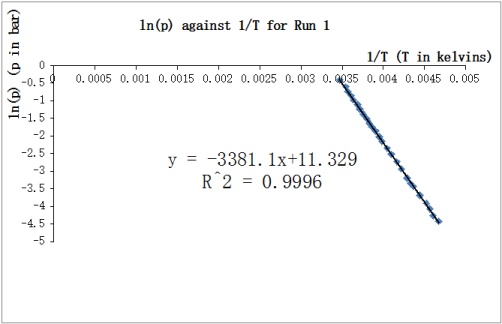
Figure 1. ln(p) against 1/T for Run 1
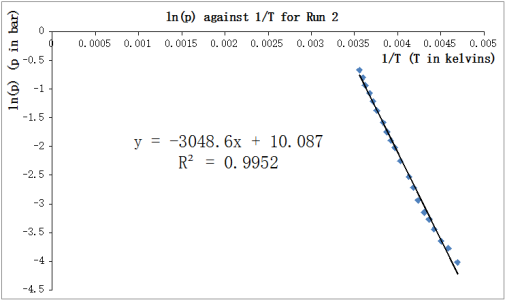
Figure 2. ln(p) against 1/T fro Run 2
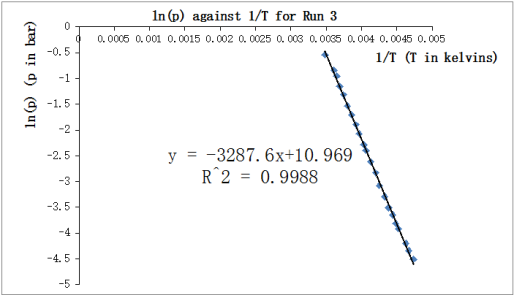
Figure 3. ln(p) against 1/T for Run 3
Rate of leaking of pressure of the apparatus = 2 mbar/min
To obtain ï²Hvap, the average value of gradients of three repeats which were obtained from Figure 1, Figure 2 and Figure 3 was used to calculate the final result ï²Hvap. This was the same for the constant C, therefore the mean value of constants C of three repeats was used as the final result of C.
The average gradient value = [(-3381.1) + (-3048.6) + (-3287.6)] ÷ 3 = -3239.1 K
ï²Hvap = -gradient × R = -3239.1 × 8.314 = 26929.8774 J mol-1
Constant C = (11.329 + 10.087 + 10.969) ÷ 3 = 10.795
Boiling point = Tboil = ï²Hvap/RC = 26929.8774/(8.314 × 10.795) = 300.0555813 K ≈ 26.9 ℃ (to 3 s.f.)
Data Analysis
The theoretical value of the enthalpy of vaporization of diethyl ether is 27140 J mol-1 at 25 ℃ [4] , therefore, percentage of error of ï²Hvap = [(27140 – 26929.8774) ÷ 27140] × 100% ≈ 0.774% (to 3 s.f.)
The theoretical value of the boiling point of diethyl ether is 34℃ [5], therefore, the percentage of error of boiling point = [(34 – 26.9) ÷ 34] × 100% ≈ 20.9% (to 3 s.f.)
Uncertainty in T = (0.25 ÷ 1) × 100% = 25%
Uncertainty in 1/T = (0.25 ÷ 12) ×100% = 25%
Uncertainty in p = (0.5 ÷ 11) × 100% ≈4.55% (to 3 s.f.)
Uncertainty in ln(p) = (0.5 ÷ 11) × 100% ≈4.55% (to 3 s.f.)
Uncertainty in ï²Hvap = uncertainty in gradient = 25% + 4.55% = 29.55%
Uncertainty in constant C = 29.55%
Uncertainty in boiling point Tboil = 29.55% + 29.55% = 59.1%
The values of R2 which are coefficients of determination were all shown to be fairly close to 1, therefore, the linear correlation between ln(p) and T was shown to be very nice.
The percentage of error of boiling point is much larger than the percentage of error of ï²Hvap, and the uncertainty of boiling point is even larger due to the uncertainties of 1/T and ln(p). This might come from two main sources of errors. One is the leaking of the experimental apparatus and the other is not high enough validities of temperature and pressure measurements obtained due to other errors like human errors.
For the leaking of the apparatus, the rate of leaking was measured as 2 mbar/min. To be more specif, the leaking was caused by the incompletely sealed connections between those glass tubes. The time from starting to take down measurements to finishing the experiment was about half an hour, this has led to a large uncertainty in the pressure measurements. Therefore, the readings of pressure at the lower temperature are much less accurate and smaller than the actual value that they should be, this shifted the gradient to a higher value, but the more serious effect was on the constant C which is the intercept with the axis of ln(p). As pressure was first recorded in mbar, when changing it into the unit of bar, the value was less than 1, therefore ln(p) is less than zero, a decrease in the pressure value can lead to a large change in the value of ln(p). So the constant C is much higher than the actual value. Although the percentage of error of ï²Hvap is small, but this does not mean the experiment was very accurate because its uncertainty is quite large, and this low percentage error might due to the combination of different errors.
For not high enough validities of temperature and pressure measurements obtained. The human error of recording temperature has the largest effect, and it has been indicated by the uncertainty of temperature reading which is 25%, this uncertainty is quite large enough to lead to inaccurate temperature readings and therefore the large uncertainties of the enthalpy of vaporization and boiling point. Another error causing low validities is the time used to wait until the temperature and pressure readings to be steady, which can definitely lead to more leaking of pressure. Although the experiment was about 30-minute long, but some readings were recorded before they became steady, and this would make he readings recorded higher than the actual ones.
Improvements
To reduce the error caused by the leaking of the apparatus, more advanced apparatus much be used. The leaking in these experiments was mostly caused by the incompletely sealed connections between those glass tube. Therefore, a set-up which has all glass tubes well connected without any crevice would be an ideal choice, this kind of set-up should be an entirety and can effectively avoid leaking. If the problem of leaking is solved, the time for waiting until the readings to become steady each time can be as long as possible to make sure the measurements are as accurate as they can.
To reduce the human error on taking down the readings of temperature and pressure, computers and sensors are suggested. For example, thermocouples [6] which are common temperature sensors used in industry, this type of temperature sensors can directly provide the electrical readings of temperature on the screen of the equipment and the size is fairly nice for using in laboratories. Computers can be used to take down the reading on those electrical equipment such as temperature sensors and the digital vacuum gauge by using the softwares or internal programs.
More precautions must be payed attention. Therefore, make sure the ether used is pure enough and the experimental apparatus especially the bulb is clean to prevent from impurities, and during the step of boiling the ether by vacuuming the bulb, take a longer time to boil the ether to make sure that all the air in the tubes can be swept out.
Conclusion
In conclusion, the graphs have proved that the linear relationship between ln(p) and 1/T was reliable. Therefore, the main equation ln(p) = -ï²Hvap/RT + C can be used to find the enthalpy of vaporization and the boiling point of ether and the assumption which has been made about the volumes is reliable in this case. However, the apparatus and some technics much be improved to reduce errors and then obtain accurate results.
References
[1] 6. Vapour Pressure a a Function of Temperature, 1st Year Physical Chemistry Laboratory 2013 lab script, p. 2
[2] 6. Vapour Pressure a a Function of Temperature, 1st Year Physical Chemistry Laboratory 2013 lab script, p. 3
[3] Enthalpy. Available from: http://en.wikipedia.org/wiki/Enthalpy [Accessed 26th March 2014]
[4] Majer, V.; Wagner, Z.; Svoboda, V.; Cadek, V., Journal of Chemical Thermodynamics, 1980 , vol. 12, # 4 p. 387 – 392
[5] Gomberg, M., Journal of the American Chemical Society, 1923 , vol. 45, p. 398 – 398
[6] TemperatureSensors. Available from: https://controls.engin.umich.edu/wiki/index.php/TemperatureSensors [Accessed 26th March 2014]
Appendix A
Run 1
|
Temperature/degrees |
Pressure/mbar |
1/T (T in kelvin) |
ln(p) (p in bar) |
|
15 |
661 |
0.003470415 |
-0.414001439 |
|
9 |
547 |
0.003544214 |
-0.603306477 |
|
7 |
476 |
0.003569516 |
-0.742337425 |
|
4 |
424 |
0.003608154 |
-0.858021824 |
|
2 |
378 |
0.003634381 |
-0.972861083 |
|
-2 |
330 |
0.003687996 |
-1.108662625 |
|
-4 |
291 |
0.0037154 |
-1.234432012 |
|
-7 |
250 |
0.00375728 |
-1.386294361 |
|
-10 |
220 |
0.003800114 |
-1.514127733 |
|
-12 |
193 |
0.003829217 |
-1.64506509 |
|
-14 |
175 |
0.003858769 |
-1.742969305 |
|
-17 |
155 |
0.003903963 |
-1.864330162 |
|
-20 |
132 |
0.003950227 |
-2.024953356 |
|
-22 |
116 |
0.003981684 |
-2.154165088 |
|
-26 |
95 |
0.004046126 |
-2.353878387 |
|
-29 |
80 |
0.004095843 |
-2.525728644 |
|
-33 |
65 |
0.004164064 |
-2.733368009 |
|
-36 |
53 |
0.00421674 |
-2.937463365 |
|
-40 |
41 |
0.004289084 |
-3.194183212 |
|
-42 |
35 |
0.004326195 |
-3.352407217 |
|
-44 |
32 |
0.004363954 |
-3.442019376 |
|
-48 |
25 |
0.004441483 |
-3.688879454 |
|
-52 |
20 |
0.004521818 |
-3.912023005 |
|
-54 |
17 |
0.004563085 |
-4.074541935 |
|
-56 |
14 |
0.004605112 |
-4.268697949 |
|
-59 |
12 |
0.004669624 |
-4.422848629 |
Appendix B
Run 2
|
Temperature/degree |
Pressure/mbar |
1/T (T in kelvin) |
ln(p) (p in bar) |
|
8 |
511 |
0.00355682 |
-0.671385689 |
|
5 |
448 |
0.003595182 |
-0.802962047 |
|
3 |
393 |
0.00362122 |
-0.933945667 |
|
-1 |
342 |
0.003674444 |
-1.072944542 |
|
-4 |
296 |
0.0037154 |
-1.217395825 |
|
-7 |
253 |
0.00375728 |
-1.37436579 |
|
-12 |
205 |
0.003829217 |
-1.5847453 |
|
-15 |
174 |
0.003873717 |
-1.74869998 |
|
-18 |
150 |
0.003919263 |
-1.897119985 |
|
-21 |
132 |
0.003965893 |
-2.024953356 |
|
-25 |
105 |
0.004029821 |
-2.253794929 |
|
-31 |
80 |
0.004129672 |
-2.525728644 |
|
-34 |
66 |
0.004181476 |
-2.718100537 |
|
-37 |
53 |
0.004234597 |
-2.937463365 |
|
-41 |
43 |
0.00430756 |
-3.146555163 |
|
-44 |
38 |
0.004363954 |
-3.270169119 |
|
-47 |
32 |
0.004421844 |
-3.442019376 |
|
-51 |
26 |
0.004501463 |
-3.649658741 |
|
-55 |
23 |
0.004584002 |
-3.772261063 |
|
-60 |
18 |
0.004691532 |
-4.017383521 |
Appendix C
Run 3
|
Temperature/degree |
Pressure/mbar |
1/T (T in kelvin) |
ln(p) (p in bar) |
|
14 |
582 |
0.0034825 |
-0.541284831 |
|
4 |
432 |
0.003608154 |
-0.839329691 |
|
1 |
385 |
0.003647638 |
-0.954511945 |
|
-2 |
316 |
0.003687996 |
-1.152013065 |
|
-6 |
268 |
0.003743215 |
-1.316768298 |
|
-10 |
216 |
0.003800114 |
-1.532476871 |
|
-14 |
182 |
0.003858769 |
-1.703748592 |
|
-18 |
150 |
0.003919263 |
-1.897119985 |
|
-21 |
126 |
0.003965893 |
-2.071473372 |
|
-25 |
102 |
0. |
Cite This Work
To export a reference to this article please select a referencing stye below:
Related Services
View all


DMCA / Removal Request
If you are the original writer of this essay and no longer wish to have your work published on UKEssays.com then please click the following link to email our support team:
Request essay removal