Synthesis and Optical Characteristics of AgO Thin Films
| ✅ Paper Type: Free Essay | ✅ Subject: Chemistry |
| ✅ Wordcount: 2221 words | ✅ Published: 28 Nov 2017 |
Synthesis and Optical Characteristics of AgO thin films Fabricated by Chemical Bath Deposition Method
1EZENWA I. A., 2OBIAGAUZO P. O. 3EBEH L. N.
ABSTRACT
Binary thin films of silver oxide using chemical Bath method (CBD) have been grown and characterized. Absorbance spectral data of the films were obtained using a Shimadzu 1800 UV- VIS spectrophotometer. An Olympus optical microscope at 100X magnification was used to examine and produce micrograph of the grown thin, which showed that the films have crystal structure and have small grain sizes. A bandgap of 1.62eV and a refractive index range of 1.1- 2.31were obtained.
INTRODUCTION
Binary thin films are thin films that contain exactly two different elements. Binary thin film had been grown and characterized by many researchers for various applications, examples are; Ag2S (Ezenwa et al., 2012), FeS (Uhuegbu, 1989), ZnS (Ndukwe 1999), Ag4O3, (Bielmann et al, 2002), Silver being multivalent, have various phases like Ag2O, AgO, Ag3O4, Ag4O3, and Ag2O3 by interacting with oxygen (Bielmann, Scheallar, Ruffieux, Groning, Schlapbach, 2002).These oxides have different crystalline structures leading to a variety of physiochemical, electrochemical, electronic and optical properties. The most observable and stable phases are Ag2O and AgO (Garner and Reeves, 1954). Ag2O thin films have been widely studied due to their wide range of applications. The recent interest in silver oxide is for its potential use in optical memories. Photoactivation of silver oxide leads to nanosilver clusters (Hou, Ouyang, Chen et al 1998).These nanoclusters emit fluorescence and also exhibit plasmonic behavior. These properties have a wide application range from ultra high density optical data storage to plasmon photonic devices (Tominaga, 2002).They are also used as a sensor for gas detection and photovoltaic materials, studies have shown that silver oxide films have a wide range of energy band gap of between 1.2 and 3.4eV(Dierson, Rousselot, 2005).
The major routes used for silver oxide films deposition are reactive sputtering of silver metal in an oxygen-containing argon atmosphere and electron-beam evaporation of silver metal. Another method is the pulsed laser deposition technique (Raju, Kumar, 2011),this method takes place in gaseous phase, hence requiring high temperatures. These high temperature methods also limit the type of substrates used in high temperature resistant substrates. Alternatively wet chemistry and electrochemical methods have been used as low temperature method.Wet chemistry methods generally require the substrates to be dipped inside the precursor solution for days to form thin film materials at temperatures of up to 200°C, while electrochemical deposition grows thin film materials on conductive substrate at lower temperatures (<90°C) and in less time (<2hours)(Wei, Mao, Oritiz, 2011), while most wet chemistry deposition at room temperatures takes a long time to get a good deposit. In this work, oxides of silver were deposited on glass substrates by chemical bath deposition method at a temperature of 300K. Chemical bath deposition is the simplest way to deposit thin films of some metal oxides, which are known to have spectrally selective characteristics suitable for photothermal and material applications.The optical and morphological properties of the deposited film were studied in this work.
MATERIALS AND METHOD
We synthesized all the films for this work using chemical bath deposition method. In this study the substrate used is microscopic glass slide. Prior to deposition of silver oxide, the substrate were decreased using Nitric acids for 24hrs, washed with detergent and rinsed with distilled water and allowed to dry in air. Silver Oxide (AgO) was deposited by the reaction of solution containing Silver Nitrate (AgNO3), Triethanolamine (C6H15NO3) commonly known as TEA(the complexing agent), Ammonium hydroxide solution (NH2OH) and Distilled water in a beaker. The addition of TEA as complexing agents slowed down the precipitation of the silver ions in the mixture. Ammonia solution was used to stabilize the pH of the solution. Deposition of AgO thin films of slides Ag1,Ag2,Ag3,Ag4 and Ag5 were carried out using 100ml glass beaker at an average room temperature of 300K, 10mls of silver nitrate was measured and transferred into the beaker, followed with addition of 1ml of TEA which was stirred to have a homogenous mixture. On addition of TEA, a white suspension liquid was formed. On adding 10mls of ammonia solution, the white suspension liquid turned dark brown. The volume was made up with 60mls of distilled water and was stirred for 2 minutes before dipping the substrate into the beaker. The remaining four samples were deposited with TEA volumes of 2mls, 3mls, 4mls and 5mls. The baths were allowed for 52 hours after which the substrates were removed, rinsed with distilled water and dried in air. Table 1 below shows the of bath constituents as used in the deposition process.
Table 1: Bath Constituent for the Deposition of AgO Thin Film
|
Slides Number |
AgNO3 |
Vol. of TEA |
NH4OH |
H2O |
Time |
|
Ag1 |
10ml |
1ml |
5ml |
60 |
52hrs |
|
Ag2 |
10ml |
2ml |
5ml |
60 |
52hrs |
|
Ag3 |
10ml |
3ml |
5ml |
60 |
52hrs |
|
Ag4 |
10ml |
4ml |
5ml |
60 |
52hrs |
|
Ag5 |
10ml |
5ml |
5ml |
60 |
52hrs |
The reaction is as follows
 Ag(NO3)2+TEA [Ag(TEA)]² + 2NO3
(Ag(TEA)²+Ag2+ +TEA
Ag2 + OH AgO + H2O +2e—
After the synthesis of the films, characterization of the as-grown thin films was done at National Centre for Energy Research and Development, University of Nigeria, Nsuka, Enugu State, Nigeria. Absorbance spectra data of the films were obtained using a Shimadzu 1800 UV-VIS spectrophotometer. Micrographs of the thin films were taken using an Olympus optical microscope. From the absorbance values obtained, other parameters which includes: transmittance, reflectance, refractive index and Optical conductivity were derived using theory.
RESULTS AND DISCUSSION

Figure 1: Graph of Absorbance Versus Wavelength (nm) for AgO Thin film
Fig 1 show the graph of absorbance versus wavelength. A careful look at the graph shows that all the slides have high absorbance in the UV region of electromagnetic spectrum; slide Ag1 has absorbance of 0.65 at approximately 380nm, while Ag3 has approximately 0.72 at the same wavelength. All the slides shows very low absorbance in the VIS-NIR region of the spectrum, slide Ag1 has approximately 0.02 in this region. Generally, the films have high absorbance in the UV region and low absorbance in VIS/NIR region of electromagnetic spectrum. The absorbance decreases as the wavelength of electromagnetic spectrum increases. These result are in agreement with (Zhang and Zhang e.t al 2003), Peyser Vinson and Bartko, Dickson 2001), for thin films of AgO. These types of thin films could have potential application in the fabrication of fluorescence lamp.

Figure 2: Graph of Percentage Transmittance (%) Versus Wavelength (nm) for AgO Thin film
Fig 2 show the graph of transmittance versus wavelength. A careful look at the graph shows that all the slides have low transmittance in the UV region of the electromagnetic spectrum; slide Ag5 has transmittance of 1% at 300nm. All the slides shows very high transmittance at VIS-NIR region of the spectrum, slide Ag5 has approximately 99% in this region.

Figure 3: Graph of Reflectance against wavelength (nm) for AgO Thin Film
Fig 3. shows the graph of reflectance (%) versus wavelength. A careful look at the graph shows that all the slides have low reflectance (%) all through the region of electromagnetic spectrum, slide Ag5 has reflectance of 14.1 at approximately 380nm, while slide Ag3 has approximately 5.8 at the same wavelength, all the slides show very low reflectance in the UV – VIS – NIR region of the spectrum, slide Ag3 has approximately 0.2 in this region.
Due to the low reflectance of these as–grown thin films, they could be useful in anti-reflective coating of optical materials.

Figure 4: Graph of Refractive Index versus Wavelength (nm) for AgO Thin Film
Fig. 4 shows the graph of refractive index versus wavelength. A careful look at the graph shows that all the slides have high refractive index in the UV region of electromagnetic spectrum; slide Ag5 has refractive index of 2.1 at approximately 330nm, while ag3 has approximately 2.31 at the same wavelength. All the slides show low refractive index at VIS-NIR region of the spectrum, slide Ag1 has approximately 1.1 in this region.

Figure: 5 Graph of Optical Conductivity versus Wavelength (nm) for AgO Thin Film
Fig 5 show the graph of optical conductivity versus wavelength. A careful look at the graph shows that all the slides have high optical conductivity in the UV region of electromagnetic spectrum; slide Ag5 has optical conductivity of  at approximately 320nm, while slide Ag1 has optical conductivity of
  , at the same wavelength. All the slides show very low optical conductivity in the VIS- NIR region of the spectrum, slide Ag3 has optical conductivity
  in this region.
Fig 6 shows thickness of the fabricated films as a function of volume of TEA. Thickness increases as volume of TEA increases. The peak Thickness of the films is at 5mls which has a value of 0.66μm. This shows that thickness of the films increases as the volume of TEA increases.
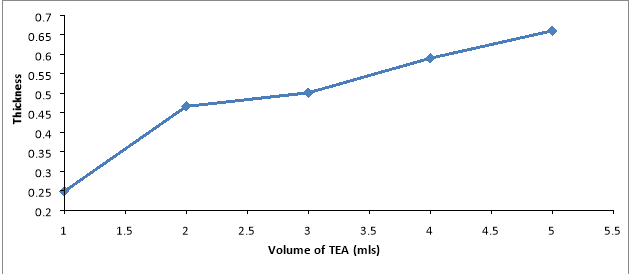
Figure 6: Graph of Thickness versus Volume of Complexing Agent for AgO Thin Film.
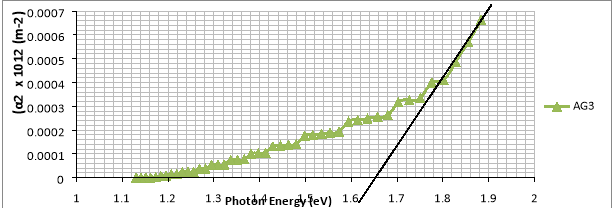
Figure 7: Graph of Absorption Coefficient Squared versus Photon Energy
Fig. 7 is a plot of absorption coefficient squared versus photon energy for AgO thin film. Optical applications of semiconducting materials, one of the most important aspects is to determine the range of wavelength covering the energy of the gaps between the valence and conduction band. This gives useful information about the region of transparency for the film material [13]. According to the Tauc [14]:
α= A(hv –Eg)n/ hv 1
Using this equation , the optical band gap energy Eg was determined by plotting (αhv)n versus photon energy (hv) in the absorption range followed by extrapolation of linear region of the plot of (αhv)n = 0. The exponent n is an index that characterizes the optical transition process and is theoretically equal to ½ or 2 for indirect and direct band gap respectively[15,16]. The best fit to the experimental data was obtained for n =2. Fig 7 shows the plots of (αhv)2 versus hv of. The optical band gap, Eg values obtained by extrapolating the linear region of the plots on the  axis is 1.62eV.
Fig.8 and fig. 9, shows the micrograph of AgO thin films for slides Ag2 and Ag3. Critical observation of the micrographs reveal that the films are crystalline and has small grain sizes. There are some patches in the micrograph pictures shown below which suggest that there are some defects which may be due to impurities during the process of deposition.

Figure 8: Micrograph of AgO for Slide Ag2

Figure 9: Micrograph of AgO for Slide Ag3
CONCLUSION
We have successfully fabricated AgO thin film deposited on glass substrates through chemical bath deposition technique and a subsequent variation of concentration of complexing. Also we observed that different concentration of complexing agent affected the thickness of the deposited silver oxide thin film. The films have high absorbance in the UV region and low absorbance in VIS/NIR region of electromagnetic spectrum, also all the slides have low transmittance in the UV region of the electromagnetic spectrum; slide Ag5 has transmittance of 1% at 300nm, while all the slides shows very high transmittance at VIS-NIR region of the spectrum, with highest value of approximately 99% in this region.
Our study also shows that all the slides have high refractive index in the UV region of electromagnetic spectrum; slide Ag5 has refractive index of 2.1 at approximately 330nm, while ag3 has approximately 2.31 at the same wavelength. All the slides show low refractive index at VIS-NIR region of the spectrum, slide Ag1 has approximately 1.1 in this region. Band gap value obtained is 1.62eV.
REFERENCES
[1] Bielmann, M. Schwaller, P. Ruffieux, P. Groning,O., Schlapbach L. and Grooning, P. (2002),
AgO investigated by Photoelectron spectroscopy; evidence for mixed valence, Physical Review B,
Vol. 65 ,No.23, p.1-5.
[2] Ezenwa I. A., Okereke N. A. and Egwunyenga N. J., (2012). Optical Properties of Chemical Bath
Deposited Ag2S Thin Films, International Journal of Science and Technology, Volume 2 No.3, p.
101 – 106.
[3] Garner W. E. and Reeves, L. W. ,(1954). The thermal decomposition of silver oxide,
Transactions of the Faraday Society,Vol.50, pp.254–260.
[2] Hou, S.M.Ouyang ,M. ChenetalH.F., (1998), Fractalstructureinthe silver oxide thin ï¬lm, Tin
Solid Films,Vol.315,No.1-2,pp.322–326.
[4] Ndukwe I.C, (1999), Optical Properties and Applications of Solution Grown Zinc Sulphide Thin
Films, Sol. Energy Mater.
[5] Raju, N. R. C Kumar,K. J. and Subrahmanyam, A. (2009), Physical properties
of silver oxide thin ï¬lms by pulsed laser deposition:effect of oxygen pressure during growth, Journal
of Physics D,Vol. 42, No. 13, Article ID 135411.
[7] Tominaga, J. Buchel, D., Mihalcea, C. Shime,T. and FukayaT.(2002). The Application of Silver
Oxide Thin Flms to Plasmon Photonicdevices, MRS Proceedings,Vol.728, ArticleS7.3.
[8] Dierson J. F. and Rousselot C. (2005), Stability of reactivity Sputtered Silver Oxide Films,
Surface and Coating Technology, Vol. 200, No. 1-4, pp. 276-279.
[9] Uhuegbe, (1989), Deposition and Characterization of Chalcogenide Thin Solids Films for
Industrial Appl. ,Ph.D Thesis, University of Nigeria, Nsukka.
[10] W. wei, X. Mao, L. A. Ortiz and D. R. Sadoway, (2011) Oriented Silver Oxide Nanostructures
Synthesized through a Template – free Electrochemical route, Journal of Material Chemistry, Vol.
21, No. 2, pp. 432-438.
[11] Zhang, X. Y. Pan, X. Y. Zhang Q. F. , (2003), Synthesis of Silver Oxide Nano-scale Thin Films
and Photo-activated Dynamic Luminescence from their Nanoparticles, Acta Physicochemical Sinica,
Vol., 19, No. 3, pp. 203–207.
[12] Peyser, L.A.Vinson.Bartko, A.E and Dickson R.M. (2001.), “Photoactivated Fluorescence from
individual silver Nanoclusters, Science,Vol. 291, No.5501, pp.103–106.
[13] Sahvo, N. K. Apparo, K. V. S. R., (1996), Appl. Phys. A, 63, 195.
[14] Tauc, T. S. and Memth, A. J., (1972), Non – Cryst. Solids, 126 569.
[15] K. Bindu, J. Campos, M. T. S. Nair, A. Sanchez, P. K. Nair, Semicond. Sci. Tech., 20 (2005) 496.
[16] A. F. Quasrawi , Cryst. Res. Tech. 40 (2005) 610.
Cite This Work
To export a reference to this article please select a referencing stye below:
Related Services
View all


DMCA / Removal Request
If you are the original writer of this essay and no longer wish to have your work published on UKEssays.com then please click the following link to email our support team:
Request essay removal