Strain Guage Experiment and Procedure
| ✅ Paper Type: Free Essay | ✅ Subject: Chemistry |
| ✅ Wordcount: 3122 words | ✅ Published: 18 May 2020 |
Abstract
The main objective of this lab is to familiarize students with strain gauges and the proper procedures to take when applying them to the material and recording the data. The data will be recorded using a strain gauge, dial indicator and a weight hanger. This collected data will then be used to run an FEA analysis and perform calculations in order to determine the material used to make up the beam. Upon starting the lab the student will clean and prepare the surface where the strain gauge will be attached. Once the gauge has been attached to the surface of the metal a soldering iron will then be used to connect the strain indicator to the strain gauge. Using the vernier calipers the distance from the base of the beam to the strain gauge will need to be measured, along with the cross section dimensions of the beam. The distance from the base of the beam to the location of the weight hanger should also be measured. After finishing the experimental setup and double checking connections to insure proper readings, four different measurements were taken, each with a different weight. The measurements taken include the applied load, beam deflection and surface strain. From all the measurements taken in prior steps students should be able to calculate: the beam’s moment of inertia, young’s modulus and both theoretical and experimental stress and strain. All calculations and measurements performed allows for students to find the margin of error by plotting theoretical and experimental values on graphs. Finally using these calculations and measurements students are able to run an FEA simulation showing where the stress, strain, and deflection occurs on the beam and the appropriate values at each point.
Introduction
Over the course of this lab, the participants will gain a better understanding of how a strain gage works and what variables can be analyzed when using one. In doing this one will also learn a few important skills such as: how to to prep a surface in order to bond objects to it; how to solder wires onto terminals in order to connect them to a strain indicator box; and how to analyze the following dependent variables: stress, moment of inertia, deflection. Before going into these details it is important to understand what a strain gage is. It’s a little metal-foil grid that can be bonded to a structure and when said structure experiences external strain it can feel that same force allowing for measurement of strain. This is because as the cross-sectional area of the strain gage stretches and compresses the resistance of the strain gage also changes, this allows for indirect measurement of strain. This idea is shown in figure five. The measurement of resistance is so small that a balanced Wheatstone bridge circuit must be used. There are many types of this configuration where one such one is the basic quarter bridge configuration as shown in figure six. Using this configuration will allow for the measurement of the difference in resistance.
Now to better understand the forces involved, stress, strain, the moment of inertia and deflection should be discussed. Stress is how much force vicinal particles put on each other. When an under tension particles pull on each other and under compression they push. Strain is a measurement of the deformation of a material. The value depends on material properties, temperature, and applied stress. There is a relationship between stress and strain called Hooke’s law, E = εσ, where stress is the product of young’s modulus and the strain. This relationship results in a curve that can be seen in figure seven.
In this experiment, a fixed beam or rather a simply loaded cantilever beam was used. It is important to note that the sheer force is uniformly distributed throughout the beam and the maximum moment acts at the fixed point. The bending moment can be calculated using the load at a measured distance d and the distance from the beams neutral axis, c, and the moment of inertia of the cross-sectional area. The bending moment equation, therefore, is σ(d) = Mc/I y . The moment of inertia, I y helps analysis how the mass of a rotating object acts. This measurement can be found by using the equation I y = bh 3/12 .Where b is the length of the beam parallel to the rotation of axis, and his the height. Finally, deflection is a result of a load applied to the free end of a cantilever beam, this deflection is a measurement of displacement and can be measured using the equation δ(x) =− Px 2/6EI(3L − x). The variables of this equation are shown in figure eight.
Procedure
For this lab, before starting, the following list of tools should be accounted for:
● 1 Cantilever beam (Steel OR Al)
•1 Bottle of M-BOND Catalyst-C
(blue liquid)
•1 Soldering iron with sponge
•1 Vernier caliper
•1 Dial indicator
•1 Multi-meter (check battery)
•1 Strain indicator (check battery)
•1 Tape measure
•1 Weight hanger
•3-4 Steel weights
•1 Spool of light gage wire
•1 Set of wire strippers
•1 Adhesive tape roll
•4-5 Pieces of gauze
•1 Set of tweezers
•1 Piece of sandpaper
•1 Can of surface degreaser
•1 Bottle of M-PREP Conditioner A
•1 Bottle of M-PREP Neutralizer 5A
•1 Bottle of M-BOND 200 Adhesive
•1 Strain gage (for Steel OR Al)
To reference throughout, figure one shows a general outline for the steps of the lab and can be used as a guideline to make sure that no important steps are missed during the procedure. Therefore the fixed beam needs to be prepped for application of the strain gage. First record, using the Vernier caliper, the thickness, or height, and the width of the beam. When cleaning the beam makes sure not to touch the surface with fingers, allow solutions to evaporate, wait too long between steps, and wiping back and forth with gauzes, or sponges. Using the sandpaper smooth out an area 3-4 inches close to the base of the beam as this will allow for better measurements. Now using the degreaser spray and wipe down the area that was sanded. Use the gauze to wipe the area. Repeat this process until the area of bonding is smooth and shiny. Before going any further it is important to adorn a pair of latex gloves if not done so already because the chemicals that are to be used next can be assumed to be carcinogenic, cancer-causing. Using the M-Prep Conditioner A cover the same is using a sufficient amount, let sit for 30 seconds then remove with gauzes. Then using the M-Prep Neutralizer 5A the same can be done.
Now that the are is sufficiently cleaned and prepped the strain gage will be placed and bonded. A center mark should be made marking a location for which the gage will be placed. The mark should be a cross that indicates the orientation of the gage. The gage should run parallel along the beam. Remove the strain gage from its package using a pair of tweezers and place it on a glass plate with the bonding side of the facing gage down. With a large piece of clear adhesive tape, use it to pick up the gage by first anchoring one end of the tape to the glass plate then covering the gage. The tape can now be used to pull up the gage by pulling off the tape from the glass plate at a 35-degree angle. The result should be the piece of tape with the gage adhered to it. Now position the gage over the beam in line with the mark that was made and press the tape down so that one end is fixed and the rest of the tape can be folded over so that it makes a shallow angle with the beam allowing the gage to be free of the specimen. A thin coat of M-bond 200 Catalyst is should be applied directly to the gage. The brush used for application should be wiped against the lip of the container bottle so that a thin coat can be applied. The catalyst must be left to dry for 2 to 3 minutes. This period should be timed and done with ambient laboratory conditions. After drying the M-Bond 200 can be applied where the tape meets the beam. Now pull the tape so that the gage makes approximately a 30-degree angle with the beam. The tape should be taught, now with one single motion, the tape should be pressed firmly into place, lining the mark up with the gage. Apply pressure to this area for a minimum of one minute. After this time period, the tape should be able to be peeled back leaving just the gage on the beam. The distance from the center of the gage to the fixed point of the beam should be measured. The soldering portion of the experiment will now be started. The gage has two visible terminals that will need to have two independent wires soldered to them. The circuit is very delicate so tape should be used to mask leaving only the terminals exposed. The soldering iron should be plugged in and be allowed to reach its maximum temperature. A wet sponge can be kept in order to wipe away any excess metal resulting from the experiment. Once the solder is hot the temperature should be reduced to the 2.75 settings. Now using tin melt a small amount of solder onto each gauge in conjunction with a wire for each. A small bead should form that will hold the wire in place, but for extra security use more tap to secure the wires to the beam after they have been soldered on. Now with the multimeter plug the black probe into the jack labeled COM and the red probe into the neutral jack. The multimeter should be set to continuity then the two probes can be used to measure the resistance through the two wires connected to the gage. A readout of 120 ohms should be achieved. If the terminals were soldered improperly, as to say they are touching, the device will beep. Now that it is known that the strain gage is working connect the two wires to the strain indicator and set it to a quarter bridge Wheatstone circuit. With the circuit complete the amp zero dial should be used to achieve a zero readout, then by pressing the gage factor button will allow for the input of the strain gage factor. The Run button and Balance knobs can be used to calibrate and zero out of the system. To check if the system is working the end of the beam can be manually pushed down which should result in an increase of the number displayed on the measuring device. Now a dial indicator should be placed underneath the beam allowing for the measurement of deflection at whatever particular point it is placed.the distance from the dial indicator to the fixed point of the beam should be recorded. Next using a weight set and hanger begins to use different combinations of weight in order to cause deflection on the beam. For each different combination, the hanger should be placed at the same recorded distance from the fixed point each time, and the total weight, deflection, and strain readout should be recorded. A total of 6 different combinations should be used as seen in table 5. Each time a set is removed from the beam all the dials and readouts should be at zero. This concludes the lab. To clean up, the wires and gage should be removed and from the beam and disposed of. All tools should be put back in their appropriate spots.
Results
Table 1: Value of the Moment of Inertia for the given beam
| Moment of Inertia |
| 5.5157E-10 |
Here the calculation for the moment of inertia was found from using width, and height. This value is important when solving for theoretical stress and strain.
Table 2: Calculations of the Theoretical Stress and Strain
| Theoretical Stress | Theoretical Strain |
| 3.6145E+06 | 5.2384E-05 |
| 1.2134E+07 | 1.7586E-04 |
| 2.4011E+07 | 3.4798E-04 |
| 3.6145E+07 | 5.2384E-04 |
The values calculated above are the theoretical stresses and strains. These calculations were made from the moment of inertia, geometry of the beam, and the moment of the beam about the point at the base of the beam. The moment was not given and had to be calculated through the given mass. This meant finding the force first which then led us to finding the moment about the base point.
Table 3: Shows the values calculated from the theoretical stress and experimental strain.
| Finding out the Beam’s Modulus of Elasticity |
| 6.5718E+10 |
| 8.3685E+10 |
| 7.0619E+10 |
| 7.0048E+10 |
| Average: 7.2518E+10 |
The beam that was used in this experiment had an unknown material property that needed to be found before other values could be calculated like the theoretical strain and the experimental stress. It was visually appealing by having a shiny quality, so an educated guess was made between the team member and decided that it most likely is aluminum 6061. After doing the calculations it was determined that the beam is in fact aluminum 6061. The average that was calculated (shown in Table 3) had a Modulus of Elasticity very close to it’s true value of 69GPA.
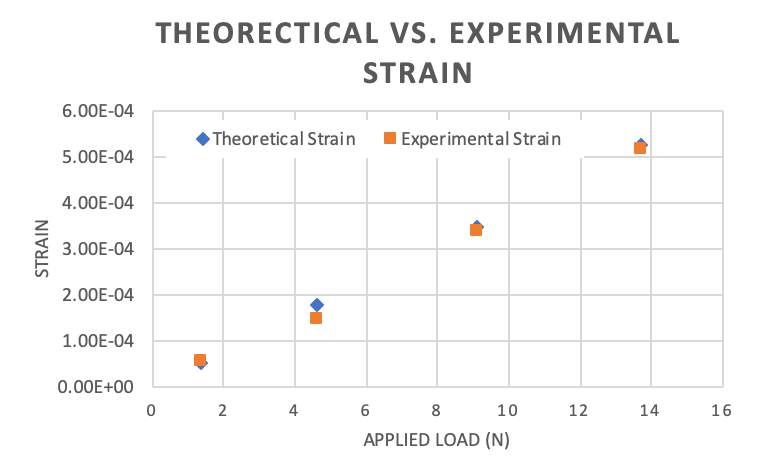
Figure 1: Graph showing the theoretical strain vs. the experimental strain.
The values that were calculated and measured showed how the experimental values are actually lower than the theoretical. This was expected to occur due to some errors that may have occurred while taking the measurements. Also, it can be noted that the values of the deviation will increase as the load is increased.
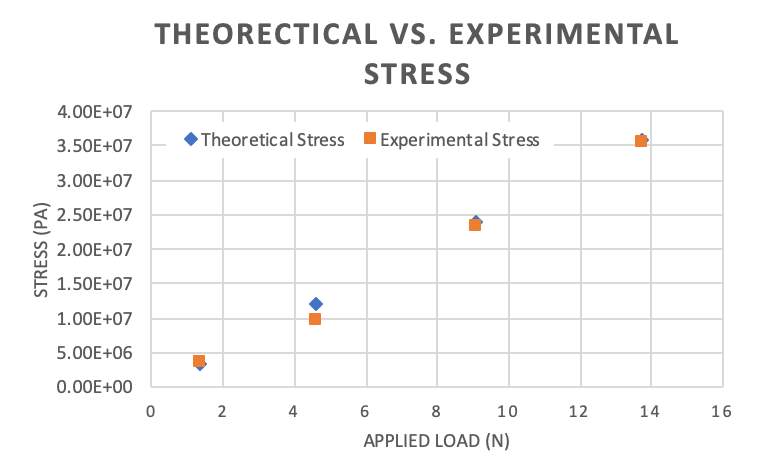
Values from this graph were only calculated after knowing the estimated values for the strain. With the strain and the Young’s Modulus of Elasticity, the stress values could be calculated. The stress values represent a similar trait at the strain in the aspect how the experimental value tend to be lower than the theoretical values.
Figure 2: The
Table 3: Measured Experimental Stress and Strain
| Experimental Stress | Experimental Strain |
| 3.80E+06 | 5.5000E-05 |
| 1.00E+07 | 1.4500E-04 |
| 2.35E+07 | 3.4000E-04 |
| 3.56E+07 | 5.1600E-04 |
The values that were measured from the experiment came from using a dial indicator, strain gauge, and the strain indicator.
Table 4: Values of Young’s Modulus of Elasticity from Deflection and Loads
| Modulus of Elasticity using the Measured Deflection and the Loads |
| 1.2042E+11 |
| 9.6014E+10 |
| 6.8463E+10 |
| 6.5371E+10 |
| Average: 8.7567E+10 |
Conclusion
Upon completing the lab students should have a recorded set of data points for each individual weight hung from the beam. These data points accompanied with measured data, using the vernier caliper and tape measure, will supply the numerical data necessary to perform theoretical and experimental calculations in order to find the deformations and stress respectively to each. FEA (finite element analysis) is a second tool that helps to assist students in a better understanding of the stress and deformations experienced by the beam at respective points. Upon comparing the calculated forces as well as an FEA analysis the student should be able to deduct which material was used during the experiment, in the case of this experiment it was aluminum 6061. Finally upon completing the lab experiment students are able to experience first hand the effects of placing a load on an extending unknown beam of material ‘x’ and deduct the material characteristics.
Appendix
1. Calculate the cantilever beam’s moment of inertia.
The moment of inertia describes how the mass of a rotating body is distributed about an axis of rotation. This can be calculated by multiplying the width by the cubed multiple of the height. This is then divided by 12.
Iy = bh3/12
In our case, the moment of inertia of our cantilevered beam is:
Iy = .00635 m * .025853 m3 /12 = 5.5157E-10 m4
2. Calculate the estimated/theoretical stress at the point the strain gage was applied by using shear force and bending moment diagrams.
The theoretical stress can be calculated by multiplying the bending moment by the neutral axis of the beam and dividing these values by the moment of inertia of the cantilevered beam. The bending moment is found by force of the hanger weight multiplied by the distance from the base of the beam to the acting force.
M = Pd
For example, the moment of the first hanger weight is:
M = (0.14 kg * 9.81 m/s2 ) * 0.4572 m = 0.628 Nm
From here you apply the theoretical stress equation:
σ = Mc/Iy
Using the first hanger as our example:
σ = 0.628 Nm * 0.003175 m/ 5.5157E-10 m4 = 3.6145E+06 Pa
3. Calculate the estimated/theoretical strain at the point the strain gage was applied.
The theoretical strain was calculated by dividing the theoretical stress by the elastic modulus that we hypothesized. The elastic modulus that we hypothesized was that of Aluminum 6061 with its value being 6.9E+10 Pa.
ε = σ/E
If we use the stress value of the first hanger weight, our value of the theoretical strain:
ε = 3.6145E+06 Pa / 6.9E+10 Pa = 5.2384E-05
4. On one plot, graph the estimated/theoretical strain and the experimental/measured strain against the applied load (horizontal axis).
The experimental strain was measured by the strain gauge and strain indicator. This was plotted against the applied load values. In comparing this with the theoretical strain, the theoretical values were also plotted against the applied load on the same line. From the graph in the results section, we find that the experimental strain tends to be less than the theoretical strain values, but each avlue almost overlap, so the two values resemble each other closely.
8. SolidWorks® Finite Element Analysis (FEA) Simulation. There are many different ways to model and analyze the same problem. In our case, we have an analytical (calculated) deflection and experimentally measured values. Let’s see how an FEA model compares to our laboratory data. In this case, we are using the SolidWorks Simulation package. From this FEA model derive stress and strain at the point the strain gage was applied, and the deflection at the place where the dial indicator was placed. Include these results in your discussion in a neat and legible format. Also, include three legible pictures: Stress, strain, and deflection distribution.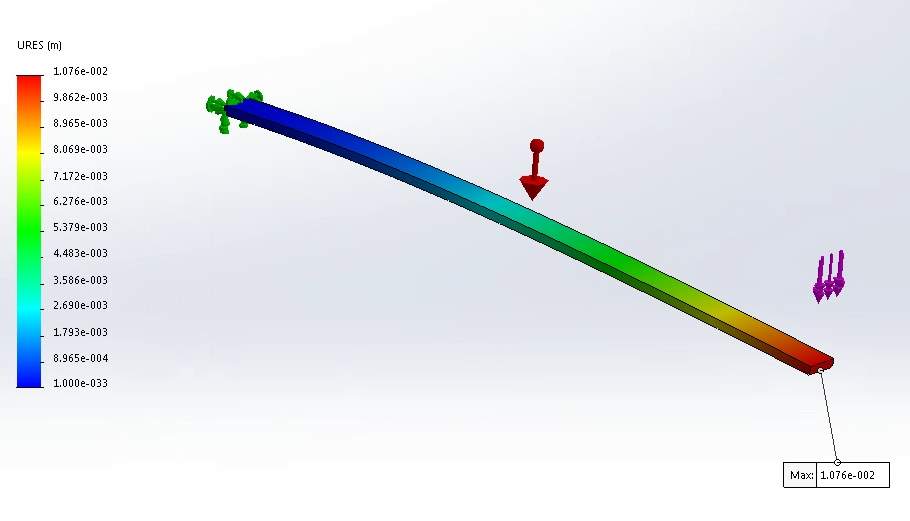
Figure x: FEA representation of the average stress at the point where the strain gage was located.
.
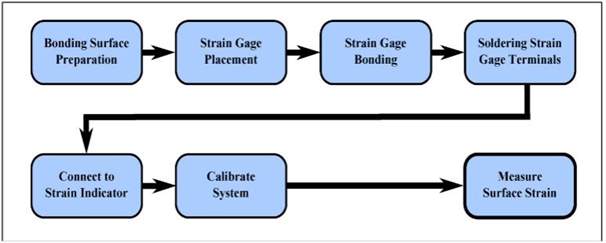
Figure x: A flow chart showing the basic outline for the procedure of this lab
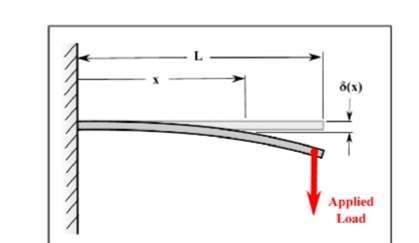
Figure x: A cantilever beam deflects as it is loaded.
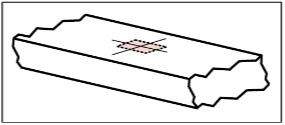
Figure x: Strain gage layout lines with potential strain gage position
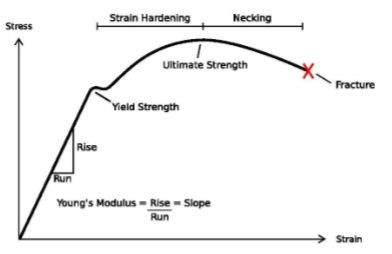
Figure x: Typical Stress-strain curve
(https://commons.wikimedia.org/wiki/File:Stress_Strain_Ductile_Material.pdf)
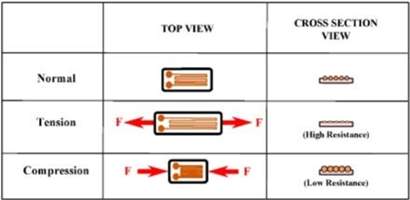
Figure x: A Strain gage in tension and compression
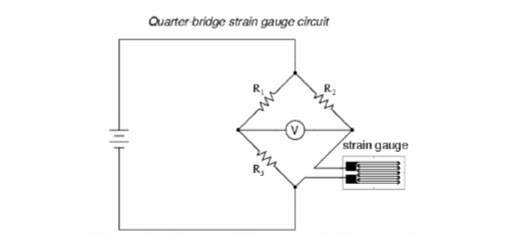
Figure x: Quarter Wheatstone bridge circuit
(http://www.ibiblio.org/kuphaldt/electriCircuits/DC/DC_9.html)
Table x: Basic Dimensions
| Basic Dimensions | ||
| Height (mm) | Width (mm) | Length(mm) |
| 6.35 | 25.85 | 499.11 |
Table x: Distances
| Distance from strain gage to the applied load (d) (mm) | 76.2 |
| Distance from the base of the beam to the tip of the dial indicator (x) (mm) | 345.92 |
| Distance from base of the beam to the applied load
(P) (mm) |
457.2 |
Cite This Work
To export a reference to this article please select a referencing stye below:
Related Services
View all


DMCA / Removal Request
If you are the original writer of this essay and no longer wish to have your work published on UKEssays.com then please click the following link to email our support team:
Request essay removal