Profiling Human Hair with FTIR Spectroscopy and Chemometrics
| ✅ Paper Type: Free Essay | ✅ Subject: Chemistry |
| ✅ Wordcount: 1569 words | ✅ Published: 18 Jan 2018 |
ABSTRACT
Profiling of Human Hairs using FTIR Spectroscopy and Chemometrics Technique
Aufa Madihah Binti Mohamad Anwar
1122204
Hair is any of the fine threadlike strands growing from the skin of humans can be found in crime scene due to interaction between victim, perpetrator and/or witness as explained in Locard’s Principle. This paper’s aim is to compare, categorize and identify human hair fiber using FTIR spectrometer and Chemometrics techniques. Hair samples will be collected from 200 subjects (Malay Women) of different ages groups. 50 samples will be collected from age group of people (20-30, 31-40, 41-50, >60). FTIR spectra will be obtained from each samples. The spectra of FTIR reflect the chemical and physical nature of a hair which can be classified in different group using Chemometrics techniques such as PCA (Principal Component Analysis).
Keyword: FTIR, Chemometrics, Locard’s Principle, PCA
- Research Methodology
6.1 Materials
Material uses in this experiment will be human hair. 50 strands will be collected for each group of age and the total hair strand obtained will be 200 strands:
|
Sample |
Human Hair |
|||
|
Age Group |
20-30 |
31-40 |
41-50 |
More than 60 |
|
No. of Strands |
50 |
50 |
50 |
50 |
6.2 Methods
6.2.1 Human Hair sample collection
Human hair will be collected according to their age group (50 strands from each group of age). The hair fibers taken will be from telogen (fall naturally) phase and anagen (the root was cut) phase of the hair growth cycle. The hair fibers will be placed in a plastic bag and labeled accordingly.
6.3 Analysis
6.3.1 Revised IAEA Method for Cleaning Hair Fibers
The cleaning process is needed to preserved hair samples for the elemental analysis. (Cargnello et al., 1995) The hair fibers will undergo ultrasonic vibration (sonicating) in each solutions for 10 minutes or less. This procedure will be done to minimize the damage of the cuticle surface. First, the hair fibers will be transferred to a small glass vial and will be covered with high purity acetone. The vial was then will be placed in Ultrasonic Disintegrator (Figure 6). The hair fibers will be sonicate of at 20 kHz for 10 minutes at the least. The acetone will be poured out and the hair will be rinsed with HPLC-grade water. These steps will be repeated again and for the last steps, the hair fibers will be rinsed and sonicated in de-ionized water inside the glass vial for 10 minutes. After all the cleaning process ended, the hair fiber will be dried under vacuum for two days before being analyzed.
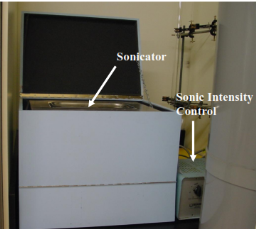
Figure 6 : Ultrasonic Disintegrator – Sonicater for the hair fibers
6.3.2 FTIR Spectroscopy
A FTIR Spectrometer with Diamond ATR Smart Accessory (Figure 7) will be used in this procedure. The spectra of hair fibers will be recorded using the spectrometer.
 Figure 7: FTIR Spectrometer with Diamond Smart Accessory
The parameters of FTIR-ATR for the analysis (Table 2):
|
Table 2: Parameters Specifications for the FTIR Spectroscopy |
|
|
Parameters |
Reading |
|
Resolution (cm-1) |
2.0 |
|
Aperture (µm) |
100 |
|
No. of Co-added Scans |
256 Scans |
|
Detector |
DTGS |
|
Beam splitter |
KBr |
|
Mirror Velocity (cm/s) |
0.6329 |
|
Gain |
8.00 |
|
Internal Reflection Element (IRE) |
Diamond |
Before analyzing and collecting the spectrum from the hair samples, a background spectrum will be recorded. The hair fibers will then going through spectral sampling process :
- The fibers will be placed across the diamond crystal and will be pressed (to obtain a good contact) using the pressure tower.
- Spectrum will be recorded.
- The collected data will be saved on the Spectral Software Program (as .SPC files).
- Spectral Processing
The recorded spectral will be saved as .SPC files and are imported into the spectral software package for spectral processing as .SPA files. First of all, the baseline of the spectra will be corrected and the offset will be set to zero. Then, the spectra will be trimmed so that it will be in the range of α-keratin absorption bands which is 1759-785 cm-1 range (major characteristic of α-keratin). The trimmed spectral will then be transferred to an Excel spreadsheet and saved as an .XLS file.
- Raw Data Matrix and Chemometric Analysis
Pre-processing of data is defined as “mathematical manipulation of a data is used due to primary analysis”. (Arnberg R. et al., 1998).This step helps in eliminating or decreasing unrelated sources (systematic or random errors).
- Variance Scaling
Scaling steps will be done prior to the fact that the treatment considers both the measurement unit of the values and the origin of scale. (Meloun M. et al., 1992) Scaling is needed to include:
- Cartesian system’s shift of the origin,
- Axes’ contraction or expansion.
- Double Centring
Double string will be obtained by subtracting the mean of each row x (x-mean centring) and row y (y-mean centring). This procedure reduces the effect of the variance component reflected by PCI of the un-pretreated data set and removes common spectral features. (Kokot S. et al., 1997) Equation 1 and Equation 2 (Meloun M. et al., 1992) described the process above:
Yim = xim – x.mEquation 1
Continued by;
zim = yim – yi Equation 2
Where;
yim = column centred datum
xim = datum in row I and column m before centring
 x.m = mean of column m = xim / I
zim = double centred datum
- Standardization
The standardization procedure is included to equalize the variance of each variable and to remove the weighting that is artificially imposed by the scale of the variables. (Arnberg R. et al., 1998) Standardization process can be described in the equation 3 and 4 below:
yim = xim / sm Equation 3

 Where;
 sm = (xim – x.m)2 ½ Equation 4
 I – 1
I – 1
= the estimate of the standard deviation of the variable, xm, about its mean.
Albano et al. state that “standardization of each subset separately gives better resolution in latent variable modeling of subsets”. (Albano et al., 1981)
- Auto-scaling
Combination of column centring and standardization is known auto-scaling. It can be represented by Equation 5 (Meloun M. et al., 1992):
zim = (yim – yi) / sm Equation 5
- Chemometric Analysis
The doubled centred matrices will be imported into the software that cans multivariate analysis and experimental design. The processed matrices will produce the resultant PCA scores plots, loading plots and fuzzy clustering tables.
- Multi-criteria Decision Making (MCDM)
The multivariate analysis method (PROMETHEE and GAIA) will find the relationships between the objects and variables severally. The matrix data will then undergoes packaging for decision making.
- Chemometrics
Chemometrics helps in analysis of spectral data by solving the calibration problem. It uses statistical and mathematical methods to correlate quality parameters to analytical instrument data. The data will be observed and recorded. Then, patterns in data will be brought out and modeled. The modeled patterns will be used for data analysis in future. (Einax J.W. et al., 1997)
6.3.5.1 Principal Component Analysis (PCA)
PCA is a well-known pattern recognition method for pertaining to any procedure involving multivariate (two or more variables) data analysis problems. Identification and discrimination of the objects can be obtained with the help of PCA whereby it is a data reduction technique. Data reduction technique is when the information is sorted into a data matrix using selected variables that define the columns and rows which was designated with sample measurements.
PCjk = aj1xk1 + aj2xk2 + … ajnxkn Equation 6
Where;
PCjk = value for object k and principal component j
aj1 = variable 1 on object k value
xk1 = variable 1 on component j measurement
n = original variables total number
6.3.5.2 SIMCA (Soft Independent Modeling of Class Analogy)
 Classification is defines as the process of categorizing something according to same qualities or characteristics. SIMCA is supervised method for classification of data. The method requires a training (test) data set consisting of samples where their origins are known. PCA is used to develop a model of each class within the test set. The users will select the members of a set. A model can be representing by the equation (Chatfield C., 1980):
Xki = Xi + + ajiujk + eki Equation 7
Where;
p = number of the principal components in the class model
eki = residual value of object k on variable i
- Gant Chart for Research Timeline
|
Year |
2015 |
|||||||||
|
Month/ Activity |
Feb |
Mar |
Apr |
May |
Jun |
Jul |
Aug |
Sep |
Oct |
Nov |
|
Planning |
||||||||||
|
Proposal |
||||||||||
|
Sample Collection |
||||||||||
|
Material Preparation |
||||||||||
|
Experimental Procedure |
||||||||||
|
Spectral Processing |
||||||||||
|
Chemometric Analysis |
||||||||||
|
Calculating Data |
||||||||||
|
Categorizing Data |
||||||||||
|
Writing Report |
||||||||||
|
Report Submitted |
- Expected Results
The research regarding human scalp hair resulted in new database on human hair according to their age group for woman, Malay. With the help of chemometrics method the human hair database can be created. The data obtained from Fourier-transform Infrared Spectroscopy which was then analyze and modeled through chemometrics and the new database is set. In the database, the human hair was classified according to their age group and the composition that differs the age. Through the research, it shows that in human hair the amount of amino acid (protein) differs. As the age increase, the amounts of amino acid (protein) decrease and as the age lower the amino acid (protein) higher.
9.0 Conclusion
This study is proposed to help creating a new database besides furthering investigation on human hair as physical evidence. Theory of physical evidence can be quoted from Locard’s Principal which stated that “every contact leaves a trace. Physical evidence cannot be faulty; it can’t perjure itself, and it always present. Only human failure to study, explore and understand it can diminish its worth”. Furthermore, fibers evidence is often found at the crime scene. Thus, in creating this new database it can aids in forensic process. The human hair samples that was obtained from different age group (20-30, 31-40, 41-50, >60) but same gender and race undergoes FTIR spectroscopy to detect the amount of amino acid (protein). The data was then was analyze using chemometrics. In short, it can be concluded that the amount of amino acid (protein) is inversely proportional to the age group.
Cite This Work
To export a reference to this article please select a referencing stye below:
Related Services
View all


DMCA / Removal Request
If you are the original writer of this essay and no longer wish to have your work published on UKEssays.com then please click the following link to email our support team:
Request essay removal