Preparation and Examination of Metallographic Samples
| ✅ Paper Type: Free Essay | ✅ Subject: Chemistry |
| ✅ Wordcount: 2494 words | ✅ Published: 18 May 2020 |
Preparation and examination of metallographic samples
Introduction
Experimental procedure
To be able examine and prepare the metallographic samples you have to follow the following steps. To start of you check whether it is magnetic so that you can eliminate lots of materials straight away as you know it’s not a ferrous material, if isn’t magnetic e.g. not aluminium or magnesium. Also, you can look at the colour for example you tell that it’s not copper or brass if it’s a silver colour.
To start of you start by placing your sample in a Bakelite phenolic resin (conductive has graphite is used when looking under a SEM and non-conductive is used for just optical microscope)this done so you keep the sample flat (so that you are able to look at it under the microscope) and be able to grind and polish your sample without hurting your fingers. You do this by placing the sample within a mounting machine. Which has a heating tube which has a mount that is moved up and down by hydraulic press. The machine has a built-in water cooler. First you put a anti stick powder down on to the surface of the mount. You place the face that you want to polish face down into the machine. Then you lower the plate down to the bottom of the tube, then place 25, 30 ml of Bakelite resin onto the sample. The Bakelite resin is a thermoset material, so it won’t re-melt. The place some parting powder over the top and then place the lid on and tighten. But loosen by half a turn as it is being put under heat and pressure. A 20kn force is applied and is heated up to 180c. at around the 100/120c the material starts to melt, and the resin starts to move so the hydraulic press moves the bottom plate upwards. And this takes about 3 and half minutes. Then water is sent around the tube to help cool the material which takes about a minute and a half afterward stake the sample out of the machine.
Afterwards you physically polish the surface of the sample, due to the being a small amount of resin on the top of the surface and to remove scratches on the surface. You physically polish them by using a hand grinder/linisher. On the belt is silicon carbide paper starting at a 240-grit paper to a 400, 800,1200 grit, which means per square inch there is 80 pieces of carbide. You do this until you cannot see any more scratches. You place water on at the top of the grinder so that it removes any excess resin. Then wash the sample barehand in water. Then turn the sample 90 degrees to the direction of the silicon carbide paper. Once you have done this with each of the different grits and washed between each grit paper. To wash and dry the sample you place the sample under water and then add some liquid soap and wash it. To remove the water, add alcohol (methylated spirit) to wash the sample and then dry it with a hair drier and then check under a microscope to check that there are no scratches and that they are all running in the same direction.
Afterwards you use the diamond polish to get the sample to a 1-micron finish. Start by placing the 6-micron finishing wheel and then place 6-micron diamond solution, work this into the wheel and then turn the wheel on and press down hard upon the diamond wheel and rotate the sample in the opposite way that the wheel rotates. Then do exactly the same with the 1-micron polish wheel. Between each of the two polishes and if you drop the sample wash the sample again using soap water and methylated spirit. Then use the microscope and check that there are no scratches left. The black dots have you can see are either porosity or inclusions.
Then there is one last step left before the sample is ready. The next step is etching, this is used to bring the grain structure up. You use the different etches for different materials. For example, for steel like this sample you use Nital 2% (nitric acid and alcohol).
We etch the sample for 2-3 seconds then wash the sample in water and then clean with methylated spirits. If the etching had worked, it would make the sample dull.
Then you take the sample to the microscope and focus the sample at the lowest magnification and then keep going up the magnification to get the focusing of the sample at the highest clearest magnification with the best resolution. Then take a picture of the sample using the camera attached to the microscope. Then add annotations to the pictures and labels.
Results & discussions
Aluminium-Silicon alloy
Figure 1 (below) 15%silicon (primary silicon in [alpha +Si] Eutectic)

Aluminium silicon phase diagram [1] 
For aluminium-silicon alloy we took a picture of one sample at 15% Si, primary silicon (alpha + silicon) eutectic. This alloy has been etched in Sodium Hydroxide. We can use both the microscope picture and the phase diagram to compare them against each other. The 15% silicon has primary silicon, in (alpha + silicon) eutectic. The alpha phase is the white/ light parts of the figure 1. In figure 1 you can see the silicon flakes are the larger darker grey regions in the picture. The eutectic region on the phase diagram can be seen in the micrograph which is the matrix structure, within the silicone phases the darker slightly larger parts being silicone in eutectic. This silicon is formed in a cuboidal form, this happens within a non-lamellar eutectic part.
Brass
Figure 2a (below left)70-30 brass figure 2b (below right) 60/40
(alpha and annealing twins). (alpha gold, beta not gold parts)


Brass phase diagram [2]

For the brass alloy we look at two different two different alloys the first brass in figure 2a is a 70-30 brass with alpha and annealing twins. The second alloy in figure 2b is a 60/40 brass. Both of these samples have been etched in ferric chloride.
The first sample 70/30 sample contains 70% Copper and 30% Brass. As it is 30 % brass on the phase diagram at that part and look the microstructure. In figure 1 you can see the annealing twins and the alpha phase. This picture shows that the sample is in an alpha phase due us comparing it to the brass phase diagram, in the figure 2a we can see the different variants in colour which is caused by the microscope’s ability and the quality of the microscope. Also, there is another part to figure 2a, which is the annealing twins which we can see this is most likely caused by recrystallisation of a deformed cubic close packed metal.[5]
Figure 2b shows the second brass sample which is 60/40 brass, which contains 60% copper and 40% zinc. So, for this sample you look along the 40% mark on the phase diagram. From this we can work out that sample is within a beta phase but will also have a little bit of alpha within the phase, you can see the alpha parts in figure 2b which are the small light areas in the microstructure. The large, dark areas are beta brass.
Copper silver phase diagram
Figure 3a (below left) 70/30 Figure 3b (below right) 72/28
(cored alpha in eutectic and porosity). (All eutectic and colonisation)


Figure 3c (below) 90/10
(beta, eutectic and porosity)
Copper silver eutectic phase diagram [3]

For the copper/silver alloy we check 3 samples figure 3a 90/10, beta, eutectic, porosity. The second sample figure 3b 72/28, all eutectic, colonisation which has fine and coarse parts. The third sample is 70/30 which has a cored alpha in eutectic, porosity.
Looking at figure 3a, the 90/10 copper silver alloy we can look at the phase diagram and determine the structure of the alloy, which we can see that it consists of a large beta phase and a large eutectic phase, as you can see in figure 3a you can see the beta phase which is the light parts and the eutectic composition within this part of the alloy which is the darker spots
Looking at the figure 3b (the second sample) and the phase diagram we can determine the structure and composition of the alloy, as figure 3b has an all alpha + beta eutectic composition. Therefore, you can see from the phase diagram that the eutectic temperature is around 779C. From this we can determine that the phase is fully eutectic, within the figure we can see the course and the fine grains which is often known in colonisation. The fine grains that can be seen in figure 3b, are the first parts of the alloys to form, the coarse and larger grains form second.
The third sample of copper silver sample is a 70/30 alloy we can see this in figure 3c. by looking at the microstructure and the phase diagram, at above 70 wt%, we can see on the phase diagram that sample contains both alpha and beta eutectic, as seen in figure 3c you can see that the sample has more beta than it does alpha in the eutectic region of the sample. When you look at the phase diagram you determine that the eutectic has alpha and beta within it so when we look at figure 3c we can see that beta in the eutectic is the smaller light areas within the sample and that the darker areas are the alpha. As you can see that in figure 3c you can see around the larger copper spots are surrounded by a black ring which is the alpha around the cored sample.
Cast iron
Figure 4a (below left) grey. Figure 4b (below right) white
 Graphite flakes in pearlite matrix Fe/Fe3P eutectic. Pearlite dendrites, cementite-rich Ledeburite (pearlite +cementite) matrix


Figure 4c (above left) pearlitic figure 4d (above right)
Spheroidal graphite. Matrix of pearlite. 0.4WT% medium carbon steel micrograph
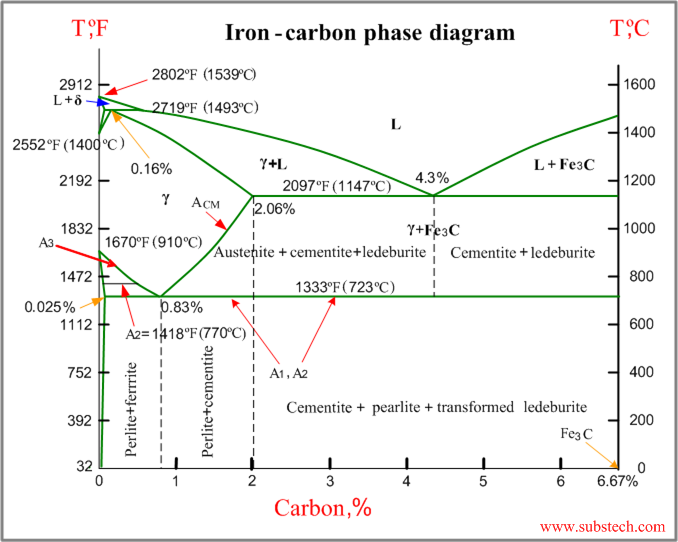
Iron-iron carbide phase diagram [4]

For the cast iron samples, we have 4 of them, firstly grey cast iron which is figure 4a, which has graphite flakes in pearlite matrix, Fe/Fe3P, secondly white cast iron which is figure 4b which contains pearlite dendrites, cementite-rich Ledeburite (pearlite + cementite) matrix. Thirdly pearlitic which is Figure 4c which contains Spheroidal graphite and a Matrix of pearlite. Fourthly figure 4d (above right). 0.4WT% medium carbon steel picture.
The first sample, grey cast sample we can see on figure 4a the Graphite flakes in pearlite matrix and the iron phosphate eutectic. In the structure there is a large amount of alpha which when we read the phase diagram, we can determine that the alloy sample is most likely in the 2.06-4.3% where it below the eutectic point. The pearlite comes from the large amounts of carbon content in grey cast iron. The grey cast iron is seen a dark flake within the microstructure, the pearlite and cementite is within the sample. When you look at the phase diagram you can determine that the sample contains phosphorous, this phosphorous leads to eutectic being formed which forms ferrite and iron phosphide.
The second sample Figure 4b a white cast iron has pearlitic, Spheroidal graphite.
Matrix of pearlite. White cast iron has no alloy addition, from figure 4b we can see the structure has ledeburite which is a mixture of both pearlite and cementite which creates a matrix.
The third sample figure 4c is a pearlitic cast iron. This sample is similar to grey cast iron as it contains graphite. The graphite is in a spheroidal form in the sample and as you can see in the figure 4c you can see that the matrix surrounds the graphite, the graphite is the dark spots upon the sample. By comparing this to the phase diagram we can see that this has a carbon content of approximately 1.7 to 3.7 wt% of carbon. Also, you can determine the that the graphite surrounding the graphite is pearlite.
The final steel sample is medium carbon steel seen in figure 4d. this is the sample that we prepared in met 1. This has a low amount of carbon when it is being compared to phase diagram, you can see this as you can see the ferrite and pearlite within the sample as it has no carbon or graphite. Also, you can see the lamellae structure which are the dark areas on the microstructure picture. Also, you can see inclusions on the photograph.
Conclusions
From this report we can conclude that looking at both a phase diagram and the pictures that are taken from the microscope we can compare them against each other and compare them to other literature and online, to help understand the composition, structure and how the alloy was made up. From this research and comparisons, we are able to label the samples of their structures, example its alpha, beta and porosity parts to the sample. This ability to be able to compare the phase diagrams and pictures is a very useful tool to be able to have industry as you would be able to see and change how the sample is made, to be able to make the sample it something stronger/ better mechanical properties.
Reference
[4] http://www.substech.com/dokuwiki/lib/exe/fetch.php?w=&h=&cache=cache&media=iron-carbon_diagram.png
Cite This Work
To export a reference to this article please select a referencing stye below:
Related Services
View all


DMCA / Removal Request
If you are the original writer of this essay and no longer wish to have your work published on UKEssays.com then please click the following link to email our support team:
Request essay removal