Nitrogen Presence in Drinking Water in Windsor- Essex
| ✅ Paper Type: Free Essay | ✅ Subject: Chemistry |
| ✅ Wordcount: 5359 words | ✅ Published: 18 May 2020 |
EXECUTIVE SUMMARY
The population of Windsor Essex region is increasing year by year so the food demand is also following the same trend. According to the report by Essex County Federation of Agriculture’s in the year 2006 the Windsor region consists of 3 percentage of total Ontario’s farmland. To cop up with this increasing demand, the more fertilizers are used to elevate the production. It was revealed that around 60 million of nitrogen-based fertilizers are used every year. These synthetic fertilizers have negative impacts on the environment and can be easily passed to ground-level water. Due to the field runoffs, the nitrogen oxide transported to the water bodies like rivers, lakes, and ponds.
The nitrogen oxide contaminates the water bodies; which affects the water species and also cause drinking water issues. This decrease water transparency and cause smell. The drinking water from these sources causes many health issues like low concentration, less urine production and fatigue. Our solution to control the nitrogen rise in the marine ecological system is to adopt the intercropping method of farming.
The following report provides a solution to manage the marine nitrogen cycle in the Windsor region. It will also point out the reason for the imbalance in nitrogen cycle and need to take appropriate action to manage the nitrogen cycle. The solution of using intercropping is ideal for the Windsor region for the following reasons:-
- Windsor region has a large number of farmlands
- In intercropping method, there is less need for fertilizers
- Increase in the overall production
- The simultaneous growth of two different products
- Intercropping is more economical
Intercropping is expected to cost approximately around 1540 dollars per year. The total process is broken down into seven steps which are very easy to implement. The total time of the project depends upon the time taken by wheat and fava bean from planting to harvesting. The implementation of this solution will decrease the amount of nitrogen oxide released to the water bodies which further leads to clean and healthier marine ecological cycle.
Table of content
EXECUTIVE SUMMARY………………………………………………………………………..2
List of Tables………………………………………………………………………..…………… 4
List of Figures………………………………………………………………………..…………… 4
-
Introduction…………………………………………………………………..………………. 5
- Agricultural aspect……………………………………………………………………..… 6
- Recent problems in Windsor-Essex country…………………………..…………………. 6
-
Background and Literature Review………………………………………………..………….8
- Effects of Nitrogen Oxide OnWater…………………………………..………………….8
- Balance of Nitrogen Cycle in Water………………………………..……………………. 9
- End of pipe treatment……………………………………………………………………… 9
- Livestock Manure……………………………………………………………………….10
- Intercropping……………………………………………………………….……………10
-
Requirement and criteria………………………………………………………………….….11
- Requirement for intercropping farming…………………………………………….……11
- Criteria………………………………………………………………………….……….11
-
Proposed Solution…………………………………………………………………….………12
- Methodology…………………………………………………………….………………12
- Results…………………………………………………………………….……………. 13
- Implementation………………………………………………………………………… 14
- Cost Analysis…………………………………………………………………………………20
- Timeline………………………………………………………………………………………21
- Conclusion and recommendation…………………………………………………………….22
- References……………………………………………………………………………………23
List of Tables:
Table 1: Soil mineral nitrogen (NH4+ and NO3-, mg kg -1 dry soil) at 0-15 cm…….14
Table 2: Soil types and conditions…………………………………………………….15
Table 3: Climate Description………………………………………………………….16
Table 4: Cost analysis…………………………………………………………………20
List of Figures:
Figure 1: Nitrogen cycle………………………………………………………………. 5
Figure 2: Lake Erie……………………………………………………………………. 7
Figure 3: Lake Erie……………………………………………………………………. 7
Figure 4: Intercropping method shown after 20 days of sowing………………………17
Figure 5: Intercropping method shown after 60 days of sowing………………………18
Figure 6: Intercropping method shown after 100 days of sowing……………………. 19
- Introduction:
The nitrogen cycle refers to the basic need of living things: Energy. Starting from the baseline of the ecosystem, where atmospheric gases and nutrition for the primary ecosystem are in equilibrium. In the ecosystem, biotic and abiotic components are in balance; in terms of energy cycles and nutrition. Primary ecosystem synthesizes energy by photosynthesis and convert it into nutrition. Further, producers (primary ecosystem) transfers energy to the consumers (secondary ecosystem), and consumer transfers it to the decomposers (tertiary ecosystem) and cycle completes. In the marine ecosystem, the nitrogen cycle is complex among all biogeochemical systems. [1]
Marine nitrogen cycle has the following main steps:
- Nitrogen fixation
- Assimilation
- Nitrification
- Remineralization
- Denitrification
As on the earth and air, nitrogen is the abundant element. From atmospheric air nitrogen gas in the form of N2 dissolve into water. Unfortunately, this form of nitrogen cannot be used by living life form, due to its inactivity to other substances. Few microbes and single-celled prokaryotes take the dissolved nitrogen gas and convert this gas into some useful biological forms such as ammonium (NH4+). This process is called nitrogen fixation. The microorganism consumes this ammonium and by this step nitrogen in another form transfer to living cells. This step is known as assimilation. In nitrification microorganism such as rhizobium, azotobacter, diazotrophs transform ammonium to nitrite (NO2-) and then further to Nitrate (NO3-). In the process of remineralization, some organism converts some of the organic nitrogen to ammonium. As like nitrification, denitrification is important to complete the cycle. Denitrification is done by denitrifying bacteria over the fossils of secondary and tertiary consumers. As nitrogen shift back to the atmosphere cycle completes. [2]

Figure – 1 Nitrogen cycle [3]
Nowadays there is a significant imbalance in the nitrogen cycle. The different human activities add more nitrogen to water bodies than naturally fixed amount day by day. The main sources are
- Agricultural sources
- Non-agricultural sources
1.1. Agricultural aspect
For eliminating mass starvation, it is needed to make agriculture more effective. But, boosting agriculture needs fertilizer; as plants needs nitrogen we have to synthesize it from the atmosphere. Finally, as much we drove nitrogen from the atmosphere, we put it back in the system in another molecular structure, which creates imbalance. To increase production, each year around 100 Tg of reactive nitrogen is being spread to fields. By using more fertilizer, we contaminate groundwater and another source of water (in the sense of agriculture and non-agriculture runoff). Other sources of nitrogen emissions are non-agriculture ones such as from fossil fuels, industries, burning of woods and from the clearance of grassland and forests.
When nitrogen contamination increases in the water resources, growth of phytoplankton (algae) increases, which uses oxygen in water and disrupt marine biology. By this reason total dissolved solids surpass government regulations, so that source of water is been contaminated. In Windsor region agriculture wastewater dumped in Detroit river. There is a survey carried out by the Ontario state government in 2012, results are unbelievable. They spilled benzene and salt in Detroit River in two phases and they got 50% more volume than they spilled (solution of benzene and salt) in the river, which clearly indicated that percentage of nitrogen solvents are much more than they expected. [4]
1.2. Recent problems in Windsor-Essex country:
According to the Ohio based environmental group in year 2017, there is heavy rainfall in Windsor region before summer. This prior rain results in delay in the planting of crops and distort the timings of fertilization. Due to high rainfall, the level of nitrogen and phosphorus in lake Erie increases. Due to this hike, there are blue-green toxic algae blooms in the lake. The water quality is significantly decreased.
Due to large runoff from fields, a bacteria named as Cyanobacteria blooms in Lake Erie. The growth of this bacteria is so large that in the shallow water of lake it consumes all the oxygen from the lake. This results in the dead zones within the lake. This bacteria produces harmful toxins, which does not support life and a great threat to Marine ecological system, municipal drinking water intakes.


Figure- 2 Lake Erie [5] Figure- 3 Lake Erie [5]
Excessive nitrogen in the diet may lead us to build more proteins, which leads us to Uraemia, loss of concentration, low urine production, fatigue, etc. it can be categorized as excessive nutrition pollution (phosphorus and nitrogen), which is the biggest problem in North America. [6]
- Background and Literature Review:
According to the researches, the marine nitrogen cycle is the complex among all the ecological cycles and it is most distorted ones. There is a continues rise in the population across the world. To balance the excessive demand for food, more nitrogen-based fertilizers are currently in use. To enlarge the productivity, there is decline diversity of local plants. Lots of research have been conducted to find the causes of loss of this diversity and “based on an analysis of greater than 1000 species responses from 34 N-fertilization experiments across nine terrestrial ecosystems in North America, we see that both of the mechanisms- one that affects the traits or other that does not, operate simultaneously to influence diversity loss as production increases.” [7]
From one publication by Mark E. Fenn et al. it has been revealed that there are really bad effects of distorted nitrogen cycle on North America. It is believed that forests in North America usually remain limited in nitrogen content, but from their recent studied it has been shown that due to over-fertilization of arable land there is excess content of nitrogen. “Symptoms of N saturation in North America are particularly severe in high elevation, non-alleviated (no deposition of soil deposited by running water) spruce-fir ecosystems in the Appalachian Mountains and in eastern hardwood watersheds at The Fernow Experimental Forest near Parsons, West Virginia.” [8]
In 2002 Thomas Richmond Community in St. Thomas issued drinking water advisory because of high nitrogen concentration in water bodies. By declining the concentration of nitrogen, concentration of sodium increases in water. That leads them to publish another advisory for people to diminish sodium diet. Although the problem had been solved but sodium advisory is compulsory and nitrogen cycle is still declining. [4]
This excessive use creates the imbalance in the nitrogen cycle in air and water bodies. Due to heavy rainfalls and runoffs, the nitrogen oxide present in fields comes to the water bodies. In the near future, the excessive amount of nitrogen oxide will be a severe issue. This nitrogen oxide also encourages the hydrogen ions in soils which results in more acidic soil. This nitrogen oxide generally acts as the negative charge and it usually takes away the positive charged calcium and other minerals from the soil and makes it less fertile. “As calcium is depleted and soil acidified, aluminium ions are mobilized; eventually reaching a toxic concentration that can damage tree roots or kill fishes if the aluminium washes into streams [9]”
So the marine biodiversity is in danger. Due to fertilization, the short-living species like Perennials which helps in nitrogen fixation are on the verge of extinction. The excessive washout of nitrogen to the lakes and other water bodies nowadays is among major problems in North America.
2.1. Effects Of Nitrogen Oxide On Water
The excess abundance of nitrogen and minerals into water bodies due to large runoffs results in eutrophication. Eutrophication results in the growth of algae in water bodies. The excessive algae increase phytoplankton growth.
Due to algae and phytoplankton, there is oxygen depletion in water sources which affects the marine biological cycle. The 600,000,000 tonnes of fertilizers were used in fields. The eutrophication results in the following consequences:
- The decrease in marine biodiversity
- Increase in toxicity of water
- New species invasion
- A decline in dissolved oxygen
- Decline in water transparency
- The smell and color of water changes
-
Decline in number of marine species
- Balance Of Nitrogen Cycle In Water
To balance the nitrogen cycle in marine ecological system the first step is to control the input of nitrogen oxide to the water. This can be done by controlling the nitrogen based fertilization. According to the Essex county federation of Agriculture report in the year 2017 it was revealed that Windsor consists the 3.0 percentage of total Ontario’s farms. The total number of farms are considered to be around 1740. All the farms are using chemical based nitrogen fertilization which can damage water, soil and air. So to save the nitrogen cycle in marine ecological system the best method is to switch to the other possible ways of fertilization and farming.
“Essex County is the biggest and most concentrated nursery developing zone in Canada. Starting at 2006, the latest details posted by the Essex County Federation of Agriculture, there were 5,494,164 square meters of nursery zone under glass or plastic in Essex County. That speaks to 47 percent of Ontario’s complete real estate. Essex County has 1,740 absolute ranches, around 3 percent of Ontario’s aggregate for that year. More than 1,000 of these ranches are essentially oilseed and grain crops. The atmosphere of Essex County takes into consideration various natural product creation. Apples (1,584 sections of land), grapes (1,130 sections of land), peaches (343 sections of land) and strawberries (80 sections of land) are the significant organic product yields developed in 2006.The real vegetable harvest developed in Essex County is field tomatoes with 5733 sections of land underway in 2006.” – Courtesy Essex County Federation of Agriculture
Some of the solution to balance the nitrogen cycle are given below:
- End of pipe treatment
- Livestock manure
-
Intercropping
- End of pipe treatment
The end of pipe treatment is used in urban and industrial storm-water treatment. In this technique some treatment is given to the water before it is discharged to the waterbodies. The urban water treatment consists of the following steps
- Ion-Exchange
- Reverse osmosis
- Disinfection
- Filtration
In the year 2001 in southwest Ontario the study was carried out on the different end of pipe treatments. In the study of a farm, the farm was divided into two parts. One is treated by the conventional way and other part had end of pipe treatment. The later results in the increased productivity and high water quality. The nitrate concentration was reduced by 41% and the nitrate loss in tile drainage water was reduced by 36% by end of pipe treatment. [10]
2.4. Livestock Manure
The main source of imbalance of marine nitrogen cycle is nitrogen based fertilization. Livestock manure can be used as the alternative disposal operation. In this technique, creature composts have been taken care of as a strong and were either saved legitimately to pasture by the creatures or gathered alongside the bedding utilized in the creature safe house and connected to arrive as a harvest supplement. [11]
2.5. Intercropping
Intercropping is the agronomic routine with regards to growing at least two yields in a similar field at the same time. Harvests might be planted regardless of columns, in substituting lines, or with various yields rotating inside a similar line. Transfer intercropping alludes to the planting of one intercrop animal categories before another with the goal that their life cycles halfway cover. [12]
- Requirement and criteria:
3.1 Requirement for intercropping farming:
Intercropping is less expensive than conventional farming. Intercropping can be helpful for quite a while in light of the fact that it has its own ecological advantages
It is expected to keep the land free from all substances that are confined to utilize,
For example, Pesticides with nitrogen content for a base three years before yield collecting. If a farmer uses precluded substances in a field and develops the wheat in the same field in the next years then wheat can’t be said as natural one since it can’t be considered as free from pesticides. Spread harvests and natural fertilizer (produced using treated the soil dairy animals compost, contains nitrogen to help plants flourish) are utilized to keep up soil natural issue and richness.
3.2 Criteria:
- Solution must give reduced level of nitrogen content in soil.
- It should not affect the yield of crop.
- It is must to acknowledge farmers as well as stakeholders how to implement solution.
- It must be cost effective as well as it is easy to implement.
- Proposed Solution
After analyzing and evaluating possible solutions on specified criteria, we selected to implement intercropping method in agriculture to reduce nitrogen enrichment in soil. Intercropping is defined simply as a growing two or more crops types on one field. Intercropping has many benefits such as it gives diversity and stability to fields and reduces fertilizer applications. Intercropping also compliment in sharing of nitrogen from N – fixing plants.
Using intercropping method to fix nitrogen content in agriculture:
- Nitrogen based fertilizers are the main source of accessing nitrogen in the agriculture, which ultimately runoff in river. The nitrogen and phosphorous enrichment in river results in algae blooms and contaminate drinking water.
- Intercrop plots had higher land efficiency, improved grain and biomass quality, expanded vegetable nodulation (a swelling on a leguminous root that contains symbiotic bacteria) and percent N got from harmonious N2 obsession.
- Wheat-fava bean in the 1:1 game plan showed a half increment in land profitability.
- Grain pea in the 2:1 game plan likewise had the most astounding all out land yields and land proportional proportion (1.32). Wheat-fava bean in the 1:1 course of action fixed the most astounding measure of nitrogen, moved the most N (13% of N in wheat), and gathered more C (26% higher than wheat monoculture) in shoot biomass.
- Water Use Efficiency (WUE) of wheat was improved when developed with fava bean.
- Pea in intercrop plots likewise shown expanded nodulation (27-45%) and iii harmonious N2 obsession (9-17%) prompting the expansion of 60-78 kg N ha-1. The gross ecosystem photosynthesis (GEP) and net ecosystem productivity (NEP) were most noteworthy in the 2:1 game plan and prompted the most elevated daytime C sequestration (229 mg C m-2 hr-1).
- We exhibited that intercropping little grains with vegetables, in explicit spatial courses of action and under low info natural conditions, can counter ordinary monoculture-related Soil Organic Carbon (SOC) and Nitrogen (N) misfortunes through higher land and environment efficiency, what’s more, more prominent natural N-obsession and move. [13]
4.1 Methodology:
- Research plots (4m x 3m) were spread out in a randomized total square structure with five medications and four replications for each harvest blend.
- Medicines comprised of wheat and beans developed as monocultures, and wheat cv. ‘Red’ intercropped with either a typical bean cultivar, or a fava bean cultivar in lines of 1:1, 2 wheat:1 bean and communicate courses of action.
- In monoculture, wheat and beans were planted in columns at the prescribed plant densities.
- Line intercropping comprised of planting wheat and bean at 30 cm dispersing in interchange lines of 1:1 focusing on 150 wheat and 12 bean plants, and in 2:1 line game(figure 4).
- There was a hole at any rate 50 cm wide between plots to limit treatment communications, and 1meter wide hole between squares to encourage the board.
- Bean seeds were immunized with business rhizobia and planted right away. Wheat and basic bean cv. ‘Dark Turtle’ were planted in mid-May (15-16 May) in columns utilizing by manpower with customizable sprockets and seed plates (G-12 for wheat and AA-6 for BT) while basic bean and fava bean were hand seeded that day.
- Planting profundity shifted with seed estimate and ran from 3-4 cm for wheat and 5-6 cm for beans. No manures, pesticides or fungicides were utilized all through the developing season. [13]
4.2 Results:
- Pre-plant plots were homogenous and indicated uniform conveyance of soil mineral N (Table 3).
- Soil tests taken after conclusive reap (Fall-2012) demonstrated monoculture fava bean cv. ‘Ringer’ plots showed the most astounding soil mineral N balance (+0.7 mg NH4+ and +6 mg NO3-kg-1 dry soil) contrasted and normal bean cv. ‘Red Kidney’ (+0.4 mg NH4+ and +4 mg NO3-kg-1 dry soil) or ‘Dark Turtle’ (+0.5 mg NH4+ and +3 mg NO3-kg-1 dry soil) plots.
- Both N pools declined in the wheat monoculture plots (-0.9 mg NH4+ and -5.8 mg NO3-kg-1 dry soil) (Table 3). Wheat-regular bean intercrop plots showed a more positive N equalization contrasted with wheat monoculture plots (Table 3).
- The wheat-fava bean cv. ‘Ringer’ blend in 1:1 course of action was the main plot that demonstrated the most elevated mineral N balance (+0.2 mg NH4+ and +1.1 mg NO3-kg-1 dry soil) contrasted with all other intercrop mixes.
- The normal difference of nitrogen radical (15) benefits of nodulating vegetables developed in without media were -1.34 % (fava bean cv. ‘Chime’), -1.04 % (basic bean cv. ‘Dark Turtle’) and -0.97 % (regular bean cv. ‘Red Kidney’) while the non-fixing wheat reference plants developed in field as monoculture had normal difference of nitrogen radical (15) estimation of 2.87 % (information not appeared).
- There was adequately a huge distinction between soil difference of nitrogen radical (15) (3.74 %) and barometrical difference of nitrogen radical (15) (0 %) so as to gauge weakening impacts as proposed by Shearer and Kohl (1988). [13]
|
Treatments |
Before Planting (BP) |
After Final Harvest (AH) |
Mean Difference (AH-BP) |
|||
|
NH4+ |
NO3– |
NH4+ |
NO3– |
NH4+ |
NO3– |
|
|
Wheat-common bean cv. ‘Red Kidney’ combinations |
||||||
|
RK Monoculture |
4.3 |
25.0 |
4.7 |
29.0 |
0.4 |
4.0 |
|
Wheat-RK (1:1) |
4.0 |
27.0 |
3.8 |
26.1 |
-0.2 |
-0.9 |
|
Wheat-RK (2:1) |
4.3 |
26.3 |
3.9 |
23.8 |
-0.4 |
-2.5 |
|
Wheat-RK (mixed) |
3.3 |
25.7 |
2.9 |
24.5 |
-0.4 |
-1.2 |
|
Wheat Monoculture |
4.1 |
28.6 |
3.2 |
22.8 |
-0.9 |
-5.8 |
|
SEM (±) |
0.34 |
0.99 |
0.47 |
1.13 |
0.10 |
0.59 |
|
LSD0.05 |
NS |
NS |
1.34 |
3.21 |
0.28 |
1.68 |
|
Wheat-common bean cv. ‘Black Turtle’ combinations |
||||||
|
BT Monoculture |
3.3 |
28.0 |
3.8 |
31.0 |
0.5 |
3.0 |
|
Wheat-BT (1:1) |
3.0 |
26.0 |
2.8 |
24.9 |
-0.2 |
-1.1 |
|
Wheat-BT (2:1) |
3.0 |
27.7 |
2.7 |
26.1 |
-0.3 |
-1.6 |
Table- 1. Soil mineral nitrogen (NH4+ and NO3-, mg kg -1 dry soil) at 0-15 cm depth before planting (Spring-2011) and after final harvest (Fall-2012) in monocultures and wheat-bean intercrop combinations. [13]
4.3 Implementation:
Step-1: Soil types and conditions:
- Four irregular composite soil tests were gathered at the season of plot foundation to describe soil richness (i.e., pH, EC, natural issue, all out N, and accessible P, K, Ca, Mg, Fe, Mn,)
- The normal qualities are recorded (Table 1). The dirt was a coarse finished sandy soil of the Bose arrangement (Bertrand et al., 1991) with low to direct richness. Soil was genuinely homogeneous over the test site. The site was not utilized for grain creation in earlier years however was an assigned territory for occasional vegetable development. The land has been overseen under natural rules for more than the 10 years and thusly does not incorporate any disallowed synthetic substances/substances.
|
Sample # |
pH |
Total C (%) |
EC (mmhos/cm) |
Total N (%) |
P (ppm) |
K (ppm) |
Ca (ppm) |
Fe (ppm) |
|
1 |
5.6 |
6.8 |
0.88 |
0.29 |
178 |
240 |
3050 |
25 |
|
2 |
5.4 |
6.6 |
1.28 |
0.32 |
130 |
280 |
3100 |
30 |
|
3 |
5.6 |
6.4 |
0.98 |
0.30 |
162 |
225 |
2600 |
30 |
|
4 |
5.5 |
5.5 |
1.20 |
0.30 |
108 |
200 |
2100 |
25 |
|
Average |
5.5 |
6.32 |
1.085 |
0.302 |
144.5 |
236.3 |
2713 |
27.5 |
Table- 2. Soil types and conditions [13]
Step 2: Climate description:
- Climatic information are abridged for the test site throughout the spring-summer season (June to September) of 2017 (Table 2).
- Normal day-time temperature over the editing season was 17.1°C, with the hottest days in August, while the normal evening time temperature was 14.6°C. The normal day by day soil temperature at 10 cm and 20 cm profundity was 18.9°C and 18.6°C, separately.
- Month to month normal of sun oriented irradiance was 590.3 W/m2.
- The month to month precipitation normal was 61.5 mm with July accepting the least downpour and September getting the most.
- All out precipitation during June to September was 245.8 mm. The 24-hour normal for relative humidity (RH) extended from 73.2 to 83.8 in July and September, separately. [13]
|
MONTH |
mean air temperature (°C) |
Relative humidity (%) |
solar irradiance (W m-2) |
total rainfall (mm) |
||||
|
day |
night |
24 hours |
day |
night |
24 hours |
|||
|
June |
15.1 (21) |
12.8 |
13.9 |
76.3 |
83.2 |
79.7 |
569 (1419) |
57.4 |
|
July |
18.6 (28.9) |
15.8 |
17.4 |
69.7 |
77.7 |
73.2 |
779 (1424) |
6.6 |
|
August |
18.9 (30) |
16.1 |
17.6 |
70.1 |
78.2 |
73.9 |
603 (1345) |
61.2 |
|
September |
15.7 (22.6) |
13.8 |
14.7 |
79.7 |
87.9 |
83.8 |
411 (1188) |
120.6 |
|
Average |
17.1 |
14.6 |
15.9 |
73.9 |
81.8 |
77.7 |
590.3 |
61.5 |
Table- 3. Climate Description [13]
Step 3: Plant based parameters:
- Information were recorded for plant tallness (from soil surface to the tip of apical leaf), number of powerful tillers (heads), days to reap, spike length, seed spike-1, grain yield, 1000 seed weight, collect list, and seed weight to volume proportion.
- Chlorophyll focus file (CCI) was estimated utilizing handheld chlorophyll meter (Model CCM 200 or more, Optic-Sciences Inc., New Hampshire, USA) on the banner leaf and the third leaf during early development organize (30 DAS).
- Spike shading was a determinant of development and considered prepared for collect when spikelet were straw-shaded and 80% of the grains of the spike were in the hard-batter organize.
- The plots were tested by gathering the over the ground biomass from 2 distinct regions of 0.5 x 0.5 m2 inside each subplot, leaving 10 cm stubble. Yield material was dried at 60° C and sifted.
- Grain was ground to fine powder (<0.6 mm) and examined for all out nitrogen, as per the Kjeldahl technique and changed over to unrefined protein levels (%N x 5.8 for wheat and grain, and %N x 6.25 for pea and beans) (Jones, 1931).
- Each example was reproduced thrice. Grain yield, 1000 grain weight, and protein fixations were communicated at 12.5% dampness. [13]
Performance of legumes and vegetables in monocultures and intercropping solution:
 20 days after sowing


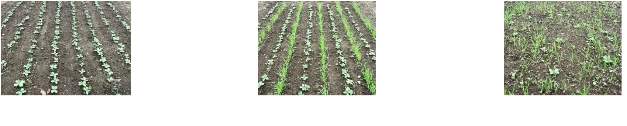 Figure- 4 Intercropping method shown after 20 days of sowing [13]


60 days after sowing


Figure – 5 Intercropping method shown after 60 days of sowing [13]
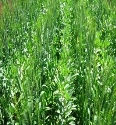
100 days after sowing


Pea monoculture barley monoculture Barley: pea (1:1) Barley: pea (2:1) Barley: pea (mixed)
Figure – 6 Intercropping method shown after 100 days of sowing [13]
- Cost Analysis:
|
Crop: Intercropped Wheat and Fava-bean Production Value |
|
Enterprise Production Budget |
Unit |
Quantity/Hectare |
Price Per Unit |
Cost Per Hectare |
|
Variable Costs Production : Soil Preparation Tractor Oxen Team Planting and Fertilizing Manual Seed Cost Fertilizer Cost Weeding Manual Fertilizer After Planting Hilling + Fertilizer Application Manual Material Cost Pitosanitary Control Fungicides/insecticides Manual Material Cost Herbicides Manual Material Cost Harvest :- Labor Cost Post-Harvest :- Wheat Selection Manual Wheat De-graining Manual Production Interest Total Variable Cost |
Hour Hour Hour Quintal Hour Hour Hour Liters Hour Hour Hour Hour |
15.53 1.78 115.60 175.48 230.52 22.03 25 277.59 1.65 18.94 |
$ 18.40 $ 3.18 $ 1.15 $ 1.15 $ 1.15 $ 1.15 $ 1.15 $ 1.15 $ 1.15 $ 1.15 |
$ (285.75) $ (5.66) $ (132.94) $ (53.58) $ (39.42) $ (201.80) $ (265.09) $ (40.26) $ (25.33) $ (10.02) $ (28.75) $ (5.06) $ (319.22) $ (1.89) $ (21.78) $ (94.68) $ (1531.23) |
|
Price Per Unit |
Cost Per Year |
|||
|
Fixed Cost Tools Hoe Backpack Sprayer |
$ 12.0 $ 60.0 |
$ (3.16) $ (6.46) |
||
|
Total Depreciated Fixed Costs |
$ (9.62) |
|||
|
Total Cost = (1531.23) + (9.62) |
= $ (1540.85) |
|||
Table 4. Cost analysis
- Timeline:
The timetable is urgent in any task, as it helps the city chamber of Windsor to assess the expenses incorporated into finishing the venture effectively. The accompanying advances will be required to finish the venture effectively.
- Project manifesto and presentation – Proposition of game plans that help with the diminishing of nitrogen transmission in Windsor domain and presenting the chart of the endeavor to the organization to get the last support.
- Presenting the project proposal report to the administration – Clarifying in detail the different pieces of the endeavor. Analysis from the organization is in like manner expected at this eliminate to roll further upgrades if suitable.
- Acquiring the assent from neighborhood specialist group – The endeavor would be required to experience the city board of trustees bunch for evaluation and credibility.
- Organizing up the project execution group – A gathering would be required to manage and execute the whole endeavor with the objective that it is done effectively.
- Obtaining the last endorsement from the mayor and city council – Some real approvals would be relied upon to obtain from the school association.
- Building up a money related arrangement to support the venture – A budgetary course of action would be made to get the significant financing for the endeavor.
- Recognizing when the establishment can occur – Since the unit is limited in size, it might be presented in any season in houses.
- Introducing the sustenance squander recycler – Establishment of the nourishment squander recycler in houses in the midst of the finishes of the week or unequivocal time when the owner is open.
- Conclusion and recommendation:
The main purpose of this project is to provide solution for reducing total nitrogen as well as increasing uses of carbon dioxide. We have to maintain the nitrogen cycle in marine ecosystem and also get the benchmark of minimum nitrogen level in drinking water. We stated that main nitrogen input is from farming. For eliminating that increase, we have to make efficient solution in terms of farming. For increasing yield of food grains and minimizing nitrogen content in soil, we can use intercropping method. Which shows necessary reduction in nitrogen content as well as greater growth. Furthermore, intercropping can give two different and simultaneous growth of beans and vegetables too. Cost analysis is quite economical rather than using conventional farming. This method is easy to implement, though it takes time to see results. But on large scale it is effective but it does not affect nitrogen cycle.
Our team recommends to use this method in Windsor-Essex region farms to get better yields and having nature on other hand.
8. References
|
[1] |
K. McMcKague, “Environmental Impacts of Nitrogen Use in Agriculture,” 05 Novembor 2016. [Online]. Available: http://www.omafra.gov.on.ca/english/engineer/facts/05-073.htm. [Accessed 07 June 2019]. |
|
[2] |
J. N. Galloway, A. Townsend, J. Erisman, M. Bekunda, Z. Cai, J. Freeney, L. Martinelli, S. Seitzinger and M. Sutton, “Transformation of Nitrogen Cycle: Recent Trends, Question and Potential Solution,” American association for the advancement of Science, 2008. |
|
[3] |
T. C. f. M. O. R. a. Education, “The Center for Microbial Oceanography: Research and Education,” C-More, [Online]. Available: cmore.soest.hawaii.edu/cruises/biolincs/nitrogen.htm. [Accessed 14 07 2019]. |
|
[4] |
Essex region source protection area, “WATER QUALITY RISK ASSESSMENT,” Essex County, 2015. |
|
[5] |
T. L. F. Press, “Conditions right for blue-green algae bloom in Lake Erie, researchers predict,” 11 07 2019. [Online]. Available: https://lfpress.com/news/local-news/algae-bloom-boom-likely-for-lake-erie-water-quality-researchers-predict. [Accessed 14 07 2019]. |
|
[6] |
United States Environmental Protection Agency, “Nutrient Pollution,” United States Environmental Protection Agency, 2015. |
|
[7] |
N. Katharine, “Functional- and abundance-based mechanisms explain diversity loss due to N fertilization,” 22 March 2005. [Online]. Available: https://www.pnas.org/content/102/12/4387. |
|
[8] |
F. M. A. D. P. J. S. A. T. B. B. D. W. A. D. L. S. G. M. D. F. R. R. S. E. Mark, “NITROGEN EXCESS IN NORTH AMERICAN ECOSYSTEMS.,” 1998. |
|
[9] |
M. V. Pater, “Human Alteration of the Global Nitrogen Cycle: Causes and Consequences,” Ecological Society of America, America, 1997. |
|
[10] |
H. T. C. D. C. a. G. J. Ng, “Controlled Drainage and Subirrigation Influences Tile Nitrate Loss and Corn Yields in a Sandy Loam Soil in Southwestern Ontario,” Elsevier, vol. 90, no. 1, p. 8, 2002. |
|
[11] |
G. N. C. S. Demirer, “Anaerobic digestion of dairy manure in a hybrid reactor with biogas recirculation,” Springer, vol. 21, no. 8-9, p. 6, 2005. |
|
[12] |
C. E. Bach, ” Effects of plant density and diversity in the population dynamics of a specialist herbivore, the striped cucumber beetle, Acalymma vittata.,” JSTOR, vol. 61, no. 6, p. 16, 1980. |
|
[13] |
A. T. J. E. M. B. Z. C. J. F. L. M. S. S. a. M. S. J. N. Galloway, “Transformation of Nitrogen Cycle: Recent Trends, Question and Potential Solution,” American association for the advancement of Science, 2008. |
Cite This Work
To export a reference to this article please select a referencing stye below:
Related Services
View all


DMCA / Removal Request
If you are the original writer of this essay and no longer wish to have your work published on UKEssays.com then please click the following link to email our support team:
Request essay removal