Measuring Binding Constant of Ethidium Bromide (EtBr) to DNA
| ✅ Paper Type: Free Essay | ✅ Subject: Chemistry |
| ✅ Wordcount: 1745 words | ✅ Published: 17 Aug 2017 |
- ABSTRACT:
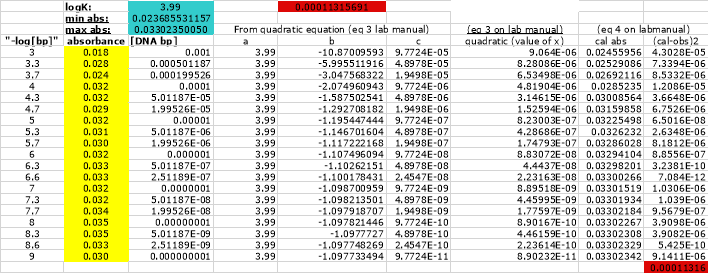
The principle behind this lab experiment was to determine the binding constant of ethidium bromide to DNA using the known concentrations and the calculated value of X obtained from the equation. Ethidium bromide is said to have a high affinity to DNA, therefore, the expected value for the binding constant should be large. Two method were implemented in determining the binding constant of EtBr to DNA. The first method was by inputting the absorbance data using a fixed excel worksheet. The main goal was to manipulate the value in cell I24 to be as low as possible. After several trails and error, the final value of cell I24 was 0.00011316 and logK was 3.99. The second method was by simple manual calculation. The two methods yielded two very different results. By manual calculation the obtained value for K was 37,108.63 M-1, which was indicative that the final EB complex of DNA was larger than that of unbound DNA and unbound EB. The high value of the binding constant (K), demonstrates that there is a high affinity of ethidium bromide to DNA. This correlates to the expected values of EtBr, which are reported to be in between 104 M to 106 M.
- INTRODUCTION:
DNA plays an important role in biological systems being that it contains hereditary materials that is passed on to generations after generations. DNA contains sequences of specific bases within the DNA strands where it stores genetic information that can be readily replicated (Jeremy M. Berg, 2015). It is this sequence that determines the sequence of RNA and other protein molecules and it also transports most of the activities within the cells. “RNA synthesis is a key step in the expression of genetic information” (Jeremy M. Berg, 2015, p. 859). DNA is more than just a source of sequence information, but it is also the platform where binding proteins collate. This is an important factor for the development of many clinical drugs. The structure and function of drug targets are the basis for designs of effective and specific inhibitors. Though to be considered effective, the target drugs must bind to the enzymes or receptors with great affinity and specificity.
Ethidium bromide, (EtBr), is widely used in many scientific laboratories to study the binding properties of DNA. Ethidium bromide is an aromatic dye that slips in between the base pairs of DNA. This binding of ethidium bromide to DNA is a process called intercalation. During this process, the structure of the DNA is changed and the distance among the base pairs in which it directly binds to increases. Resultant in the overall expansion of the dimension of DNA. Ethidium bromide exhibits diminutive base pair partiality containing moderate binding affinity depending on its ionic strength. The intercalation specificity depends greatly on electrostatic interactions and the formation of Van der Waals interactions between base pairs. It has the capability to bind itself to the hydrophobic interior in the stacked base pairs of DNA. However, Ethidium bromide is known to be a very potent mutagen, which is a chemical agent that can cause mutation in DNA cells and other certain diseases such as cancer. It is called an intercalating agent due to its ability to inhibit cell growth, DNA replication and transcription.
In this experiment, we will be measuring the binding constant of the dye, ethidium bromide, using herring testes by method of absorption spectroscopy. “Herring testes DNA (htDNA) is a natural DNA used in studies of DNA binding agents that modulate DNA structure and function” (Sigma-Aldrich, Inc). This method involves titrating a series of solutions varying in DNA concentrations but with a constant concentration of the intercalating agent, ethidium bromide. By implementing this order of magnitude, it is likely to obtain samples with entirely unbound DNA and DNA that is saturated with ethidium. The solutions will run through the absorbance spectrometer at a wavelength of 480 nm. The absorbance measured will be used to calculate the bound ethidium. To determine the amount of bound ethidium the following expressions below is used, given that the information of DÕ• and EÕ• are known; where EÕ• is the total ethidium bromide concentration and DÕ• is the total DNA concentration. This information will allow us to calculate the binding constant of ethidium toward DNA.
The equilibrium:
D + E → C
D = DNA
E = Ethidium Bromide
C = Complex
K = [C] / [D][E](1)
Solve for K:
K = x/[EÕ• – x][DÕ• – x](2)
Kx2 – x(K[DÕ•] + K[EÕ•] + 1) +K[DÕ•][EÕ•] = 0 (3)
Determination of the amount of bound ethidium (amount of complex, C):
Aobs = εb x + εf [EÕ• – x](4)
εb (480 nm) = 2,497 M-1 cm-1
εf (480 nm) = 5,600 M-1 cm-1
- EXPERIMENTAL PROCEDURES:
MATERIALS:
- 2 mM DNA (bp) stock solution with BPES buffer
- 2 µM DNA (bp) stock solution with BPES buffer
- 10 µM stock solution of Ethidium Bromide
- Micropipettes
- Microcentrifuge tubes
- Absorbance spectrometer
PROCEDURES:
Determine the volume of stock DNA solution and the amount of buffer needed for each of the nineteen samples before proceeding. *Refer to data tables*
In the microcentrifuge tubes, make nineteen 1 mL DNA solutions by diluting from the 2 mM, and the 2 µM DNA stock solutions with BPES buffer. Then add 10 µL of ethidium bromide to the nineteen prepared solutions. Mix well and measure the absorbance at 480 nm. Record the absorbance for each of the nineteen solutions and use the information to calculate the binding constant K.
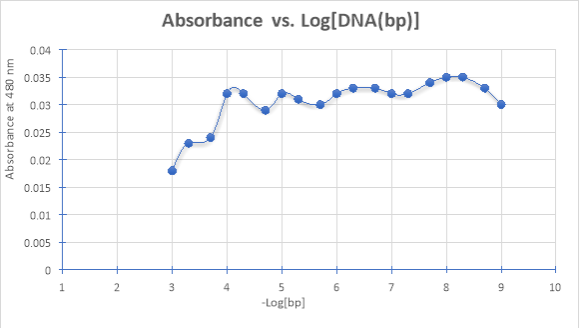
- RESULTS:
- DATA TABLE:
|
Absorbance at 480 nm |
-Log[bp] |
[DNA(bp)] |
Volume 2 mM DNA Solution (in µL) |
Volume 2 µM DNA Solution (in µL) |
Volume of BPES buffer (in µL) |
|
0.018 |
3.0 |
0.001 |
500.0 |
XXXXXX |
500.0 |
|
0.023 |
3.3 |
5.01187Ã-10-4 |
251.0 |
XXXXXX |
749.0 |
|
0.024 |
3.7 |
1.99526Ã-10-4 |
100.0 |
XXXXXX |
900.0 |
|
0.032 |
4.0 |
0.0001 |
50.0 |
XXXXXX |
950.0 |
|
0.032 |
4.3 |
5.01187Ã-10-5 |
25.0 |
XXXXXX |
975.0 |
|
0.029 |
4.7 |
1.99526Ã-10-5 |
10.0 |
XXXXXX |
990.0 |
|
0.032 |
5.0 |
0.00001 |
5.0 |
XXXXXX |
995.0 |
|
0.031 |
5.3 |
5.01187 Ã-10-6 |
3.0 |
XXXXXX |
997.0 |
|
0.030 |
5.7 |
1.99526Ã-10-6 |
1.0 |
XXXXXX |
999.0 |
|
0.032 |
6.0 |
0.000001 |
XXXXXX |
500.0 |
500.0 |
|
0.033 |
6.3 |
5.01187Ã-10-7 |
XXXXXX |
251.0 |
749.0 |
|
0.033 |
6.7 |
2.51189Ã-10-7 |
XXXXXX |
100.0 |
900.0 |
|
0.032 |
7.0 |
0.0000001 |
XXXXXX |
50.0 |
950.0 |
|
0.032 |
7.3 |
5.01187Ã-10-8 |
XXXXXX |
25.0 |
975.0 |
|
0.034 |
7.7 |
1.99526Ã-10-8 |
XXXXXX |
10.0 |
990.0 |
|
0.035 |
8.0 |
0.00000001 |
XXXXXX |
5.0 |
995.0 |
|
0.035 |
8.3 |
5.01187Ã-10-9 |
XXXXXX |
2.5 |
997.5 |
|
0.033 |
8.7 |
2.51189Ã-10-9 |
XXXXXX |
1.0 |
999.0 |
|
0.030 |
9.0 |
0.000000001 |
XXXXXX |
0.5 |
999.5 |
- DATA GRAPH:
- CALCULATIONS:
Sample Calculation for K:
- Using sample #4
Known Information:
|
|
|
|
|
|
- Solve for X:
Aobs = εb x + εf [EÕ• – x]
0.032 = (2497 M-1cm-1)x + (5600 M-1cm-1)[(1.0 Ã-10-5 M) – x]
x = 7.73943 Ã-10-6 M
- Plug in value of x to solve for K:
K = x/[EÕ• – x][DÕ• – x]
K = (7.739 Ã-10-6 M)÷[( 1.0 Ã-10-5 M) – (7.739 Ã-10-6 M)][( 1.0 Ã-10-4 M) – (7.739 Ã-10-6 M)]
K = (7.73943 Ã-10-6 M) ÷ [2.26057 Ã-10-6 M][9.22606 Ã-10-5 M]
K = (7.73943 Ã-10-6 M) ÷ (2.0856148 Ã-10-10 M2)
K = 37108.63 M-1
K = 3.71 Ã-104 M-1
- FINAL EXCEL WORKSHEET: After refinement
- DISCUSSION:
The principle behind this lab experiment was to determine the binding constant of ethidium bromide to DNA using the known concentrations and the calculated value of X obtained from the equation. Ethidium bromide is said to have a high affinity to DNA, therefore, the expected value for the binding constant should be large. However, two methods were used to obtain the value K (binding constant). The first method was by using excel worksheet and inputting our data. The main goal was to manipulate the value in cell I24 to be as low as possible. After several trails and error, the final value of cell I24 was 0.00011316 and logK was 3.99, if you take the antilog of that value K would equal to approx. 9772.37, which is low in comparison to method two which was done by manual calculation. By manual calculation the obtained value for K was 37,108.63 M-1 which indicates that the final EB complex of DNA was larger than that of unbound DNA and unbound EB. The high value of the binding constant (K), demonstrates that there is a high affinity of ethidium bromide to DNA. This correlates to the expected values of EtBr, which are reported to be in between 104 M to 106 M.
Using a buffer that does not contain added NaCl, such as BPE, will have different results than that of a buffer with NaCl, such as BPES. The BPE buffer will yield a lower binding constant than that measured in BPES buffer. It is well known that the interaction within the process of intercalation is driven by electrostatic factors and Ï€-stacking with the bases (lab manual). The electrostatic binding of ethidium bromide to DNA has a preference to binding to the phosphate backbone the DNA strand. The DNA-ligand binding is salt-dependent due to the counter-ion release that’s carried out during binding. This is indicative that the salt component in the buffer demonstrates a relatively greater stability in DNA due to its preference to the binding site within the GC-rich DNA region. With that said, it is apparent that an outlying positive charge is essential for intercalation. The positive charge on the intercalation diminishes as the aromatic system increases.
Like ethidium bromide, Actinomycin D is another known intercalator with a high affinity to DNA. Though the two differ by means of binding sites. Actinomycin D intercalates at GC sites, which indicates that the two intercalators would not compete with one another at the exact binding sites. Therefore, by adding Actinomycin to a solution of herring testes DNA Ethidium bromide, resulting in two different results. An example of the plot is shown below:
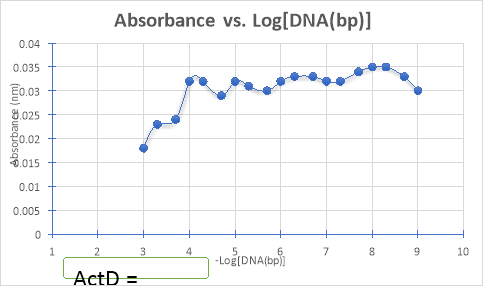
The plot is simply an example of what it might look like. There are a lot of variables that must be considered in choosing the proper intercalator. Factors to consider are concentrations of solutions and DNA, buffers, whether it’s a low salt concentration or high salt concentration buffer. The difference in buffers could possibly yield two very different results. Another factor to consider is the magnitude of the absorbance. All these factors combined could hinder the final outcome, so it is hard to conclude exactly how the actinomycin D would react in combination with ethidium bromide to DNA within this experiment.
- REFERENCES:
- Jeremy M. Berg, J. L. (2015). Biochemistry 8th ed. Kate Ahr Parker.
- Eva M. Talavera, Pablo Guerrero, Francisco Ocana, and Jose M. Alvarez-Pez, “Photophysical and Direct Determination of Binding Constants of Ethidium Bromide Complexed to E. coli DNA,” Appl. Spectrosc. 56, 362-369 (2002)
- Fuller, W., and M. J. Waring. 1964. A Molecular model for the interaction of ethidium bromide with deoxyribonucleic acid. Ber. Bunsen Ges. Phys. Chem. 68:805-808.
- Qiao C, Bi S, Sun Y, Song D, Zhang H, Zhou W (2008) Study of interactions of anthraquinones with DNA using ethidium bromide as a fluorescence probe. Spectrochim Acta A 70: 136-143
- Graves, D. E., C. L. Watkins, and L. W. Yielding. 1981. Ethidium bromide and its photoreactive analogues: spectroscopic analysis of deoxyribonucleic acid binding properties. Biochemistry. 20:1887-1892. [PubMed]
- Suh D, Chaires J B (1995) Criteria for the mode of binding of DNA binding agents. Bioorg Mediclin Chem 3(6): 723-728
Cite This Work
To export a reference to this article please select a referencing stye below:
Related Services
View all


DMCA / Removal Request
If you are the original writer of this essay and no longer wish to have your work published on UKEssays.com then please click the following link to email our support team:
Request essay removal