Effect of Increasing the Concentration of KNO3 and NaCl on the Temperature of Crystallisation
| ✅ Paper Type: Free Essay | ✅ Subject: Chemistry |
| ✅ Wordcount: 1249 words | ✅ Published: 18 May 2020 |
Research question
Does increasing the concentration of KNO3 and NaCl in intervals of 1g effect the temperature at which they crystallise and hence their solubility?
Rationale
Solubility is a chemical property referring to the ability of a substance whether it be solid, liquid or gas to dissolve in solvent depends on the attraction between the substance and the intermolecular bonding. It also can be attractive forces within from the substances that holding one partial to another. If it dissolved easily, the substance is soluble. If it does not dissolve, the substance is insoluble (Kuiper’s K,2019 p.386). once the maximum amount of solute has been reaches and no more can dissolve, therefore the solution has become saturated.
Potassium nitrate (KNO3) is a chemical compound with the formula KNO3. It’s classified as a solid and crystalline ionic compound that formed by one potassium(metal) cation (K+) with one nitrate(non-metal) anion (NO3-) (Chemical book, 2019). Because salts contain of ions, they contain whole positive and negative charges which are electrostatically attracted to each other. This is known as a stronger type of bonding (even stronger than dipole-dipole interactions). When the solute is dissolved in water to form a solution, the whole charges of ionic substance will interact with a polar substance (H2O), which has partial positive and negative charges. Ionic substances crystallise from aqueous solution with the molecules of water still attach to the ions. The solubility of most ionic solids in water depends on the increases of temperatures. As an unsaturated solution cools, it will reach a temperature at which crystallisation starts to occur. For some solutions, for example, potassium nitrate. This indicates that the solution has become supersaturated. At this temperature, the solutions contain the maximum quantity of solute that can be dissolved in that amount of solvent. If the temperature at the point of saturation is recorded for several different quantities of solute, the data can be plotted on a graph in order to construct a solubility curve versus temperature curve.
Sodium chloride is a widely use chemicals and well-knowns as table salts and is an inorganic compound with the formula NaCl, representing a 1:1 ratio of ions. It is a stable solid solute in water, only decomposes at high temperatures(softscbools,2019). Sodium ions will attract chlorine ions and form an ionic bond.
Original experiment:
In this original experiment, it’s to determine the solubility of potassium nitrate and sodium chloride in water for the effect of temperatures and construct a solubility curve (Pearson chemistry Unit1&2 Skills and Assessment 2019). The solubility of salt refers to the increasing the concentration of salts in intervals of 1 g which will be dissolved and crystallise per 5ml of solvent in distilled water at a different temperature. (textbook explanation) ….
Modification to the methodology
To ensure that relevant and sufficient data was collected, the original experiment was extended by
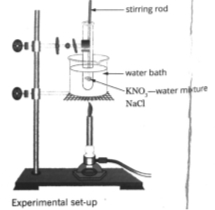 Figure 2: Experimental setup
Management of Risks
It’s important to review and understood the risk assess and handling procedures of all the equipment, hazardous chemical used for the experiment.
|
Identify the risks |
Managed the risks |
|
Breakage of Beakers: may cuts from broken glass and sharp items |
Inspect and discard any chipped or cracked beakers into specially designed bin and not into the general waste bin,no matter how small the damage. Sweep up broken glass with brush and dustpan, to be aware that do not use fingers |
|
Test tube stand: wooden test tube rack is flammable and catch fire easily if near Bunsen flame closely. |
Place the Bunsen burner away from any wooden equipment or overhead shelving, at least 12 to 15 inches of distance. Remove all the materials and chemicals from the area |
|
Test tube (medium 150 x 15mm): chipped test tube. In commonly, the thinners walls and more fragile than borosilicate test tubes. Small test tubes highly likely to eject material during exothermic reactions. |
Do not use the thermometer to blend the chemicals in the test tube as it may cause damage or cracked. Safe disposal of all the broken glassware separately from other waste and to avoid injury from those containers. |
|
Thermometer: toxic mercury in the thermometer will be release if use unproperly. And possibility of breakage and serve cuts when inserting or removing from fitting |
Better to use alcohol thermometer, where possible for low temperate ranges. Discard if damaged, |
|
Electronic balance: can be knocked off bench, with potential injury to feet. Danger of electrocution especially in wet area or if wiring is defective |
To ensure that keep the bench clean and tidy throughout the experiment. It’s suggested that remove spilt chemicals immediately. It is important that checking to wire for damage each time before use and test and tag at regular intervals. |
|
Filter funnel: may break and may cause cuts |
To ensure the safety issue, discard any cracked funnels or ceramic with brush and dustpan immediately. |
|
Glass stirring rod: may break in hand causing deep cuts |
Discard any cracked or broken glass stirring rods to avoid any danger occur |
Qualitative observations
During the experiment, there was an effect of temperature in the solubility of both types of solute.
Raw data
Table 1. Temperature of crystallisation results of KNO3 and NaCl in different concentrations
|
Mass of KNO3 (g) in 5.0mL of H20 |
mass/100g |
Temperature at which crystallisation occurs |
|||
|
trial 1 |
trial2 |
trial 3 |
average |
||
|
1 |
20 |
40 |
35 |
33 |
36 |
|
2 |
40 |
45 |
40 |
35 |
40 |
|
3 |
60 |
50 |
45 |
48 |
47.67 |
|
4 |
80 |
56 |
54 |
53 |
54.33 |
|
5 |
100 |
61 |
66 |
67 |
64.66667 |
|
Mass of NaCl (g) in 5.0mL of H20 |
mass/100g |
Temperature at which crystallisation occurs |
|||
|
trial 1 |
trial2 |
trial 3 |
average |
||
|
1 |
20 |
75 |
77 |
78 |
76.67 |
|
2 |
40 |
85 |
82 |
80 |
82.33 |
|
3 |
60 |
86 |
85 |
87 |
86 |
|
4 |
80 |
90 |
86 |
90 |
88.67 |
|
5 |
100 |
93 |
90 |
95 |
92.66667 |
Processing of data
Raw data was processed to determine the temperature at which
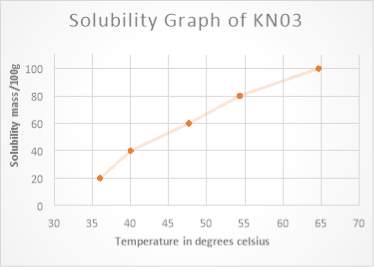
 Figure1 solubility curve is represent the mass solubility mass that can be dissolve in 100g of water (y axis) at a different temperature (y x- axis)
Trends, patterns and relationship
A comparison of potassium nitrate and sodium chloride reveals that potassium nitrate dissolve solvent has a high solubility in water, the solubility of a substance change due to the temperature of the solution is increased. This can be seen in the solubility graph of KNO3……
Limitation of the evidence and reliability and validity of the experimental process
Test tube, Temperature, Thermo Dynamic, Supersaturation
- Sticking of chemicals – reduce the amount of mass
- Not using filter- some chemicals were lost
- Incurrent of using thermometer – decrease the reliability and accuracy of the data
- Inconsistent when dissolving chemical
- Could not tell in the chemicals in fully dissolve it or not
- Equipment –unclean which may allow mixed with other chemicals, to react with something else of actual experiment
- Incorrect reading
- Quality of equipment, different size of test tube (not easy to be visualised)
Conclusion
Suggest improvements and extensions
To improve the reliability and validity of the experiment are outlined in Table
|
Analysis of evidence |
Suggested improvements and extensions |
|
Systematic error |
Reduce systematic error by extending the experimental process to:
|
|
Random error |
Reduce random error by refining the experimental process to:
|
It is suggested that
It is not until …. that
There is evidence that
There is a complex relationship between … and
Reference list
- Chemicalbook.com. (2017). Potassium nitrate | 7757-79-1. [online] Available at: https://www.chemicalbook.com/ChemicalProductProperty_EN_CB9854301.htm [Accessed 14 Aug. 2019]
- Kuipers, K. (2019). Chemistry for Queensland. austrlia: Oxford University Press, p.386.
Cite This Work
To export a reference to this article please select a referencing stye below:
Related Services
View all


DMCA / Removal Request
If you are the original writer of this essay and no longer wish to have your work published on UKEssays.com then please click the following link to email our support team:
Request essay removal