Determination of Uranium Concentration in Uranium Ore
| ✅ Paper Type: Free Essay | ✅ Subject: Chemistry |
| ✅ Wordcount: 1077 words | ✅ Published: 18 Jan 2018 |
Investigation of effective Parameters on determination of uranium concentration in uranium ore by X-ray fluorescence spectroscopy
A. AliValiOllahi*, Gh. Alahyarizadeh, S. A. Ahmadi, A. Minuchehr, A. Zolfaghari
Abstract
Uranium concentration in four different sample solutions (A, B, C and D) of uranium ore was determined by X-Ray Fluorescence spectroscopy (XRF) and Inductively Coupled Plasma-Optical Emission Spectroscopy (ICP-OES). The effect of several different parameters on the XRF results including types of acid digestion, sample amount and calibration methods were also investigated. Regarding to absent of uranium ore standard, the samples were prepared as solutions. Three different microwave acid digestions, (HNO3: HCl: HF-6:2:2), (H3PO4: H2SO4: HF-3:3:3), (HNO3: H2O2: HF-4:2:2), were used. The highest uranium concentrations for three samples (A, C and D) were obtained by third acid digestion method and another sample (B), was obtained by second acid digestion, which were 10.8, 4.8, 9.8 and 12.5 ppm, respectively. To study the matrix effect, different standard calibrations such as external calibration, internal addition were applied. The results were also confirmed by the measurements which were performed by ICP-OES.
Keywords: Uranium ore, X-Ray Fluorescence spectroscopy, ICP-OES, Microwave acid digestion, internal addition
Introduction
Uranium is the famous element from the actinide series in the periodic table which has an atomic number of 92. it is silver color, ductile, flexible and slightly paramagnetic metal which has high density. Uranium is the material of vast technological importance because of its use as the main fuel in nuclear reactors. The usual source for uranium production is uranium ores which are too limited. Therefore, determination of uranium concentration in the uranium ores has very high importance [1, 2].
Several techniques have been developed for determination of uranium. Including inductively coupled plasma-mass spectrometry (ICP-MS) [3, 4], inductively coupled plasma atomic emission spectrometry (ICP-AES) [5], inductively coupled plasma optic emission spectrometry (ICP-OES) [6, 7], flame atomic absorption spectrometry (FAAS) [8], graphite furnace atomic absorption spectrometry (GFAAS) [9], X-Ray fluorescence spectrometry (XRF) [10, 11]. Geological samples which contain uranium are most commonly analyzed by XRF method. Many studies have been carried out on the use of XRF for determination of uranium concentration in ore samples. P. Arikan et al studied quantitative analysis of uranium in ore deposit by XRF; their experiments clearly show the capability of XRF method for analysis of uranium in uranium bearing ores [12]. M. A. Al-Eshaikh determined uranium content in phosphate ores using different measurement techniques; they concluded that XRF provides the accurate results for heavy elements such as uranium [15]. Furthermore, many researches have been issued on the use of ICP-OES for the determination of uranium in uranium matrices. P. Murugesan et al studied determination of total concentration of uranium in borehole core samples by ICP-OES; they concluded that the ICP-OES results obtained compare favorably by using differential technique in laser-induced fluorimetry, which they used as a reference measurement procedure [13] and J. S. Santos et al studied operating condition for determination of uranium by ICP-OES; their results agreed with the results achieved using ICP-MS [14].
In the present study, XRF spectrometry was used to determine the concentration of uranium in four different uranium ore samples which was prepared by three various acid digestion strategies. The effect of different acid digestions and also different addition methods were studied on the results. ICP-OES method was also used for the results validation.
Materials and methods
- Instrumentation
The analytical determination of uranium was carried out with ICP-OES spectrometer: Spectra Genesis and XRF spectrometer: Spectra Xepos.
A Spectra Xepos XRF spectrometer that uses a 50 watt end-window X-ray tube to excite samples was used for XRF measurements. The target changer, with up to 8 polarization and secondary targets, offers many different excitation conditions ensuring optimum determination of all elements from Na to U. The detector is a state-of-the-art silicon drift detector and measurements can be conducted in a He gas.
And also a Spectro Genesis spectrometer that is equipped with powerful automation functions for the safe unattended analysis of a large number of samples with an optional autosampler, several hundred samples can be processed without operator intervention. An extensive package Such as a wide range of sample introduction systems, autosamplers, an autodilutor, an ultrasonic nebulizer and hydride generator accessories is available for the Spectro Genesis and it covers the entire relevant wavelength range from 175 to 777nm. A free-running generator with a frequency of 27.12 MHz and a power output of 0.7 to 1.7 kW is utilized. It includes automatic plasma ignition as well as an energy and argon-saving standby mode. The software uses for the Spectro Genesis is The Smart Analyzer Vision software.
Table 1 shows some operating conditions and basic information about the devices used in this study.
Table 1 Operating parameters of ICP-OES and XRF
|
ICP-OES |
|
|
Plasma Power Coolant Flow Auxiliary Flow Nebulizer Flow Add Flow Preflush Time Measure Time |
1420 W 12.0 l/min 0.90 l/min 0.82 l/min 0.50 l/min 45 Sec 3*25 Sec |
|
XRF |
|
|
Energy Range Target Voltage Current Peak Time Measurement Time |
25.0 Kev Barkla scatter, Al2O3 49.17 kV 0.7 mA 2.0 µs 300s |
The sample digestions were arranged using the Multiwave 3000 Anton Paar Microwave Digestion System with eight digestion vessels was used for microwave assisted acid digestion procedures. Table 2 shows operating conditions used for the acid digestion procedures.
Table 2 Operating programs of microwave acid digestions
|
Hold(min) |
Ramp(min) |
P-Rate( bar/sec) |
Power Watt |
Program |
|
|
1 3 |
15 15 |
5 0 |
0.5 |
600 0 |
Cleaning |
|
1 2 |
45 20 |
5 0 |
0.5 |
700 0 |
Main |
|
1 2 |
20 20 |
0 0 |
0.5 |
600 0 |
Complexing |
- Reagents and solutions
The acids were used; hydrochloric acid (37% w/v), nitric acid (67% w/v), hydrofluoric acid (40% w/v), sulfuric acid (95% w/v), phosphoric acid (424% w/v) and hydrogen peroxide (521% w/v) were suprapure reagents (Suprapure, Merck). Boric acid (2% w/v) was analytical-reagent grade (AnalaR; BDH, Chemical Poole, England). High-purity water (electrical resistivity >18MΩcm) was produced with a Milli-Q system (Millipore, MA, USA).
Calibration was obtained with external standards. Standard solutions were prepared by diluting a 1000ppm uranium standard solution (ICP Multielement Standard IV, Merck, Darmstadt, FRG).
- Sample preparation
Four different uranium ore samples were collected from various regions of Iran that named A, B, C and D.
To prepare the liquid sample for examination with XRF and ICP-OES spectrometers, the ore samples should be completely digested using acid combinations. Due to the silica in the samples, HF acid had to be used to achieve complete digestion. Three different acid combinations were used, first 6ml of hydrochloric acid, 2ml of nitric acid plus 2ml of hydrofluoric acid (HNO3:HCl:HF-6:2:2) [16], second 3ml of phosphoric acid, 3ml of sulfuric acid and 3ml of hydrofluoric acid (H3PO4: H2SO4: HF-3:3:3) [17] and third 4ml of nitric acid, 2ml of hydrogen peroxide and 2ml of hydrofluoric acid (HNO3: H2O2: HF-4:2:2) [18, 19].
0.4g of each ore sample (<30µm) was weighted and poured into the microwave vessel. Then, acid mixtures were added to the powder samples and run the main microwave program. Due to HF’s high corrosion, for every ml of HF, 6ml of Boric acid had to be added and the complexing microwave program was run. Finally, the solutions were diluted to 50ml by adding deionized water.
Results and discussions
- Calibration of XRF method
Standard 1000ppm uranium solutions were available; five solutions (100ppm, 20ppm, 5ppm, 2ppm and blank) were prepared, 3.5ml of each solution was analyzed in the XRF and the uranium method was created. For determining different elements in XRF method usually Kα or Lα is used, since uranium is a heavy element, Lα was measured [21, 22, 23]. Intensities of uranium peaks and calculated concentration of uranium in standard solutions is summarized in table 3 and the calibration curve is plotted in figure 1.
Table 3 Normal impulses and calculated conc. of U in Standards
|
U-conc. (In standards) ppm |
Normal Impulse |
Calculated *Conc. (ppm) |
|
Blank |
0.0001 |
0.001 |
|
2ppm |
1.36 |
1.7 |
|
5ppm |
4.27 |
5.3 |
|
20ppm |
16.52 |
20.4 |
|
100ppm |
81.01 |
99.9 |
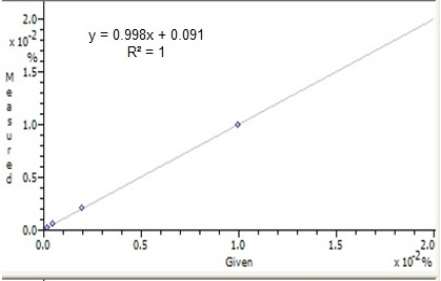
Figure 1 – Calibration plot of standards using X-Rays
- Influence of different acid digestions on uranium measurement
The uranium ore samples (A, B, C and D) were digested using three different acid digestion strategies. Using the uranium method obtained from calibration 3.5ml samples were prepared and analyzed in the XRF and their uranium concentrations were measured, results are summarized in table 4.
Table 4 Uranium concentration (ppm) of U-ore samples by XRF
|
A |
B |
C |
D |
|
|
HNO3:HCl:HF-6:2:2 |
9.3 |
12.27 |
4.1 |
9.53 |
|
H3PO4: H2SO4: HF-3:3:3 |
9.3 |
12.5 |
4.1 |
7.97 |
|
HNO3: H2O2: HF-4:2:2 |
10.8 |
12 |
4.8 |
9.8 |
- Influence of the volume of samples on uranium measurement
To check the influence of the volume of samples on measurements, 2ml, 3ml, 3.5ml and 4ml samples were also prepared using sample B 3:3:3 and analyzed in the XRF and their uranium concentrations were measured using the uranium method previously obtained. Table 5 shows the results and it can be seen, the volume of samples has insignificant effect on the results.
Table 5 Uranium concentration (ppm) for different amount of sample
|
Amount of Sample |
2ml |
3ml |
3.5ml |
4ml |
|
U-conc(ppm) |
9.4 |
9.8 |
9.7 |
10.4 |
- Influence of addition on sample matrices in XRF measurement
Since the matrix structure of samples has a significant influence on XRF measurements, the influence was studied using the addition method. One of the uranium ore samples (sample B) was used; 2.5ml of this sample was added by 1ml of the addition solution. Addition solutions were 200ppm, 100ppm, 50ppm and blank. The final solutions were analyzed by XRF using uranium method. The results are summarized in table 6 and figure 2.
Table 6 Uranium concentration (ppm) for various additions
|
0 ppm |
50 ppm |
100 ppm |
200 ppm |
|
|
2.5 ml B333+ 1ml U |
10.3 |
23.4 |
37.5 |
68.9 |

Figure 2 – Uranium concentration for various additions
Another addition method was also used, in this method 3ml, 2.5ml, 2ml, 1.5ml, 1ml and 0.5ml samples were added by respectively 0.5ml, 1ml, 1.5ml, 2ml, 2.5ml and 3ml of standard 100ppm solution, the results are summarized in table 7 and figure 3.
Table 7 uranium concentration (ppm) of various additions
|
Acid+U 100ppm |
3ml+ 0.5ml |
2.5ml+1ml |
2ml+1.5ml |
1.5ml+2ml |
1ml+2.5ml |
0.5ml+3ml |
|
U-Conc. |
18.9 |
28.2 |
38.4 |
50.4 |
64.4 |
79.8 |

Figure 3 – Concentration of various additions
- ICP-OES method results compared to XRF
Due to its high accuracy, rapid analysis and simplicity, ICP-OES method was used for result validation. Similar to the XRF method, calibration is achieved using standard solutions. Eight standard solutions were used, and the results are summarized in table 7 and the calibration curve is plotted in figure 3
Table 8 Insenties of U peaks and calculated conc. of U in standard solutions
|
Intensity *(cps) |
Calculated *Conc. (ppm) |
|
|
Blank |
161961 |
0.017141 |
|
1ppm |
182272 |
0.8514 |
|
2ppm |
204176 |
1.7511 |
|
4ppm |
250949 |
3.6722 |
|
5ppm |
287491 |
5.1731 |
|
10ppm |
413628 |
10.3541 |
|
20ppm |
661161 |
20.5212 |
|
40ppm |
112712 |
39.6598 |

Figure 4 Calibration plot of standards using ICP-OES
. The uranium ore samples (A, B, C and D) were digested using similar acid digestion strategies used in XRF method. Uranium concentrations were measured in the samples (table 9).
Table 9 Uranium concentration (ppm) of U-ore samples by ICP-OES
|
A |
B |
C |
D |
|
|
HNO3:HCl:HF-6:2:2 |
10.75 |
14.85 |
4.49 |
9.78 |
|
H3PO4: H2SO4: HF-3:3:3 |
8.97 |
12.42 |
4.04 |
7.84 |
|
HNO3: H2O2: HF-4:2:2 |
10.98 |
13.67 |
4.94 |
9.88 |
|
Uranium |
409.14nm |
385.958nm |
367.007nm |
279.394nm |
|
HNO3:HCl:HF-A |
10.743 |
18.982 |
12.178 |
157.101 |
|
HNO3:HCl:HF-B |
14.852 |
24.878 |
15.925 |
340.18 |
|
HNO3:HCl:HF-C |
4.487 |
13.359 |
5.914 |
337.488 |
|
HNO3:HCl:HF-D |
9.784 |
19.474 |
10.788 |
346.338 |
|
H3PO4: H2SO4: HF-A |
8.967 |
17.034 |
10.243 |
130.066 |
|
H3PO4: H2SO4: HF-B |
12.421 |
21.953 |
13.259 |
352.044 |
|
H3PO4: H2SO4: HF-C |
4.035 |
13.453 |
5.159 |
302.006 |
|
H3PO4: H2SO4: HF-D |
7.845 |
17.552 |
8.937 |
348.923 |
|
HNO3: H2O2: HF-A |
10.985 |
19.379 |
12.179 |
159.508 |
|
HNO3: H2O2: HF-B |
13.671 |
23.481 |
14.703 |
358.545 |
|
HNO3: H2O2: HF-C |
4.74 |
13.399 |
6.085 |
333.597 |
|
HNO3: H2O2: HF-D |
9.883 |
19.401 |
11.077 |
337.445 |
|
Interferences |
Yb I, Gd I, V I, Os I, Sm II, Co I, Am II, Tc I, Ac II, Kr II |
Ru I, Ce II, Ho II, Sm II, Ni I, Hf I, Er II, Dy I, Nd II, Sm I, Bk II, Fe I, Rb II, Cl II, Cl II, Cs II, Ho II, Po I, Sm II |
Sm II, Ho I, Ce II, Tm II, Pr II, Ti I, Er II, Ho II, Pm I, Ru I, Ho I, Es II, Re I, Os I, Gd II, Zr II, Pb I, Ti I |
Gd II, W I, Tm II, Mn I, Mg II, Es II, Ta I |
As it can be seen the results of uranium concentration from ICP-OES are conformity with the results of XRF.
Conclusion
Uranium is a material of vast technological importance because of its use as a main fuel in nuclear reactors. Determination of uranium concentration in uranium ores has very high importance. Uranium concentration in four different ore samples of Iran uranium ores was determined by XRF and ICP-OES spectrometry methods. Three different microwave acid digestions were used. After sample preparation, calibration was done using standard solutions. Five samples were used for the XRF method and eight were used for ICP-OES. The uranium concentration was measured in these samples.
References
[1] N. L. Misra, S. Dhara, A. Das, G. S. Lodha, S. K. Aggarwal And I. Varga, Trace determination of uranium in fertilizer samples by total reflection X-ray fluorescence, Pramana – J. Phys., Vol. 76, No. 2, February 2011
[2] J. S. Santos, L. S. G. Teixeira, W. N. L. dos Santos, V. A. Lemos, J. M. Godoy and S. L.C. Ferreira, Uranium determination using atomic spectrometric techniques: An overview, Analytica Chimica Acta 674 (2010) 143–156
[3] A. Sasmaz & M. Yaman, Determination of Uranium and Thorium in Soil and Plant Parts around Abandoned Lead–Zinc–Copper Mining Area, Communications in Soil Science and Plant Analysis, (2008), 39:17-18, 2568-2583
[4] C. Charalambous, M. Aletrari, P. Piera, P. Nicolaidou-Kanari, M. Efstathiou, I. Pashalidis, Uranium levels in Cypriot ground water samples determined by ICP- M S and alpha-spectroscopy, Journal of Environmental Radioactivity 116 (2013) 187e192
[5] A. Premadas, P. K. Srivastava, Inductively coupled plasma atomic emission spectrometric determination of lanthanides and Y in various uranium hydrometallurgical products, Journal of Radioanalytical and Nuclear Chemistry, Vol. 251, No. 2 (2002) 233–239
[6] K. Satyanarayana and S. Durani, Separation and inductively coupled plasma optical emission, spectrometric (ICP-OES) determination of trace impurities in nuclear grade uranium oxide, J Radioanal Nucl Chem (2010) 285:659–665
[7] M. Bettinelli, G.M. Beone, S. Spezia and C. Baffi, Determination of heavy metals in soils and sediments by microwave-assisted digestion and inductively coupled plasma optical emission spectrometry analysis, Analytica Chimica Acta 424 (2000) 289–296
[8] B. P. Li, M. B. Luo, J. Q. Li, W. Liu, Y.Z. Sun and G.L. Guo, Determination of cadmium and lead in high purity uranium compounds by flame atomic absorption spectrometry with on-line micro-column preconcentration by CL-7301 resin, Journal of Radioanalytical and Nuclear Chemistry, Vol. 278, No.1 (2008) 3–8
[9] T. Inui, A. Kosuge, A. Ohbuchi, K. Fujita, Y. Koike, M. Kitano and T. Nakamura, Determination of heavy metals at sub-ppb levels in water by graphite furnace atomic absorption spectrometry using a direct introduction technique after preconcentration with an iminodiacetate extraction disk, American Journal of Analytical Chemistry, (2012) 3, 683-692
[10] Y. B. Rao, B. V. V. Ramana, P. G. Raghavan and R. B. Yadav, Determination of uranium in process stream solutions from uranium extraction plant employing energy dispersive X-ray fluorescence spectrometry, J Radioanal Nucl Chem (2012) 294:371–376
[11] S. Dhara, N. L. Misra, S. K. Aggarwal and V. Venugopal, Energy dispersive X-ray fluorescence determination of cadmium in uranium matrix using Cd Kα line excited by continuum, Spectrochimica Acta Part B 65 (2010) 461 –465
[12] P. Arikan and A. Ozmen, Quantitative analysis of uranium in ore deposit by calibration standardization of XRF, Commun. Fac. Sci. Univ. Ank. Series A2, A3, (1987) V. 36, pp 35-40
[13] P. Murugesan1, S. K. Jain1, M. Kumar, P. K. Tarafder and D. P. S. Rathore, Determination of total concentration of uranium in borehole core samples: comparative studies using differential technique in laser-induced fluorimetry and ICP-OES, Exploration and Research for Atomic Minerals, Vol. 23, 2013, pp. 137-144
[14] J. S. Santos, L. S. G. Texeira, R. G. O. Araujo, A. P. Fernandes, M. G. A. Korn and S. L. C. Ferreira, Optimization of the operating conditions using factorial designs for determination of uranium by inductively coupled plasma optical emission spectrometry, Micro chemical Journal 97 (2011) 113-117
[15] M. A. Al-Eshaikh, A. N. Kadachi, M. M. Sarfraz, Determination of uranium content in phosphate ores using different measurement techniques, Journal of King Saud University – Engineering Sciences (2013)
[16] M. Chen and L. Q. Ma, Comparison of Three Aqua Regia Digestion Methods for Twenty Florida Soils, Soil Sci. Soc. Am. (2001) J. 65:491–499
[17] S. V. D. Sluis, Y. Meszaros, W. G. J. Marchee, H. A. Wesselingh and G. M. V. Rosmalen, The digestion of phosphate ore in phosphoric acid, Ind. Eng. Chem. Res. 1987, 26, 2501-2505
[18] F. L. Pantuzzo, J. C. J. Silva, V. S.T. Ciminelli, A fast and accurate microwave-assisted digestion method for arsenic determination in complex mining residues by flame atomic absorption spectrometry, Journal of Hazardous Materials 168 (2009) 1636–1638
[19] J. Ivanova, R. Djingova, S. Korhammer and B. Markert , On the microwave digestion of soils and sediments for determination of lanthanides and some toxic and essential elements by inductively coupled plasma source mass spectrometry, Talanta 54 (2001) 567–574
[20] Brian Lee Francom, X-ray fluorescence instrument calibration, Theory and Application, Department of Physics Brigham Young University-Idaho, December 2008
[21] R. M. Conrey, J. A. Wolff, A. Seyfarth, A. VanHoose, M. Goodman-Elgar, N. Bettencourt, D. Boschmann and K.Werling, Portable XRF Calibration Using Influence Coefficients
[22] D. F. Siems, the Determination of 30 Elements in Geological Materials by Energy-Dispersive X-ray Fluorescence Spectrometry, (2000) Open-File Report 00-475
Cite This Work
To export a reference to this article please select a referencing stye below:
Related Services
View all


DMCA / Removal Request
If you are the original writer of this essay and no longer wish to have your work published on UKEssays.com then please click the following link to email our support team:
Request essay removal