Determination of Protein Concentration Experiment
| ✅ Paper Type: Free Essay | ✅ Subject: Chemistry |
| ✅ Wordcount: 1459 words | ✅ Published: 17 Aug 2017 |
- ABSTRACT:
The objective of this experiment is to determine the concentrations of RNase H which was purified in the previous lab experiment and of an unknown solution, which was administered by the TA. A Bradford reagent was utilized to determine the total concentration which binds to the protein. The samples were placed in a spectrophotometer and the absorbance was recorded for each sample. The data was compared to the calibration curve made using the standard protein solutions and the absorbance reading. Our sample was unknown #3, which had a total concentration of 1.418 mg/mL. The concentrations for the original flow through, washing buffer flow through, and the eluting buffer flow through were 0.021 mg/mL, 0.0274 mg/mL, and 0.014 mg/mL, respectively, with a 98% confidence interval of ± 0.0021 %.
- INTRODUCTION:
In the previous lab experiment, the His-tag protein RNase H was purified by implementing a method called affinity chromatography. Affinity chromatography is utilized to isolate and purify proteins due to its high selectivity to the protein of interest (Biochemistry, 2015). The unused eluting buffer, original flow through, eluting buffer flow through, and the washing buffer flow through were all retained and stored for the latter experiment #7. In addition to the solutions mentioned, five standards protein solutions are prepared by diluting a 1.56 mg/mL of bovine gamma globulin solution (IgG) and unused eluting buffer. The final prepared solution is placed in a spectrophotometer and set at an absorbance of 596 nm. The unused eluting buffer is used as the control in the experiment to balance the spectrophotometer.
A calibration curve is created using the absorbance measured from the five standards. In most cases, the calibration curve or standard curves are generated using a least two sets of data or replicates, which holds true in our case. However, the average of the two absorbance sets were used to create the standard curve. The blank/control consists of a buffer without addition of protein. The protein standards have a known concentration of protein, and the unknown sample is the solution to be assayed (Lab Manual). All of the 20 prepared solutions contain the Bradford protein assay.
Bovine gamma globulin is a protein assay that is used as a protein concentration reference standard for use in the Bradford for total protein assay. It is used in Bradford and other protein assays. The Bradford protein assay, also referred to as Bradford reagent, is commonly used in laboratories to determine the concentration of the protein within the sample. The reagent binds to the proteins present. The amount of protein present is proportional the binding of the Bradford reagent. Meaning that the more protein present in the sample, the greater the dye will bind. The reagent is said to colorimetric, therefore, a color change can be observed, in reference to the protein concentration. The blue hue from the reagent becomes progressively darker as we increase the protein concentration. The opposite holds true for the lighter blue hue, which indicates less protein is present in the solution. With the aid of the Bradford Reagent, it is possible to determine the total amount of protein concentration present in the sample of interest.
- EXPERIMENTAL PROCEDURES:
MATERIALS:
- Unused Eluting Buffer (Control)-from lab #6
- Eluting Buffer flow through (EB)-from lab #6
- Washing Buffer flow through (WB)-from lab #6
- Original Flow through (OFT)-from lab #6
- 1 mL of a 1.56 mg/mL Solution of Bovine Gamma Globulin (IgG)
- 0.25, 0.50, 0.75, 1.0, and 1.5 mg/mL of IgG-Protein Concentration Standards
- Bradford Reagent
- 20 plastic test tubes
- Cuvets, disposable plastic
- Parafilm
- Spectrophotometer
PROCEDURES:
Prepare five standard protein solutions in a microcentrifuge tube by diluting the 1.56 mg/mL of IgG stock solution appropriately with unused eluting buffer from lab #6. Each solution should have a total volume of 250 µL and the concentrations should be as follows: 0.25, 0.5, 0.75, 1.0, and 1.5 of IgG. Set up 20 test tubes and divide into two sets. Label 5 test tubes per the concentrations mentioned above, and the remaining 5 tubes as follows; eluting buffer flow through, unused eluting buffer, original flow through, washing flow through, and the unknown sample # obtained from the TA. Repeat this procedure for set two. Add 50 µL of the appropriate solution to each tube. Add 1.5 mL of Bradford reagent to each of the 20 test tubes then cover with each tube with parafilm and mix using the vortex mixer for approx..3 seconds. Wait 10 minutes and then transfer all the solutions to cuvets. For set one and two, place the unused eluting buffer cuvet into the spectrophotometer apparatus to balance and set to 596 nm. Read the absorbance for the other cuvets. Record each reading in lab notebook. Plot the average absorbance on the y-axis vs. concentration on the x-axis of the duplicate standard protein solutions. Determine the concentrations of the original flow through, washing flow through, eluting buffer flow through, and the unknown sample by using equation generated from the slope of the plot.
- RESULTS:
- DATA TABLES:
- Standard Protein Solutions:
|
Protein Concentration (mg/mL) |
Volume of 1.56 mg/mL IgG Stock Solution Needed (µL) |
Volume of Unused Eluting Buffer Used (µL) |
Total Volume of Solution |
|
0.25 |
40 |
210 |
250 µl |
|
0.50 |
80 |
170 |
250 µl |
|
0.75 |
120 |
130 |
250 µl |
|
1.0 |
160 |
90 |
250 µl |
|
1.5 |
240 |
10 |
250 µl |
- Absorbance Data:
|
Concentrations (mg/mL) |
Absorbance at 596 nm |
||
|
Set 1 |
Set 2 |
Average |
|
|
1.50 |
0.608 |
0.633 |
0.621 |
|
1.00 |
0.455 |
0.423 |
0.439 |
|
0.75 |
0.441 |
0.246 |
0.344 |
|
0.50 |
0.162 |
0.307 |
0.235 |
|
0.25 |
0.043 |
0.056 |
0.050 |
|
Unused EB (Control) = 0 |
0.000 |
0.000 |
0.000 |
|
Original Flow through |
0.004 |
-0.003 |
0.001 |
|
Washing Buffer |
0.002 |
0.005 |
0.004 |
|
Eluting Buffer |
0.001 |
-0.004 |
-0.002 |
|
Unknown Sample #3 |
0.608 |
0.606 |
0.607 |
- Total Concentration:
|
Protein Sample |
Concentration (mg/mL) |
|
Original Flow through |
0.0205 |
|
Washing Buffer |
0.0274 |
|
Eluting Buffer |
0.0136 |
|
Unknown Sample #3 |
1.418 |
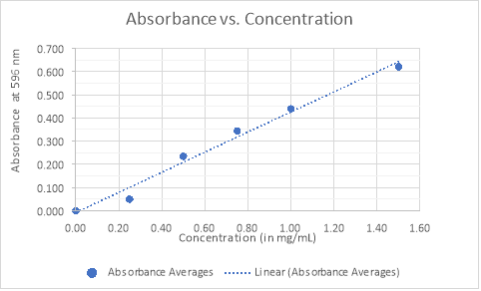
- GRAPH:
- CALCULATIONS:
The expression given by the best fit linear trend will be used to determine the concentrations for the original flow through, washing flow through, eluting buffer flow through, and unknown sample #3. Where y-represents the absorbance, and x-represents the concentration. The units corresponding to the slope are in mg/mL. Equation of the slope is: y = 0.4336x − 0.0079. Solving for x will give us the concentrations of the samples.
- Concentration of the Original Flow Through:
- Rearrange to solve for x:
- y = 0.4336x − 0.0079  x = (y – 0.0079)/(0.4336)
(0.001) = 0.4336x − 0.0079
x = (0.001 + 0.0079)/(0.4336)
x = 0.0205 mg/mL≈ 0.021 mg/mL
CALCULATIONS: (continued)
- Concentration of Washing Buffer Flow Through:
- y = 0.4336x − 0.0079
(0.004) = 0.4336x − 0.0079
x = (0.004 + 0.0079)/(0.4336)
x = 0.0274 mg/mL≈ 0.027 mg/mL
- Concentration of Eluting Buffer Flow Through:
- y = 0.4336x − 0.0079
(-0.002) = 0.4336x − 0.0079
x = (-0.002 + 0.0079)/(0.4336)
x = 0.0136 mg/mL≈ 0.014 mg/mL
- Concentration of Unknown Solution #3:
- y = 0.4336x − 0.0079
(0.607) = 0.4336x − 0.0079
x = (0.607 + 0.0079)/(0.4336)
x = 1.418 mg/mL
- DISCUSSION:
The main goal for this experiment was to determine the protein concentration of the original flow through, washing buffer flow through, eluting buffer flow through, and an unknown sample which was given by the TA. These samples apart from the unknown were prepared in the previous lab experiment and was retained for further analyses for this experiment. In addition to the samples mentioned above, five standard protein solutions were prepared by diluting the 1.56 mg/mL of IgG solution with the unused eluting buffer obtained from lab #6. The concentrations of the standards were as follows: 0.25 mg/mL 0.50 mg/mL, 0.75 mg/mL, 1.0 mg/mL, and 1.5 mg/mL. The unused eluting buffer was also used as the control. It was apparent that upon adding the Bradford reagent to the samples there was visible a color change. A few of the solutions instantly turned to a darker blue hue while others remained a light blue color. The darker color indicated there was a greater concentration of proteins.
A calibration curve was generated by plotting the concentrations of the five standards and their respective absorbance reading. It was determined that the best fit for the data was linear which yields an equation in the form of y = mx + b, where y represents the absorbance at 596 nm and x represents the protein concentration. The equation was rearranged as to solve for x and determine the protein concentration of the samples and the unknown #3, based on the data from the averages of the two sets of absorbance measured. However, two values from set two gave negative readings, which was indicative that the concentration of the protein was less than that of the control sample.
As per my results, it was concluded that our unknown sample had a total protein concentration of 1.418 mg/mL. The concentrations for the flow through of the original solution, washing buffer, and eluting buffer had a total protein concentration of 0.0205 mg/mL, 0.0274 mg/mL, and 0.0136 mg/mL, respectively. The absorbance data was further analyzed using a 98% confidence interval and yielded a ± 0.002% margin error. The R-value was relatively close to 1, which gives an equation that is more accurate. This also indicates that the calculated values for the protein concentration will reflect a value closer to the true concentration of the protein of interest.
- REFERENCES:
- J. M. Berg, J. L. Tymoczko, G. J. Gatto, Jr., & L. Stryer, Biochemistry (8th ed., pp. 70-71). (2015). W.H. Freeman & Company.
- Bradford, M. M. Analytical Biochemistry. Volume 72. “A Rapid and Sensitive Method for the Quantitation of Microgram Quantities of Protein Utilizing the Principle of Protein-dye Binding.” (pp. 248-254). (1976).
- Robyt, J. F. and White, B. J. Biochemical Techniques. “Theory and Practice.” Brooks/Cole, Monterey, CA. (1997)
- https://www.thermofisher.com/order/catalog/product/23212
Cite This Work
To export a reference to this article please select a referencing stye below:
Related Services
View all


DMCA / Removal Request
If you are the original writer of this essay and no longer wish to have your work published on UKEssays.com then please click the following link to email our support team:
Request essay removal