Cloud Point Extraction Experiment
| ✅ Paper Type: Free Essay | ✅ Subject: Chemistry |
| ✅ Wordcount: 2752 words | ✅ Published: 30 Jan 2018 |
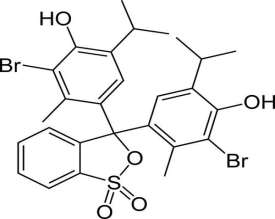
Bromothymol blue (also known as bromothymol sulfone phthalein, BTB) (Figure 2.1.1) is a pH indicator (yellow at pH 6.0 and blue at pH 7.6). Its chemical name is: 4,40-(1,1-dioxido-3H-2,1-benzoxathiole-3,3-diyl)bis(2-bromo-6-isopropyl-3-methylphenol (The Merck Index, 13th edition, 2007)[1]. pKa of BTB is 7.1. This dye is the most appropriate pH indicator dye in physiological tissue and also used in the investigation of the interaction of lipid with protein (Puschett and Rao 1991; Gorbenko 1998; Sotomayor et al. 1998)[2,3,4]. It is widely applied in biomedical, biological, and chemical engineering applications (Schegg and Baldini 1986; Ibarra and Olivares-Perez 2002)[5,6]. BTB in protonated or deprotonated form is yellow or blue in color, respectively, while its solution is bluish green in neutral solution. It is sometimes used to define cell walls or nuclei under the microscope. BTB is mostly used for the evaluation and estimation of the pH of pools and fish tanks and the determination of the presence of carbonic acid in liquid. There are several treatment procedures for dyes from waste materials, including adsorption (Nandi, Goswami, and Purkait 2009)[8], coagulation–flocculation, oxidation–ozonation, reverse osmosis, membrane filtration, biological degradation, and electrochemical processes (Shen et al. 2001; Kim et al. 2004; Chatterjee, Lee, and Woo 2010)[9,10,11].
2.1.2 EXPERIMENTAL
2.1.2.1 Materials:
All the solutions were prepared with double-distilled water.
2.1.2.1.1 Triton X – 100 (0.1M): Triton X-100 was purchased from Qualigens Analytical grade. The TX-100 was cleared of any low-boiling impurities by exposure to vaccum for 3h at 700C following the procedure given by Kumar and Balasubrahmanium[19]. 31.4 g of TX-100 liquid is dissolved 500 ml volumetric flask and made up to the mark to obtain 0.1 mol/dm3 solution. The critical micellar concentration and Cloud point of TX-100 are 2.8×10⁻⁴ [20] 65â-¦C [21] respectively.
2.1.2.1.2 Bromothymol Blue (BTB) : 1.0 g of BTB dye Merck India was dissolved in 5.0 ml of ethanol (99.8%) for dissolution then dilution are made with double distilled water into a 1000 ml volumetric flask up to the mark to obtain an concentration of 1000 mg/dm3(Babak Samiey, Kamal Alizadeh et.al 2004)[22]. In order to avoid fading stock solution was wrapped black color paper. The working solutions of BTB were prepared by appropriate dilutions of the stock solution immediately prior to their use.
2.1.2.1.3 Acetic acid (0.5M). 28.5 ml glacial acetic acid (A.R.grade) Qualigens was diluted with distilled water in a 1000 ml volumetric flask to give 0.5M Acetic acid solution. The solution obtained was diluted to required concentration and standardized as per the procedure (Vogel et. al. 1989)[23] with standard NaOH solution.
2.1.2.1.4 Sodium acetate (0.5M): 13.6 g sodiumacetate.trihydrate, (CH3COONa.3H2O) of Analytical grade Qualigens is dissolved in 100 ml volumetric flask and made up to the mark (Vogel et. al. 1978)[24].
2.1.2.1.5 NaCl (0.1M): 2.922 g pure dry salt of sodiumchloride of analytical grade Qualigens is weighing out and dissolved in 500 ml volumetric flask to give 0.1M NaCl solution(Vogel et. al. 1989)[25].
2.1.2.1.6 Na2SO4 (0.5M): 16.1 g of sodiumsulphate decahydrate,(Na2SO4.10H2O) A.R.grade from Merck (India), is dissolved in 100 ml volumetric flask and made up to the mark to give 0.5M Na2SO4 solution(Vogel et. al. 1989)[26].
2.1.2.1.7 KH2PO4(1.0M): 34.02 g of KH2PO4 of Analytical grade Qualigens is dissolved in 250 ml volumetric flask and made up to the mark (Vogel et. al. 1978)[27].
2.1.2.1.8 Na2HPO4 (1.0M): A.R. grade disodium hydrogen phosphate, Na2HPO4.2H2O, is taken in porcelain crucible and heated until no more water is liberated. Then 17.8 g of this cold residue is taken in 100 ml volumetric flask and made up to the make to give 1.0 M of Na2HPO4 solution (Vogel et. al. 1978)[28]. The reagent is prepared freshly each time.
2.1.2.1.9 Buffer solution of pH4.0(±0.05): 5 ml of 4M sodium acetate (A.R. grade) Qualigens and 20 ml of 4M acetic acid (A.R. grade) Qualigens are mixed in an 100ml volumetric flask and made up to the mark which has resultant pH of 4.0(±0.05) (Vogel et. al. 1989)[29] .
2.1.2.1.10 Buffer solution of pH5.0(±0.05):: 17.5 ml of 4M sodium acetate (A.R. grade) Qualigens and 10 ml of 4M acetic acid (A.R. grade) Qualigens are mixed in an 100ml volumetric flask and made up to the mark which has resultant pH of 5.0(±0.05) (Vogel et. al. 1989)[30] .
2.1.2.1.11 Buffer solution of pH6.0(±0.05): 13.2 ml of1M KH2PO4 (A.R.grade) Qualigens and 86.8 ml of 1M Na2HPO4 (A.R.grade) Qualigens are mixed in 100ml volumetric flask which has resultant pH of 6.0(±0.05) (Vogel et. al. 1989)[31].
2.1.2.1.12 Buffer solution of pH7.0(±0.05): 61.5 ml of 1M KH2PO4 (A.R.grade) Qualigens and 38.5 ml of 1M Na2HPO4 (A.R.grade) Qualigens are mixed in 100ml volumetric flask which has resultant pH of 7.0(±0.05) (Vogel et. al. 1989)[31].
2.1.2.1.13 Buffer solution of pH8.0(±0.05): 94.0 ml of 1M KH2PO4 (A.R.grade) Qualigens and 6.0 ml of 1M Na2HPO4 (A.R.grade) Qualigens are mixed in 100ml volumetric flask which has resultant pH of 8.0(±0.05) (Vogel et. al. 1989)[31].
2.1.2.1.14 Buffer solution of pH9.2(±0.05): 1.905g of Na2B4O7.10.H2O of (A.R.grade) Qualigens is dissolved in 100ml volumetric flask and made up to the mark to obtain 0.05 M of borax solution.The resultant pH of the solution is 9.2(±0.05) (Vogel et. al. 1989)[32].
2.1.2.2 Methodology for cloud point extraction:
2.1.2.2.1 Procedure:
The cloud point temperature was determined by literature method reported by Carvalho et al. [33]. This is based on the ‘visual observation of the separation of phases’ in the micellar solution. The solution was heated gradually in the water bath until turbidity appeared. To verify the results, the opposite process was carried out by cooling gradually with constant stirring and the cloud point was considered as the temperature at which the solution became clear. The reported value was the average of these two determinations; in most cases, these two temperatures were identical, within + 0.5oC.
Cloud point extraction experiment was conducted by using a 10 ml centrifuge tube with a screw cap containing different concentrations of Triton X-100 and BTB and sonicated for 2 minutes for proper mixing. The solution is heated up to 80ËšC in a thermostatic temperature bath for 20 min. The turbid solution was then centrifuged at 3500 rpm for 5 min and cooled in an ice bath for 2 minutes in order to separate the phases. Both the phases are separated and the volumes of surfactant rich phase (coacervate phase) and dilute phases were measured. Average of three determinations is reported in all cases. The concentration of dye in both the phases has been measured by using PerkinElmer lamda-25 UV-Visible spectrophotometer. In order to determine the influence of the reagents added to the surfactant phase, cloud point determinations were performed with the additions of buffer, dye and inorganic salts. The procedure for the determination of critical temperature was the same as above, but using only a fixed surfactant concentration. The phase diagram for Triton X-100 was obtained by measuring the cloud point temperature of aqueous surfactant solutions at different concentrations.
2.1.2.2.2 Spectra and calibrated graph
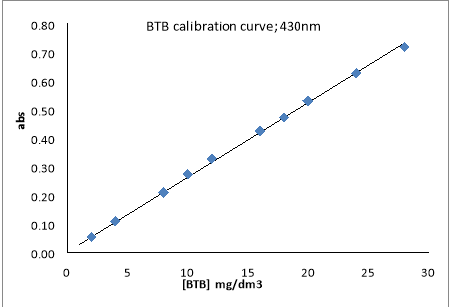
The concentration of the dye was determined by U.V-visible spectrophotometer (PerkinElmer lamda-25). Pure BTB was initially calibrated separately for different concentrations in terms of absorbance units, which were recorded at wavelength 430 nm, at which maximum absorption takes place (Figure 2.1.2, 2.1.3). No significant change in the absorbance has been observed even in the presence of TX-100. Therefore all the absorbance measurements were performed at this wave length.
Figure 2.1.2 Spectra of BTB dye
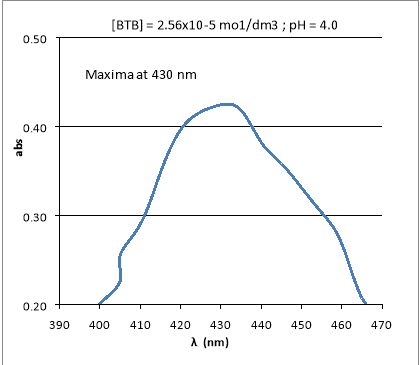
Figure 2.1.3 Calibration curve of BTB dye
2.1.2.2.3 Determination of Phase volume Ratio, Fractional coacervate phase volume and pre-concentration factor
The volumes of the respective surfactant-rich and aqueous phases obtained after the separation of phases were determined using calibrated centrifuge tubes for calculating the pre concentration factor. Surfactant solutions containing typical amounts of the BTB were extracted using the CPE procedure, followed by the measurement of the respective phase volumes. The results reported are the average of three determinations.
The phase volume ratio is defined as the ratio of the volume of the surfactant-rich phase to that of the aqueous phase. It is calculated using the following formula.
 —— (2.1.1)
Where RV is the phase volume ratio, VS and VW are volumes of surfactant-rich phase and aqueous phase respectively.
The pre-concentration factor, (fC) is defined as the ratio of the volume of bulk solution before phase separation (Vt) to that of the surfactant-rich phase after phase separation (Vs).
 —— (2.1.2)
Where Vt and VS are the volumes of the bulk solution before phase separation and the surfactant-rich phase respectively.
The fractional coacervate phase volume with the feed surfactant concentration is calculated by using the relationship:
 —— (2.1.3)
Where FC is the fractional coacervate volume and Cs is the molar concentration of the feed surfactant solution, for fixed feed dye concentration, the parameters a and b vary linearly with temperature. The value of Fc lies in between 0.04-0.23 for various operating conditions.
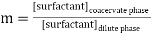
Surfactant partition coefficient (m) is defined as the ratio of concentration of surfactant in coacervate and dilute phase.
 ——- (2.1.4)
The efficiency of extraction is defined as
 —- (2.1.5)
2.1.4 Discussion:
This section is divided into four parts. In first part, factors influencing the extraction efficiency (e.g., concentrations of non-ionic surfactants, dye and salt, temperature and pH of the solution), fractional coacervate phase volume have been discussed. The nature of solubilization isotherm at different temperature has been presented in the second part. In the third and fourth parts, thermodynamic parameters and a calculation procedure for the determination of surfactant requirement for the dye removal to a desired level is briefly discussed.
2.1.4.1 Factors influencing efficiency:
For ionizable solutes, the charge of the solute can greatly influence its extent of binding to a micellar assembly [34]. The ionic form of a molecule normally does not interact with and bind the micellar aggregate as strongly as does its neutral form. ‘Thus adjustment of the solution pH for maximum extractability is of special importance when controlling experimental variables in CPE.
With increasing pH, the efficiency of extraction increases up to pH 8.0 and then decreases. This is in accordance with the decrease in cloud point till pH 8.0 and a sudden increase at pH 9.2. Further, the pK value of BTB is 7.1. In the absence of any buffer solution, pH of the dye solution is 7.0 and there is no change in pH event after the extraction process is completed. Hence, all the parameters were optimized at this fixed pH of the medium. No significant increase in efficiency is observed with increasing [Dye] since the cloud point is not altered much with increasing the concentration of dye.
The extraction efficiency of dye increases with the increase of surfactant concentration. The concentration of the micelle increases with the surfactant concentration, resulting in more solubilisation of dye in micelles. The surfactant concentration in the dilute phase remains constant (and equal to around CMC); the surfactant concentration along with the solubilised dye in the coacervate phase (micellar phase) increases to maintain the material balance[42-46]. The extraction of dye with TX-100 solution is due to hydrophobic interaction between BTB and hydrophobic micelles in the solution. However, with the increase of TX-100 concentration, the analytical signal becomes weak due to the increase in the final volume of the surfactant rich phase that causes pre concentration factor (phase volume ratio) to decrease [35]. In view of these observations, a 0.04 mol/dm3 triton X- 100 is used throughout.
It has been shown that the presence of electrolyte can change the CP in different ways[36]. Salting out electrolyte such as NaCl, decreases the cloud point temperature. They can promote the dehydration of ethoxy groups on the outer surface of the micelles, enhancing the miceller concentration leading to solubilisation of more dye and resulting in a more efficient extraction [37] and reduce the time required for phase separation. A lower salt concentration gives a smaller pre concentration factor, due to the larger volume in the surfactant-rich phase at lower salt concentrations [38]. As shown in the fig the ability of salts to enhance extraction efficiency of the dye was in the order of Na2SO4>NaCl.
Temperature has pronounced effect on the extraction of solute. (i) At high temperature, CMC of non-ionic surfactant decreases. (ii) the non-ionic surfactant becomes more hydrophobic due to dehydration of ether oxygen [39] and increase in micellar concentration and solubilization.
A general preconcentration factor of 20-60 was obtained with this CPE method and similar pre concentration has been reported for other analytes (40). Typical preconcentration factors reported in the literature[41] varïed fiom 10 to 100. The CPE method gives a better preconcentration factor compared to conventional solvent extraction methods. In general, high pre concentration factors in CPE can be achieved using small amounts of surfactants which have large capacity to accommodate dye molecules. The hydrated nature and relative polarity of micelles, on the other hand, limit the extraction of dye into the surfactant-rich phase.
From the viewpoint of concentrating the analytes present in aqueous solutions, the larger pre concentration factor, e.g., the smaller phase volume in the surfactant-rich phase is desired. A lower surfactant concentration gives a higher pre concentration factor. However, it becomes very difficult for sampling and accurate analysis with a very small volume of the surfactant-rich phase. On the contrary, excessive amount of added salt of “salting-out” effect can give the higher pre concentration factor, but it is likely forming the very viscous liquid crystalline phase, instead of the fluidic Liquid phase, in the system, making it difficult to separate the surfactant-rich phase. Therefore, optimization of the pre concentration factor is very critical in a feasible CPE technique. Hence, surfactant concentration of 0.04 mol/dm3 was chosen to conduct CPE experiments in this research.
2.1.4.2 Solubilization isotherm:
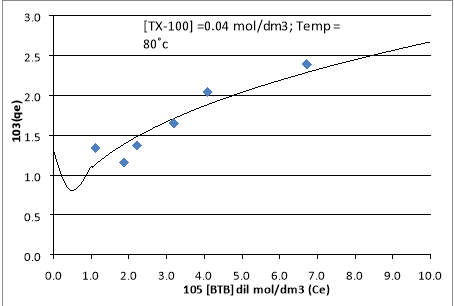
The adsorption isotherm relating moles of solute solubilized per mole of surfactant[50] are presented in Figure2.1.8.
The isotherm can be expressed according to Langmuir type expression:
 —— (2.1.6)
Where, both m and n are functions of temperature.
Figure 2.1.8 Solubilisation curve of BTB dye
Assuming a homogeneous monolayer adsorption, the linearized Langmuir sorption model of equation (2.1.6) can be written as:
 —— (2.1.7)
Plot of 1/qe vs. 1/Ce over the entire dye concentrations was linear with a correlation coefficient of 0.983 as shown in Figure 2.1.9. Thus, the solubilization of dye obeys the Langmuir adsorption model. The calculated values of Langmuir parameters m and n from the slope and intercept of the linear plot of 1/qe vs. 1/Ce were found equal to 4.29X 10⁻³ (mol/mol) and 2.04X10⁴ dm3 /mol, respectively.
Figure 2.1.9 Langmuir isotherm of BTB dye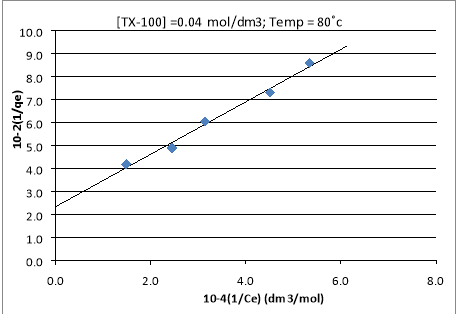
2.1.4.3 Thermodynamic parameters: The overall thermodynamic parameters ΔG0, ΔS0 and ΔH0 were calculated using equations (2.1.8, 2.1.9) [48,49]as follows.
 —— (2.1.8)
 ——- (2.1.9)
Where T is the temperature in (K), qe/Ce is called the solubilization affinity.
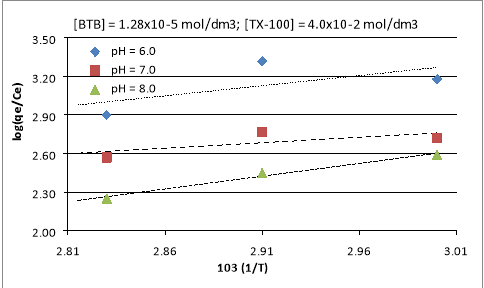
ΔS0 and ΔH0 are obtained from a linear plot of log (qe/Ce) versus (1/T), from Eq. (2.1.8) and. Once these two parameters are obtained, ΔG0 is determined from Eq. (2.1.9) and presented in Table 2.1.6. Plot of log (qe/Ce) versus (1/T) is shown in Figure 2.1.10.
|
Table 2.1.6 : Thermodynamic parameters Temp = 80±0.1Ëšc; [BTB]initial =12.80×10⁻⁵ mol/dm3 ; [TX-100] =4.0×10⁻² mol/dm3 |
|||||
|
pH ( ±0.05) |
-∆G ( KJ/mole ) |
∆S ( KJ/mole/K ) |
∆H ( KJ/mole ) |
||
|
353 |
343 |
333 |
|||
|
6.0 |
19.57 |
16.93 |
14.28 |
0.27 |
73.92 |
|
7.0 |
22.11 |
18.75 |
15.38 |
0.34 |
96.76 |
|
8.0 |
21.10 |
18.63 |
16.16 |
0.25 |
66.06 |
Figure 2.1.10 log (qe/Ce) versus (1/T)
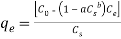
2.1.4.4 Design of experiment: The amount of surfactant required can be evaluated from the residual dye present in the dilute phase of the solution after conducting cloud point extraction can be determined [45].
qe is the mole of dye solubilized per mole of non-ionic surfactant.
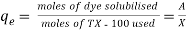 —— (2.1.10)
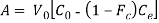
Moles of dye solubilized can be obtained from mass balance equation,
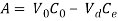 —— (2.1.11)
 —— (2.1.12)
Where, A is the moles of dye solubilized in the micelles, V0 and Vd are the volume of the feed solution and that of the dilute phase after CPE, C0 and Ce are concentration of the BTB dye after CPE respectively; Cs is the concentration of surfactant in feed.
From the equation 2.1.10, 2.1.11 and 2.1.12 we can write,
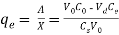 —— (2.1.13)
Moles of dye solubilized can be obtained from mass balance equation,
Where, qe is the mole of dye solubilized per mole of non-ionic surfactant, x is moles TX-100 used, A is the moles of dye solubilized in the micelles, V0 and Vd are the volume of the feed solution and that of the dilute phase after CPE, C0 and respectively; Cs is the concentration of surfactant in feed.
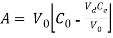 —— (2.1.14)
Now, by involving the definition of fractional coavervate volume in the above equation we get,
 —— (2.1.15)
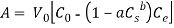 ——- (2.1.16)
Where a,b are the parameters a and b which are functions of temperature.
Substituting the above equation in equation (8) we get,
 ——- (2.1.17)
Substituting the above equation in equation (1) and rearranging we get,
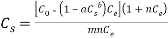 ——– (2.1.18)
From the above equation the desired surfactant required (Cs) can be obtained knowing the value of m and n the Langmuir constants, a and b the operating temperature constants, Ce the amount of dye in dilute phase after cloud point extraction.
By using the above equation experiments which are conducted were compared for surfactant used and required are shown in Table 2.1.8.
|
Table 2.1.8: Comparison data of required and used TX-100 at 80ËšC |
|||
|
105 [BTB]initial mol/dm3 |
105[ BTB]dilute mol/dm3 |
102[ TX-100 ]used mol/dm3 |
102[ TX-100 ]Required mol/dm3 |
|
3.20 |
1.11 |
4.00 |
2.64 |
|
6.40 |
1.87 |
4.00 |
3.82 |
|
8.00 |
2.22 |
4.00 |
4.32 |
|
9.60 |
3.19 |
4.00 |
3.79 |
|
12.80 |
4.09 |
4.00 |
4.46 |
|
16.00 |
6.72 |
4.00 |
3.74 |
|
8.00 |
3.60 |
3.00 |
2.42 |
|
8.00 |
1.73 |
4.50 |
4.32 |
|
8.00 |
1.18 |
5.00 |
5.60 |
Cite This Work
To export a reference to this article please select a referencing stye below:
Related Services
View all


DMCA / Removal Request
If you are the original writer of this essay and no longer wish to have your work published on UKEssays.com then please click the following link to email our support team:
Request essay removal