Adsorption of Volatile Organic Compounds
| ✅ Paper Type: Free Essay | ✅ Subject: Chemistry |
| ✅ Wordcount: 2817 words | ✅ Published: 29 Jan 2018 |
ADSORPTION OF VOLATILE ORGANIC COMPOUNDS ON DIFFERENT TIMBER SPECIES
- Marco Vasconcelos1, Nereida Cordeiro1,2*
ABSTRACT
Due to the health issues associated to VOC, this work aims to study the adsorption of these compounds onto timbers, in order to improve air quality. For this task, inverse gas chromatography (IGC) was used to characterize surface properties (surface energy, specific free energy and enthalpy of adsorption). Dispersive component of the surface energy (γSD) ranged from 39.95 to 43.81 mJ/m2, corresponding to Amburana and Courbaril respectively. Yellow Pine shows higher values of the specific free energy of adsorption (ï„Gºs), indicating a higher number/energy of polar active sites. On the other hand, the enthalpy of adsorption values (∆Hs) don’t go in agreement with ï„Gºs, probably due to its temperature-dependence. That said, the ∆Hs values indicate a basic surface and Amburana establishes stronger interactions with polar probes while Yellow Pine establishes stronger interactions with cyclohexane. Additionally, the “thermodynamic compensation effect” was evaluated on these samples, being observed linearity in Yellow Pine, Grapia and Brazilian Mahogany. The slope was similar between the different species, indicating a similar adsorption mechanism.
Keywords: Inverse Gas Chromatography, Surface Properties, Wood Fibers, Volatile Organic Compounds, thermodynamic compensation effect
1. INTRODUCTION
Volatile organic compounds (VOC) are organic compounds produced in industries, motor vehicles, power plants, etc. They are usually distinguished by boiling temperatures under 250ºC, at standard atmospheric pressure (1 atm), and with high vapor pressures, surpassing 0.5 kPa at 25ºC (Dobre, Pârvulescu, Iavorschi, Stroescu, Stoica, 2014). The aforementioned compounds have harmful impact on human health, such as eye and throat irritation, damage to the liver, central nervous system and carcinogenic effects, due to prolonged exposure (Das, Gaur, Verma, 2004). Therefore, reducing the VOC concentration on the atmosphere is an important task in order to improve air quality and avoid health issues.
Wood fibers consist in both dead and living cells, being at a macroscopic level organized within a layer of xylene, in the wood. From the chemical point of view, consists mostly in cellulose, followed by hemicellulose and lignin. Due to the hydrogen bonds established by the hydroxyl groups of cellulose of the surface, it affects strongly on the properties of the material, such as hydrophobicity and therefore its reactivity (Hodzic, Shanks, 2014). About 80.5% of the wood fibers are used in the paper industry and around 17% for wood fibers modification (composites: Kazayawoko, Balatinecz, Romansky, 1997; Adusumali, Reifferscheid, Weber, Roeder, Sixta, Gindl, 2006; Cao, Hu, Liu, 2008).
In this work, Inverse gas Chromatography (IGC) was used to characterize the surface properties (surface energy, specific free energy and enthalpy of adsorption) of Amburana, Yellow Pine, Grapia, Courbaril and Brazilian Mahogany to evaluate the adsorption of some VOC (Chloroform, cyclohexane, ethyl acetate, benzene and toluene). Additionally, the “thermodynamic compensation effect” was studied to investigate the mechanism of thermodynamic adsorption on the different samples analyzed.
2. MATERIALS AND METHODS
2.1 Materials
Methane (>99.99% purity) was used an inert reference probe and the carrier gas utilized was helium (>99.99% purity), both supplied by Air Liquide Company. The probe molecules were supplied by Sigma–Aldrich with GC grade (>99% purity).
2.2 iGC analysis
iGC measurements were carried out, at least, in duplicate, on a commercial inverse gas chromatograph (Surface Measurements Systems, London, UK) equipped with a flame ionization (FID), thermal conductivity (TCD) and mass spectrometer (MS) detectors. Standard glass silanized (dymethyldichlorosilane; Repelcote BDH, UK) columns with 0.4 cm ID and 30 cm in length were used.
About 1.5 g of timber sawdust mesh 40-60 was packed by vertical tapping for 10 min. The columns, with the samples, were pre-treated for 2h at 343 K and 10 ml/min of flow rate, to remove the impurities adsorbed on the surface and 2h at the measurement conditions. After pre-treatment, pulse injections were carried out with a 0.25 ïl gas loop. The iGC system was fully automated with purpose written control software (SMS iGC Controller v1.3) and data were analyzed using iGC Standard v1.3 and Advanced Analysis Software v1.21. The presented results are the average of the values obtained for each sample with a standard deviation minor than 5%.
Measurements of the dispersive interaction were made with n-alkanes (n-decane, n-nonane, n-octane, n-heptane and n-hexane) at 298 K, at 0% RH. The carrier gas (Helium) flow rate was 10 ml/min. To acid-base studies cyclohexane, benzene, chloroform, toluene and ethyl acetate were used at 0% RH. Heat of sorption measurements were done with the polar probes at 298 K, 0% RH, and 10 ml/min flow rate.
3. RESULTS AND DISCUSSION
3.1 – Dispersive component of the surface tension
The solvent–sorption properties of the timbers were studied at infinite dilution condition in order to remove the interactions between the probe molecules adsorbed at the surface of the samples. The methane injection allows the calculation of the dead time and subtracts it to the retention time in order to obtain the retention volume (Thielmann, 2004). The corrected net retention volume VN is given by:

where Vd is the mobile phase hold-up volume (called dead volume), and VR the measured retention volume. The 0 superscript indicates a correction for the column pressure drop given by j:
 where
where 
where T is the column temperature, F is the exit flow rate at 1 atm and 273.15K, tR is the retention time and t0 is the mobile phase hold-up time.
The dispersive component of the surface energy, as well as the specific free energy of sorption, was measured with dispersive and acid-base probe molecules. The relation between the retention volume and free energy of sorption ∆GºS is given by the following equation:
∆G0S = RTln VR0 + K
where R is the gas constant and K is the De Boer or Kemball/Rideal constant depending on the chosen reference state (De Boer, 1953; Kemball & Rideal, 1946). Moreover, ∆G0S is related to the energy of adhesion WA (between probe molecule and solid) by the equation:
∆G0S = NAaWA
where a is the cross sectional area of the adsorbate and NA the Avogadro constant. According to Fowkes (1964), the dispersive contribution of the work of adhesion WA is given by:
WA = 2(γSDγLD)1/2
with γSD and γLD as the surface tension of the adsorbent and the adsorbate respectively. Combining the equations above:

Thus, the dispersive component of the surface tension (γSD) values could be calculated based on the plots of RT lnV0R vs a(γLD)1/2 for the adsorption of n-alkane probes, as illustrated in Figure 1. Good linear correlations (0.9991-0.9996) were obtained for the n-alkane series for all samples analyzed. The calculated γSD values are given in Table 1 and show very similar results between the different timber species. The surface energy ranged from 39.95 to 43.81 mJ/m2, corresponding to Amburana and Courbaril respectively. These values are similar to those reported by Kazayawoko, Balatinecz, Romansky (1997) and Shu, Xu, JinWei, BaoLi (2007) for wood flour (35.6 mJ/m2 at 323K) and ashtree wood meal (36.52 mJ/ m2 at 323K) respectively. Gouveia, Cordeiro and John (2011) reported various lignocellulosic fibres (flax, hemp, kenaf, agave, agave hybrid pineapple, and sisal), with γSD values ranged from 37.17 to 51.37 mJ/ m2 (at 298K).
In the same article aforementioned, it’s also explained that variations in the γSD values can be due to the different composition, growing conditions of the fibers and method of extraction. The latter is justified due to the fibers being usually covered by a layer of wax, and may interfere with elutant-fiber interactions. When removed during the method of extraction it’s expected to change drastically the surface energy.
3.2 – Polar probes sorption studies
A widespread approaching to the Lewis acid/base surface interactions can provide better perceptive of the chemical-physical properties of the timber surfaces. The presence of acid and base active sites on the surfaces increases the possibility of specific intermolecular interactions with solvents and others compounds.
The specific free energy of sorption, ï„Gºs was determined by the distance between the “alkane line” and the points corresponding to the ΔGºs value of polar probes (Gamble, Leane, Olusanmi, Tobyn, Supuk, 2012).
ï„Gºs = RTln(VN) – RTln(VNref)
The ï„Gºs values are given in Table 2 and represented in Figure 2. Chloroform was used as an acid probe on this work. The values ranged from 0.53 to 2.50 kJ/mol, corresponding to Brazilian Mahogany and Yellow Pine respectively. Based on the results obtained, the ï„Gºs values of Chloroform decrease in the following order Pine > Grapia > Courbaril > Amburana > Mahogany. This observation indicates that Yellow Pine may have a higher quantity/energy of active sites with basic character compared to the other fibers.
A similar order was observed on Cyclohexane, indicating that Yellow Pine might also have a higher quantity/energy of active sites with apolar character. Although, the same order is not observed in γSD, since that for the surface energy were used n-alkanes and due to the shape of cyclohexane and consequent different steric hindrance, it will have different interactions with the surface. On the other hand, Brazilian Mahogany shows the lowest ï„Gºs values for the overall probes, indicating a lower quantity/energy of active sites.
Ethyl acetate was used as a basic probe in Amburana, Yellow Pine and Courbaril. The interaction of this probe, alongside chloroform, with the timber surface indicates the presence of both acidic and basic sites on the solid surface.
3.3 – Heat of sorption measurements
In the infinite dilution region, where the isotherm is linear, VN should be measured at a range of column temperatures and ln(VN/T) plotted vs. 1/T, which yields the heat of sorption ∆Hs according to (Conder & Young, 1979):

To determine the enthalpies of sorption (ï„HS) of the VOC’s in the timber species, the specific retention volume (VN) was measured at different temperatures (293 to 298K) and the retention diagrams ln VN vs 1/T were plotted (Fig. 3-7).
Some of VOC´s couldn’t be used in some of the timber species because the retention time was too low to make accurate calculations due to the peak overlap.
The ∆Hs values are given in Table 3, determined at three different temperatures. Good linear correlations (>0.99) were obtained for the probes used, as shown in Figures 3-7. In this work, the ∆Hs values for the basic probes (Ethyl acetate; Higher DN/AN*) were lower than the ∆Hs values for the acid probes (Chloroform; Lower DN/AN*), indicating a basic character of the solid surface. Cordeiro, Mendonça, Pothan and Varma (2012) and Gouveia, Cordeiro and John (2011) observed the same basic character in macro and nanobanana fibers, flax, hemp, kenaf, agave, agave hybrid pineapple, and sisal.
For chloroform, the ∆Hs values decreased in the following order: Amburana > Brazilian Mahogany > Grapia > Courbaril > Yellow Pine. At first sight it indicates that Amburana establishes stronger interactions with the surface, compared with the other timbers. On the other hand, Yellow Pine establishes the weakest interactions with chloroform. A similar order was also observed for cyclohexane, for the exception of Yellow Pine, that shows the highest ∆Hs value for this probe.
The results don’t go in agreement with the ones obtained from the specific free energy of adsorption study, probably due to the fact that the temperature might influence the ï„Gºs values and therefore it might mislead to incorrect conclusions. Thus, the ∆Hs values will give a better insight of which timber is advised (or not) to remove VOC from the atmosphere since it already have in account the temperature. Being said, the results indicate that for polar probes Amburana have stronger interactions while for apolar probes Yellow Pine have stronger interactions.
3.4 – Entropy of Sorption calculation
The linear dependence between ΔHS and ΔSS is called “Thermodynamic Compensation Effect”. Normally, stronger intermolecular interactions (related to ΔHS) result in less degrees of freedom of the elutant, leading into a greater order of the system, decreasing the entropy of the system (Liu L., Guo Q-X., 2001). The entropy of sorption was directly calculated according to:

Figure 8 represents the entropy-enthalpy correlation, being only observed on Yellow Pine, Grapia and Brazilian Mahogany. All three dependences are linear and almost parallel, with a slope between 2.79×10⁻³ and 3.73×10⁻³ K-1. Therefore, these three samples follow the previous equation. According to Korolev A. et al., (2011), a similar slope indicates similar adsorption mechanism on the samples studied on this work. Since all the samples have similar composition, it was expected the same adsorption mechanism between them.
4. CONCLUSION
IGC was used to evaluate different surface properties, namely surface energy, specific free energy and enthalpy of adsorption. The γSD values were measured at 298K and ranged from 39.95 to 43.81 mJ/m2. These variations between results are due to different composition, growing conditions and method of extraction.
The results don’t go in agreement between enthalpy of adsorption and the specific free energy of adsorption probably due to the influence of the temperature on the ï„Gºs. In Yellow Pine were observed higher ï„Gºs values for chloroform and cyclohexane compared to the other fibers, indicating a higher quantity/energy of active sites with basic and apolar character. In Amburana, Yellow Pine and Courbaril, the basic probes showed lower ∆Hs values compared to acid ∆Hs values, indicating a basic character. The same was observed on other fibers found in literature. Amburana establishes stronger interactions with Chloroform while Yellow Pine establishes stronger interaction with cyclohexane, compared to the other timber species.
The “Thermodynamic Compensation Effect” was only observed in Yellow Pine, Grapia and Brazilian Mahogany, with linear fits almost parallel. The slope ranged between 2.79×10⁻³ and 3.73×10⁻³ K-1. Similar slopes indicate similar adsorption mechanism, which makes sense due to similar composition.
ACKNOWLEDGEMENT
References
Adusumali R-B, Reifferscheid M, Weber H, Roeder T, Sixta H, Gindl W. Mechanical properties of regenerated cellulose fibres for composites. Macromolecular Symposia 2006, 244: 119–25.
Cao S., Hu B., Liu H. Synthesis of pH-responsive crosslinked poly[styrene-co-(maleic sodium anhydride)] and cellulose composite hydrogel nanofibers by electrospinning. Polymer International 2009, 58: 545–551.
Cordeiro N., Gouveia C., John M. J. Investigation of surface properties of physico-chemically modified natural fibers using inverse gas chromatography. Industrial Crops and Products 2011, 33: 108–115.
Cordeiro, N., Mendonça, C., Pothan, L. A., & Varma, A. Monitoring surface properties evolution of thermochemically modified cellulose nanofibres from banana pseudo-stem. Carbohydrate Polymers 2012, 88, 125–131.
De Boer, J.H., 1953. The Dynamic Character of Chemisorption, 2nd Ed., Clarendon Press, Oxford.
Gamble J., Leane M., Olusanmi D., Tobyn M., Supuk E., Khoo J., Naderi M., 2012, Surface energy analysis as a tool to probe the surface energy characteristics of micronized materials – A comparison with inverse gas chromatography; International Journal of Pharmaceutics; 422: 238-244
Kemball C., Rideal, E.K. The Adsorption of Vapours on Mercury. I. Non-Polar Substances. Proceedings of the Royal Society A 1946, 187: 53–73.
Korolev A., Shiryaeva V., Popova T., Kurganov A. Enthalpy–entropy compensation effect on adsorption of light hydrocarbons on monolithic stationary phases, Journal of Separation Science 2011, 34, 2362-2369.
Liu L., Guo Q.-X. Isokinetic relationship, isoequilibrium relationship, and enthalpy–entropy compensation. Chemical Reviews 2001, 101: 673–695.
M. Kazayawoko, J. Balatinecz, M. Romansky. Thermodynamics of adsorption of n-alkanes on maleated wood fibers by inverse gas chromatography. Journal of Colloid Interface Science 1997, 190: 408-415.
Thielmann F, 2004, Introduction into the characterization of porous materials by Inverse Gas Chromatography, Journal of Chromatography A, 1037: 115–123.
Zhao S., Lin X., Song J. & Shi B.. Surface characterization of ashtree wood meal by inverse gas chromatography. Chinese Science Bulletin 2007, 52: 1178-1181.
Conder, J., Young, C. (1979). Physicochemical measurement by Gas Chromatography. Chichester: John Wiley & Sons Ltd.
TABLE CAPTIONS
Table 1 – Dispersive component of the surface tension (γSD).
Table 2 – Specific free energy of sorption (ï„GºS).
Table 3 – Enthalpy of sorption (ï„HS).
Table 4 – Entropy of sorption (ΔSS).
Table 1
|
Timber specie |
γSD (mJ/m2) |
|
Amburana (Amburana cearensis) |
39,95 |
|
Yellow Pine (Pinnus spp.) |
41,30 |
|
Grapia (Apuleia leiocarpa) |
42,30 |
|
Courbaril (Hymenaea spp.) |
43,81 |
|
Brazilian Mahogany (Swietenia macrophylla) |
42,65 |
Table 2
|
ΔG (kJ/mol) |
|||||
|
Amburana (Amburana cearensis) |
Yellow Pine (Pinnus spp.) |
Grapia (Apuleia leiocarpa) |
Courbaril (Hymenaea spp.) |
Brazilian Mahogany (Swietenia macrophylla) |
|
|
Chloroform |
0,78 |
2,50 |
2,06 |
1,36 |
0,53 |
|
Cyclohexane |
2,85 |
3,78 |
3,38 |
2,81 |
2,21 |
|
Ethyl acetate |
6,69 |
7,62 |
7,95 |
||
|
Benzene |
2,40 |
||||
|
Toluene |
2,83 |
1,92 |
|||
Table 3
|
ΔH (kJ/mol) |
|||||
|
Amburana (Amburana cearensis) |
Yellow Pine (Pinnus spp.) |
Grapia (Apuleia leiocarpa) |
Courbaril (Hymenaea spp.) |
Brazilian Mahogany (Swietenia macrophylla) |
|
|
Chloroform |
33,85 |
14,40 |
28,93 |
20,51 |
31,52 |
|
Cyclohexane |
34,18 |
40,69 |
20,86 |
20,22 |
31,59 |
|
Ethyl acetate |
28,95 |
11,18 |
18,27 |
||
|
Benzene |
25,71 |
||||
|
Toluene |
25,07 |
36,66 |
|||
Table 4
|
ΔS (kJ/mol) |
|||||
|
Amburana (Amburana cearensis) |
Yellow Pine (Pinnus spp.) |
Grapia (Apuleia leiocarpa) |
Courbaril (Hymenaea spp.) |
Brazilian Mahogany (Swietenia macrophylla) |
|
|
Chloroform |
116,20 |
56,69 |
103,99 |
73,36 |
107,57 |
|
Cyclohexane |
124,28 |
149,24 |
81,34 |
77,28 |
113,43 |
|
Ethyl acetate |
119,59 |
63,08 |
87,96 |
||
|
Benzene |
94,31 |
||||
|
Toluene |
93,60 |
129,46 |
|||
FIGURE CAPTIONS
Figure 1 – Energy of adsorption vs a(ï§DL)1/2 for n-alkanes on the timbers (Amburana, Grapia, Courbaril, Brazilian Mahogany and Yellow Pine) surface at 298K and 0%RH.
Figure 2 – Specific free energy of the adsorption (ï„Gºs) of Chloroform and Cyclohexane onto samples analyzed at 298K.
Figure 3 – Enthalpy of sorption plot and linear fits for cyclohexane, chloroform and ethyl acetate measurement on Amburana timber surface 293-298K, at 0 % RH and 10ml/min.
Figure 4 – Enthalpy of sorption plot and linear fits for cyclohexane, chloroform and ethyl acetate measurement on Yellow Pine timber surface 293-298K, at 0 % RH and 10ml/min.
Figure 5 – Enthalpy of sorption plot and linear fits for cyclohexane, chloroform and benzene measurement on Grapia timber surface 293-298K, at 0 % RH and 10ml/min.
Figure 6 – Enthalpy of sorption plot and linear fits for cyclohexane, chloroform and ethyl acetate measurement on Courbaril timber surface 293-298K, at 0 % RH and 10ml/min.
Figure 7 – Enthalpy of sorption plot and linear fits for cyclohexane, chloroform and toluene measurement on Brazilian Mahogany timber surface 293-298K, at 0 % RH and 10ml/min.
Figure 8 – Entropy-enthalpy compensation effect on Yellow Pine, Grapia and Brazilian Mahogany.

Figure 1

Figure 2

Figure 3

Figure 4

Figure 5

Figure 6

Figure 7
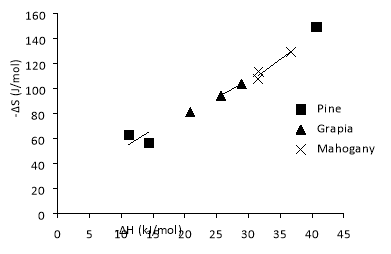
Figure 8
Cite This Work
To export a reference to this article please select a referencing stye below:
Related Services
View all


DMCA / Removal Request
If you are the original writer of this essay and no longer wish to have your work published on UKEssays.com then please click the following link to email our support team:
Request essay removal