Salt as a Pollutant for the Inhibition of growth for Ankistrodesmus Algae
| ✅ Paper Type: Free Essay | ✅ Subject: Biology |
| ✅ Wordcount: 2279 words | ✅ Published: 23 Sep 2019 |
Salt as a Pollutant for the Inhibition of growth for Ankistrodesmus Algae
Introduction:
Around the world pollution has become a major issue effecting everyone. This includes the water we drink, the air we breathe and also the bodies of water we swim in! Unsafe drinking water kills more people than warfare and all other forms of violence combined around the world. (“Decade, Water for Life, 2015, UN-Water, United Nations, MDG, Water, Sanitation, Financing, Gender, IWRM, Human Right, Transboundary, Cities, Quality, Food Security.” United Nations, United Nations, www.un.org/waterforlifedecade/quality.shtml.)
Personally, I have never pictured salt to be an issue to the environment. A lot of salt is made by nature so how could it possible aid to pollution? Well, theguardian.com states that “The USGS report is the first comprehensive look at the growing levels of salts in surface water across the country. About 71% of the salinity can be attributed to natural sources. But the remaining 29% are manmade, and about 49% of those come from compounds commonly used to remove snow and ice from roadways. Wastewater discharges from urban communities that contain a jumble of chemical products we use, from toothpaste to detergent, also contain salts that end up in the rivers. A third of the human contributions come from farms and pasture land.” (Wang, Ucilia. “The Great Salt Mess: Pollution Threatens US Fresh Water Resources.” The Guardian, Guardian News and Media, 21 Aug. 2014, www.theguardian.com/sustainable-business/2014/aug/21/geological-survey-salinity-pure-water-shortage-chemical-runoff-agribusiness-watershed.) This salt build up is causing more money to have to be spent on desalination plants to make the water we drink sanitary and safe.
In able to better understand why it is that salt is becoming such a growing issue, our group decided to examine whether a pollutant will inhibit the growth of algae known as Ankistrodesmus algae or speed up the growth. Our hypothesis was that the salt solution would inhibit the growth of Ankistrodesmus algae.
In orderto be able to conduct this experiment, we needed to have the following materials: Salt, more formally know as sodium chloride, Alga-Gro (for diluting the salt and a solution that helps algae grow),and Ankistrodesmus algae (which is grown in the Alga-Gro). Also needed for the experiment is the following equipment: Spectrophotometer (machine used to measure growth), 12 10 mL test tubes, a graduated cylinder (for a precise measurement), a vortex machine (to circulate the mixture in our test tubes), a stirring rod, a pipet (to get a precise amount and to fit the substances neatly into the test tubes), a scale (to weigh out the salt), and a scoopula (to scoop the salt from the bottle to get an accurate amount).
Here is the experiment procedure used in a nut shell. First, we prepared our salt solution and diluted it with Alga-Gro. Then, we made our test tubes including: a control tube, an experimental tube 1, experimental tube 2, and an experimental tube 3. Then to prevent sampling error we set our tubes up in duplicates, meaning we made 4 more test tubes with exactly the same substances. We then prepared a blank tube for each of our control tubes. Each blank contains no algae culture. Then, we determined what our maximum absorbance wavelength should be for the algae. Finally, we collected our data over the course of 14 days and determined how the salt affected the growth of the Ankistrodesmus algae.
Methods:
Before beginning our experiment, we had to go collect the salt, a scale, a scoopula, and the scale. Our TA had already set out the algae under question to be used and prepared the Alga-Grow solution. We dilute the salt in Alga-Gro because it ensures us that, regardless of how much salt and Alga-Gro solution we add to our test tubes, they will all have the same amount of Alga-Gro.
Since we had our stock solution, we needed to establish our controls and decide what concentrations of our pollutant should be tested in the experiment to provide a variety of effects on growth at each percent concentration. The chart below shows how we set up our test tubes, what our controls were, and the percent concentration of our pollutant solution in each tube.
|
|
Negative Control Tube |
Tube 1 |
Tube 2 |
Tube 3 |
|
Ankistrodesmus Culture Solution |
5 mL |
5 mL |
5 mL |
5 mL |
|
Alga-Gro |
5 mL |
2.5 mL |
1 mL |
0 mL |
|
Miracle-Gro |
0 mL |
2.5 mL |
4 mL |
5 mL |
|
Total Volume |
10 mL |
10 mL |
10 mL |
10 mL |
|
Final % Pollutant |
0 % |
25 % |
40% |
50 % |
We had two control tubes (labeled “Control A” and “Control B”), two tube 1’s (“Tube 1 A” and “Tube 1 B”), two tube 2’s (“Tube 2 A” and “Tube 2 B”), and two tube 3’s (“Tube 3 A” and “Tube 3 B.”) Now there are a total of eight test tubes that are needed for our experiment. We also need to create “blanks” for each test tube since we were using the spectrophotometer to measure the amount of growth of the Ankistrodesmus algae. These tubes contained no Ankistrodesmus algae but did contain the salt and alga-grow solution.
This table lists how our “blanks” were set up and what percentage of pollutant concentrations are in each tube, as well as, the amount of Salt and Alga-Gro that were put into each.
|
|
Negative Control Tube Blank |
Tube 1 Blank |
Tube 2 Blank |
Tube 3 Blank |
|
Alga-Gro |
10 mL |
7.5 mL |
6 mL |
5 mL |
|
Pollutant (at stock concentration) |
0 mL |
2.5 mL |
4 mL |
5 mL |
|
Total Volume |
10 mL |
10 mL |
10 mL |
10 mL |
|
Final % Pollutant |
0 % |
25 % |
40 % |
50 % |
We then measured the absorbance of each tube of pure, undiluted Ankistrodesmus culture at different wavelengths inside of the spectrophotometer. We had to blank the instrument before each reading and made sure to vortex the tubes in order to receive the most accurate results.We now have 12 test tubes total.
We measured the absorbance at the following wavelengths: 400 nm, 450 nm, 500 nm, 550 nm, 600 nm, 650 nm, and 700 nm. As a group we had to decide which wavelength the algae culture absorbed more strongly, we were able to determine that at 450 nm the algae culture was absorbed most strongly. We used that wavelength in the rest of our readings.
Now that everything is set up, we are ready to begin our experiment. We began by measuring out 2.922 grams of sodium chloride per 100 milliliters of Alga-grow using a scoopula and a scale to get the correct measurement We also measured out a 40 mL of Ankistrodesmus algae using a graduated cylinder and poured that into a separate beaker labeled “Algae.” We did this to ensure that there was enough to make all 12 tubes. We made our control tubes (both A and B) by putting in 5 mL of Ankistrodesmus culture into the test tubes using a pipette and then combines 5 mL of Alga-Gro into the same tubes. This gave us a 0% pollutant concentration since there was no salt solution in the tube. We then started to create our test tube 1 (both A and B). We added 5 mL of Ankistrodesmus culture to the test tubes using the pipet and added 2.5 mL of Alga-Gro also using the pipet and 2.5 mL of Salt solution using a pipette, which gave us a 10% pollutant concentration. For our test tube 2 (both A and B) we added 5 mL of Ankistrodesmus culture using a pipet, then 1 mL of Alga-Gro using the pipet, and then 4 mL of salt solution into the tube using the pipet, which gave us a 40% pollutant concentration. Test tube 3 (both A and B) we added 5 mL of Ankistrodesmus culture using the pipet and 0 mL of alga-gro, and 5 mL of the salt solution using the pipette, which gave us a 50% pollutant concentration since half of the tube is algae and the other half is the pollutant. This is all of our experimental test tubes, and it was time for us to create our “blank” tubes.
To start off our negative control blank, we added 10 mL of Alga-Gro using the pipet into an empty test tube labeled as “Neg. Control Blank.” For our tube 1 blank, we added 7.5 mL of Alga-Gro using the pipette into another empty tube with the label “Tube 1 Blank.” We then added 2.5 mL of the salt solution into the same test tube using the pipette. This gave us a 25% pollutant concentration. For our next tube, tube 2, we added 6 mL of Alga-Gro into an empty test tube that was labeled “Tube 2 Blank” and added 4 mL of salt solution into the same tube using the pipette. For our last blank tube, tube 3, we added 5 mL of Alga-Gro and 5 mL of salt solution using the pipette, into an empty test tube labeled “Tube 3 Blank.” This completed all tubes needed to perform the experiment.
We then moved to the spectrophotometer machine and continued to perform our experiment. We made sure that our spectrophotometer was set on 450 nm. Then, after vortexing every test tube, including the blank tubes, we would put in our blank test tube to blank out the spectrophotometer, waited until it zeroed out and then proceeded to take our readings. We had to be sure to blank the spectrophotometer each time we needed to move from “Controls A and B” to “Tubes 1 A and B” to “Tubes 2 A and B” to “Tubes 3 A and B.” in fear of getting a wrong reading. This was something that required a lot of attention and time. We recorded the optical density of each test tube and once we were finished we labled our test tubes with our names and placed them under a lamp. We then cleaned up all of our lab equipment and materials. We came back and recorded our optical densities every seven days over the course of 14 days for each test tube.
Results:
The table below shows the optical densities of each one of the test tubes over the course of 14 days. These results were then subtracted to get each specific tube’s net gain or loss. After figuring out every tube’s net gain or loss, we took tubes A and B from each control group and found the average of each group’s gain or loss of optical density.
|
|
Day 0 O. D. |
Day 7 O. D. |
Day 14 O. D. |
Net Gain/Loss O. D. |
Average Gain/Loss O. D. |
|
Control A |
0.281 |
0.703 |
0.122 |
-0.159 |
-0.122 |
|
Control B |
0.269 |
0.644 |
0.185 |
-0.084 |
|
|
Tube 1 A |
0.244 |
0.380 |
0.411 |
+0.167 |
+0.091 |
|
Tube 1 B |
0.259 |
0.598 |
0.273 |
+0.014 |
|
|
Tube 2 A |
0.200 |
0.300 |
0.290 |
+0.09 |
+0.355 |
|
Tube 2 B |
0.217 |
0.404 |
0.403 |
+0.62 |
|
|
Tube 3 A |
0.216 |
0.336 |
0.225 |
+0.009 |
+0.070 |
|
Tube 3 B |
0.226 |
0.309 |
0.356 |
+0.13 |
The line graph below shows the average optical densities of each group of tubes that were studied over the course of the 14 days. The blue line is the average of the Controls (both A and B) optical densities over the 14 day time period. The orange line is the average of the Tube 1s (both A and B) optical densities over the 14 day time period. The grey line is the average of the Tube 2s (both A and B) optical densities over the 14 day time period. The yellow line the average of the Tube 3s (both A and B) optical densities over the 14 day period.
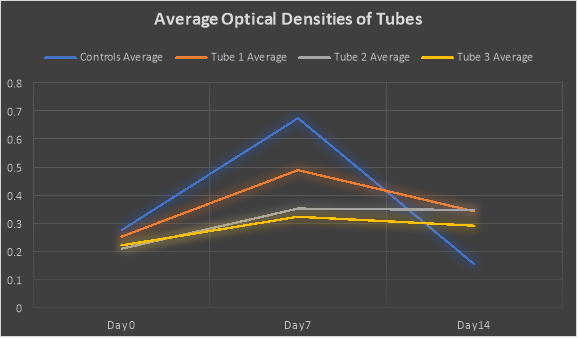
For Day 0, the average optical densities were as follows: Controls were 0.275, the Tube 1s were 0.252, the Tube 2s were 0.209, and the Tube 3s were 0.221.
For Day 7 the average optical densities were as follows: Controls were 0.674, the Tube 1s were 0.489, the Tube 2s were 0.352, and the Tube 3s were 0.323.
For Day 14 the average optical densities were as follows: Controls were 0.154, the Tube 1s were 0.342, the Tube 2s were 0.347, and the Tube 3s were 0.291.
The bar graph below shows the average net gains and losses of optical density of the test tube groups ((Controls – 0% salt solution (in blue), Tube 1 – 25% salt solution (in orange), Tube 2 – 40% salt solution (in grey), and Tube 3 – 50% salt solution (in yellow).)

Based on the bar graph above you can observe that when there is not any salt solution added (the Controls) the optical density dropped into the negatives meaning that little to no light was being absorbed. This shows that there was little to no algae growing in this solution. It can also be seen that when there is more than 50% pollutant (Tube 3s), there is also little to no algae growing in this solution. We can come to the conclusion that by adding too much salt solution to the Ankistrodesmus algae culture, the algae began to die. We can also state that by adding no salt solution to the algae it did not grow at a fast rate like in Tubes 1 and Tubes 2.
Discussion:
Based on our experimental results, the 40% salt solution pollutant percentage concentration ended up being the one to produce a significant amount more of the Ankistrodesmus algae culture, but by adding no Miracle-Gro (the 0% pollutant concentration) the algae did not grow close to the rate it did when the pollutant percentage concentration was at 20% and 50%.
This result can be tested by doing this same experiment again and seeing if our results end up being roughly around the same amount. As stated before, the amount of absorbance determines the presence of algae. If the absorbance is higher than before you can colcude that there is more algae being grown, where as if the absorbance has decreased drastically, you can observe that the algae is either dying off or is no longer present in the large amounts that it was when the experiment was originally began.
Based on the information that we have gathered, the algae dying off at 50% pollution concentration supports our hypothesis that salt solution will inhibit the growth of Ankistrodesmus algae. It also shows that salt solution can also help the algae grow in small amounts.
Referenced Cited:
- “Decade, Water for Life, 2015, UN-Water, United Nations, MDG, Water, Sanitation, Financing, Gender, IWRM, Human Right, Transboundary, Cities, Quality, Food Security.” United Nations, United Nations, www.un.org/waterforlifedecade/quality.shtml.
- “Wang, Ucilia. “The Great Salt Mess: Pollution Threatens US Fresh Water Resources.” The Guardian, Guardian News and Media, 21 Aug. 2014, www.theguardian.com/sustainable-business/2014/aug/21/geological-survey-salinity-pure-water-shortage-chemical-runoff-agribusiness-watershed.)”
Cite This Work
To export a reference to this article please select a referencing stye below:
Related Services
View all


DMCA / Removal Request
If you are the original writer of this essay and no longer wish to have your work published on UKEssays.com then please click the following link to email our support team:
Request essay removal