Protein Determination Lab Report
| ✅ Paper Type: Free Essay | ✅ Subject: Biology |
| ✅ Wordcount: 2242 words | ✅ Published: 12 Jun 2018 |
Introduction
Within protein biochemistry, analytical procedures and experiments have been designed to determine accurate measures of the protein concentration in a sample. A variety of protein assays are being and have been developed to be used in laboratories to examine a solution and to quantify protein from a biological specimen. For certain concentrations, protein assays such as the Bradford and the Lowry method will have advantages and disadvantages, for instance a higher cost but the results have a greater accuracy and are produced expeditiously (Becker, Caldwell and Zachgo, 2011). Protein assays are essential to determine if proteinuria is a result of glomerular or tubular manifestation, indicating serious health complications. The protein albumin is the most abundant in urine compared to that of other proteins, and therefore is the standard most common protein measured (Vogel, 2008).
For decades, protein quantification has been an important laboratory technique that extracts, purifies, characterises and analyses protein concentrations throughout human biology, from enzymatic activity to clinical testing of urine samples. In many parts of the world, such as Australasia in New Zealand, routine checks are available to measure albumin levels in the urine to aid in the diagnosis of renal disease (Martin, 2011). Diagnosing disease through protein quantification is a long-lasting technique, ancient experts would try to identify albumin in the urine through a technique known as the ‘foam-test’, which is similarly still carried out today to detect glomerular disease. For this reason, protein quantification is a crucial diagnostic tool in early detection of disease, classification of disease and assessment of prognosis (Pisitkun, Johnstone and Knepper, 2006).
Blood plasma is comprised of a combination of proteins to aid in various factors including the maintenance of blood plasma volume and/or a protein transporter. Of the blood plasma, albumin makes up 60% of plasma protein, and is the most copious protein to be measured in the plasma (Higgins, 2005). In healthy patients, the albumin concentration in the urine should be exceptionally low, between 20ug/ml and 30ug/ml are considered a normal level. However, any reading above 30ug/ml could be an indication that the person could have microalbuminuria or macro-albuminuria which increases the risk of a range of health conditions (Hasanato, 2016).
To determine abnormal concentrations of albumin in the urine requires an accurate screening process, this is an essential diagnostic tool for the early detection of progressive kidney disease and a cardiovascular risk marker. The initial assessment uses proteinuria uranalysis on patients showing symptoms of chronic kidney disease (CKD). For instance, a clear indication that a patient with diabetes mellitus could develop Diabetic nephropathy is through an increase in the albumin in the urine. Non-diabetic patients that develop a protein concentration in the micro-albuminuria region of above 30ug/ml are still at risk of CKD progression and higher CVD mortality risk. (Carter et al., 2006) Proteinuria can affect people with or without diabetes, male or female but can progressively worsen with age. (Fraser et al., 2017) Several sources, including the Heart Outcomes Prevention Evaluation study, found a correlation between abnormal albumin levels detected in a dipstick test and Cardiovascular diseases such as hypertension and strokes. A recent study found that from 48,000 participants, the presence of microalbuminuria was shown to increase stroke risk by up to 90% than that of normoalbuminuric individuals (Delles and Currie, 2013).
For the protein determination laboratory experiment, the aim of the albumin assay was to determine the absorbance value of the 5 patient urine samples with the high and normal controls. To achieve the aim, three objectives were implemented; the first step was to create an accurate curve of albumin which aided in the second and third objective; to determine the quantity of proteinuria in each sample, followed by a diagnosis of the patients from the urine samples.
Methodology
Using the Bradford Assay procedure, 8 standards are generated with the protein concentration from 0ul in standard 0, 25ul, 50ul, 75ul, 100ul, 250ul, 500ul and 1000ul in standard 7, Adding water to labelled microtubules with Bovine Serum Albumin (BSA) 1mg/ml (1ug/ul). Duplicates of 100ul of each solution are then added to test tubes with 5ml of Bradford regent and incubated at room temperature for 10 minutes before being recorded at 595nm in the spectrometer. These values are recorded into excel, a calibration graph is formed through calculating the average, producing the R2 value. The calibration graph calculates the M value in y=mx; this is used to determine the protein concentrations of each sample. After the duplicated samples have been left for 10 minutes containing 100ul of each patients’ sample and 5ml of Bradford regent, these samples are read at 595nm in the spectrometer giving the Y absorbance values through light absorbance. In excel, 6 anomalies were removed from each data set before being analysed, averaged and the standard deviation being calculated. Using the average and x=m/y equation, a clustered column bar chart was formed showing the quantification of albumin protein concentration showing the +/- standard deviation.
Results
The protein albumin in the urine is an essential marker for the diagnosis and prognosis of certain diseases. Urine tests, which contain high levels of albumin are usually the first steps in determining illness and disease. Certain symptoms that a patient shows can be a clear indication that albumin levels are high. Testing of these albumin levels can then significantly help determine illness. It is paramount for this reason to quantify albumin protein concentrations in samples to aid in the prevention of morbidity and mortality rates worldwide. In this study, five patient samples were tested for albumin against a high controlled and normal controlled sample to show the importance of albumin in urine. Upon the results, shown in figure 1 and 2 a diagnosis could be made for the individuals.

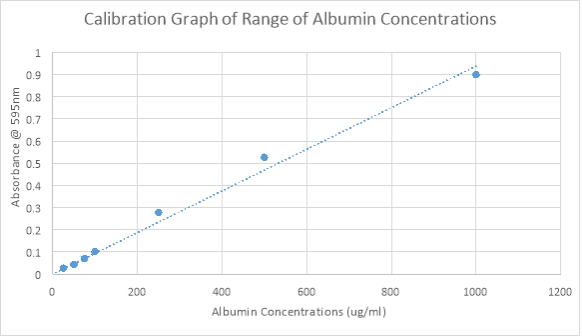
To critically analyse the calibration graph in figure 1, the R2 trend line label must have a value of >0.95 to indicate a good fit and a linear line for the data, the R2 label has a value of 0.99031 which follows this trend. It can be seen from the calibration graph has a linear relationship; as the concentration of albumin doubles, the absorbance @ 595nm also doubles.
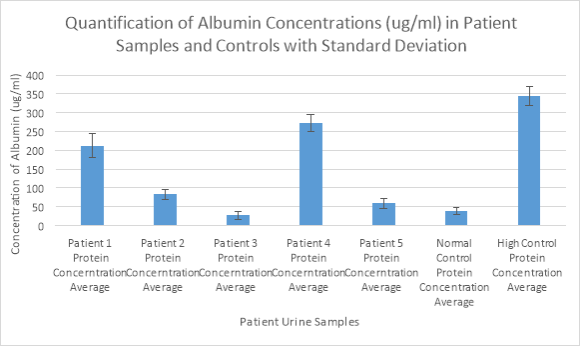

In figure 2, the normal controlled and high controlled sample give a clear indication of how healthy the albumin concentrations are that are found in each patient sample. Although the high controlled sample has an albumin concentration of over 300ug/ml representing macro-albuminuria, patient 1 and patient 4 have similar abnormal protein levels in the serum showing microalbuminuria. Furthermore, patient 2 and patient 5 are also classed as having microalbuminuria as the concentrations are over 30ug/ml, however the levels are not extreme, and are not an indication of chronic kidney disease. Patient 3 has a similar concentration to the normal controlled sample; the patient’s kidneys have virtually no protein and are classed as healthy.
Discussion
In a healthy urine sample, normal protein albumin concentrations are between 20ug/ml and 30ug/ml, this can be seen in Figure 2 with the Normal control having a value around 30 and for patient 3. However, protein levels from 30ug/ml to 300ug/ml are considered microalbuminuria; patient 1, 2, 4 and 5. The High Control Protein has a value in the 340 regions, this is known as macro albuminuria (Hasanato, 2016).
Patient 1 – 35-year-old female. Albumin protein concentration is approximately 210ug/ml, abnormal level of protein is extremely higher than the normal range and can indicate preeclampsia. Women who experience preeclampsia during their pregnancy are more likely to experience complication than those with normal levels of protein, headaches are a clear indicator that the lady is showing signs of preeclampsia (Hawkins et al., 2015). It is essential that her blood pressure is monitored to prevent hypertension and sent for various blood tests to observe her kidney and liver function (NHS 2).
Patient 2 – 50-year-old male. Albumin protein concentration is around 80ug/ml which is classed as microalbuminuria. Body mass index, waist circumference and high levels of protein in urine are linked with the formation of kidney stones (Garimella et al., 2015). The symptoms that patient 2 is experiencing suggest that he is suffering from a large kidney stone. Highly recommended that he is sent for blood and urine tests to check for infection (NHS 1).
Patient 3 – 40-year-old female. Albumin Protein concentration is roughly 25ug/ml which indicates very little protein in her urine, concentration classed as normal as similar value to the Normal Control protein.
Patient 4 – 23-year-old female. Albumin Protein concentration is in the region of 275ug/ml, classed as very high and could indicate albuminuria. Early diagnosis could prevent the patient from experiencing hypertension, type 2 diabetes and coronary heart disease (Yadav et al., 2016). The symptoms that the patient is experiencing could indicate a Urinary Tract Infection, there is a strong correlation in many studies that demonstrations how a UTI can impact the glomerular involvement increasing the levels of albumin in the urine (González Rodríguez et al., 2009).
Patient 5 – 70-year-old. Albumin protein concentration boarding 60ug/ml which isn’t significantly higher the normal range but still classed as micro-albuminuria. Patient showing signs of still recovering from influenza, immune system is weakened due to age and can take longer to recover. Renal function decline can occur with age and within the elderly generation, which could indicate the abnormal levels of albumin in his urine (Funk et al., 2016). Should be monitored regularly, a review of his medication that may cause a decline in his renal function and put on antibiotics if symptoms of flu continue.
References
Becker, J., Caldwell, G. and Zachgo, E. (2011). Biotechnology. 1st ed. San Diego: Academic Press, p.119.
Carter, J., Tomson, C., Stevens, P. and Lamb, E. (2006). Does urinary tract infection cause proteinuria or microalbuminuria? A systematic review. Nephrology Dialysis Transplantation, 21(11), pp.3031-3037. Available: https://academic.oup.com/ndt/article-lookup/doi/10.1093/ndt/gfl373. Last accessed: 12th March 2017.
Delles, C. and Currie, G. (2013). Proteinuria and its relation to cardiovascular disease. International Journal of Nephrology and Renovascular Disease, p.13. Available: https://www.ncbi.nlm.nih.gov/pubmed/?term=Delles%2C+C.+and+Currie%2C+G.+(2013). Last Accessed: 14th March 2017.
Fraser, S., Roderick, P., McIntyre, N., Harris, S., McIntyre, C., Fluck, R. and Taal, M. (2017). Assessment of Proteinuria in Patients with Chronic Kidney Disease Stage 3: Albuminuria and Non-Albumin Proteinuria. Available: http://journals.plos.org/plosone/article?id=10.1371/journal.pone.0098261. Last accessed: 12th March 2017.
Funk, I., Seibert, E., Markau, S. and Girndt, M. (2016). Clinical Course of Acute Kidney Injury in Elderly Individuals Above 80 Years. Kidney and Blood Pressure Research, 41(6), pp.947-955. Available: https://www.ncbi.nlm.nih.gov/pubmed/?term=Funk%2C+I.%2C+Seibert%2C+E.%2C+Markau%2C+S.+and+Girndt%2C+M.+(2016). Last accessed: 12th March 2017.
Garimella, P., Biggs, M., Katz, R., Ix, J., Bennett, M., Devarajan, P., Kestenbaum, B., Siscovick, D., Jensen, M., Shlipak, M., Chaves, P. and Sarnak, M. (2015). Urinary uromodulin, kidney function, and cardiovascular disease in elderly adults. Kidney International, 88(5), pp.1126-1134. Available: https://www.ncbi.nlm.nih.gov/pubmed/26154925. Last accessed: 15th March 2017.
González Rodríguez, J., Canalejo, D., Martín Govante, J., García de Guadiana, L., Rex, C., González Morales, M. and Cayuela, A. (2009). Proteinuria in urinary infection and acute originals pyelonephritis in paediatric patients: can it replace scintigraphic studies in diagnostic localisation? Nefrología, 29(2), pp.163-169. Available: https://www.ncbi.nlm.nih.gov/pubmed/?term=Gonz%C3%A1lez+Rodr%C3%ADguez%2C+J.%2C+Canalejo%2C+D.%2C+Mart%C3%ADn+Govante%2C+J.%2C+Garc%C3%ADa+de+Guadiana%2C+L.%2C+Rex%2C+C.%2C+Gonz%C3%A1lez+Morales%2C+M.+and+Cayuela%2C+A.+(2009). Last accessed: 13th March 2017.
Hasanato, R. (2016). Diagnostic efficacy of random albumin creatinine ratio for detection of micro and macro-albuminuria in type 2 diabetes mellitus. Saudi Medical Journal, 37(3), pp.268-273. Available: https://www.ncbi.nlm.nih.gov/pubmed/26905348. Last accessed: 15th March 2017.
Hawkins, M., Braun, B., Marcus, B., Stanek, E., Markenson, G. and Chasan-Taber, L. (2015). The impact of an exercise intervention on C – reactive protein during pregnancy: a randomized controlled trial. BMC Pregnancy and Childbirth, 15(1). Available: https://www.ncbi.nlm.nih.gov/pubmed/26104503. Last accessed: 12th March 2017.
Higgins, C. (2005). Understanding laboratory investigations. 1st ed. Malden, MA: Blackwell Science, p.159.
Martin, H. (2011). Laboratory Measurement of Urine Albumin and Urine Total Protein in Screening for Proteinuria in Chronic Kidney Disease. Clin Biochem Rev., 32(2), pp.97-102. Available: https://www.ncbi.nlm.nih.gov/pubmed/?term=Martin%2C+H.+(2011).+Laboratory+Measurement+of+Urine+Albumin+and+Urine+Total+Protein+in+Screening+for+Proteinuria+in+Chronic+Kidney+Disease. Last accessed: 13th March 2017.
NHS 1. (). Diagnosing Kidney Stones. Available: http://www.nhs.uk/Conditions/Kidney-stones/Pages/Diagnosis.aspx. Last accessed 12th March 2017.
NHS 2. Pre -eclampsia Treatment. Available: http://www.nhs.uk/Conditions/Pre-eclampsia/Pages/Treatment.aspx. Last accessed 15/03/2017.
Oda, E. (2014). Overweight and high-sensitivity C-reactive protein are weakly associated with kidney stone formation in Japanese men. International Journal of Urology, 21(10), pp.1005-1011. Available: https://www.ncbi.nlm.nih.gov/pubmed/?term=Oda%2C+E.+(2014).+Overweight+and+high-sensitivity+C-reactive+protein+are+weakly+associated+with+kidney+stone+formation+in+Japanese+men.+International+Journal+of+Urology%2C. Last accessed: 14th March 2017.
Pisitkun, T., Johnstone, R. and Knepper, M. (2006). Discovery of Urinary Biomarkers. Molecular & Cellular Proteomics, 5(10), pp.1760-1771. Available: https://www.ncbi.nlm.nih.gov/pubmed/?term=Pisitkun%2C+T.%2C+Johnstone%2C+R.+and+Knepper%2C+M.+(2006).+Discovery+of+Urinary+Biomarkers.+Molecular+%26+Cellular+Proteomics. Last accessed: 12th March 2017.
Yadav, D., Kang, D., Koh, S., Kim, J. and Ahn, S. (2016). Association between Urine Albumin-to-Creatinine Ratio within the Normal Range and Incident Hypertension in Men and Women. Yonsei Medical Journal, 57(6), p.1454. Available: https://www.ncbi.nlm.nih.gov/pubmed/27593874. Last accessed: 15th March 2017.
Vogel, H. (2008). Drug Discovery and Evaluation. 1st ed. Berlin, Heidelberg: Springer-Verlag Berlin Heidelberg, p.476.
Cite This Work
To export a reference to this article please select a referencing stye below:
Related Services
View all


DMCA / Removal Request
If you are the original writer of this essay and no longer wish to have your work published on UKEssays.com then please click the following link to email our support team:
Request essay removal