Effects of Light Intensity on Photosynthetic Rate of Spinach
| ✅ Paper Type: Free Essay | ✅ Subject: Biology |
| ✅ Wordcount: 1167 words | ✅ Published: 21 May 2018 |
Title
An investigation on the effects of varying light intensity on the photosynthetic rate in Spinacia oleracea (spinach) leaf slices.
Introduction
Like many molecular processes, the metabolic pathways of photosynthesis may be influenced by certain factors. These include, but are not limited to, light intensity, carbon dioxide concentration and the presence of photosynthetic inhibitors.
Light, in photon form, plays a pivotal role in the light-dependent reactions. It is necessary for the synthesis of ATP and NADPH molecules (Ogren, 1993), which are then used during the Calvin cycle. An increased intensity of light will yield an increased rate of photosynthesis until the point of saturation is attained.
Carbon dioxide which has been assimilated by plants is fixed during the Calvin cycle into organic compounds; glyceraldehyde 3-phosphate (G3P) and the regeneration of Ribulose-1,5-bisphosphate (RuBP) (Makino and Mae, 1999). In this experiment, sodium bicarbonate (NaHCO3) is added as a source of carbon dioxide.
The toxicity of certain chemicals, in particular herbicides, can act as photosynthetic inhibitors, interfering with CO2 fixation, starch synthesis, and photochemical reductions. Diuron, or DCMU, is a known inhibitor of photosynthesis. Binding to the protein complex plastoquinone, it disrupts the continuity of the electron transport chain and photosynthesis progression (Allen et al., 1983).
It is possible to determine the rate of photosynthesis by employing an oxygen electrode through which O2 evolution can be quantified. The electrode provides a polarographic measurement of the electrical flow from an anode to a cathode. The high sensitivity of the electrode enables the detection of oxygen concentrations as low as 0.01 millimolar (Kohler, 1998).
In this experiment, spinach, Spinacia oleracea, was employed as a model to denote photosynthetic plants.
Materials and Method
The procedure was performed in accordance to the Molecules, Genes and Cells Laboratory Manual, University of Adelaide (2014). Light intensities of 800, 370, 265, 120 and 40 µmol photons m-2 s-1 were used. Only one trial was conducted for each component. Diuron of concentration 40 µL was also employed.
Results
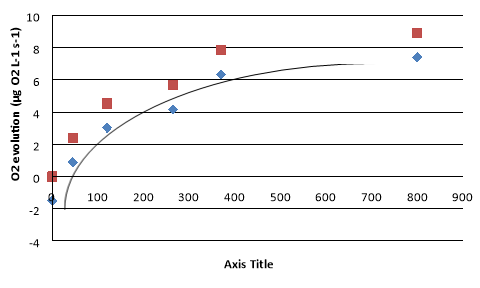
Figure 1 illustrates that as light intensity increases, photosynthetic rate also increases. At low light, the response is linear and at high light the response plateaus. In zero light, oxygen is being consumed, representing mitochondrial respiration. The light compensation point arises when oxygen evolution is 0 µg O2 L-1 s-1, indicating photosynthetic rate is equal to rate of respiration in mitochondria. Point of light saturation was reached at 800 µmoles photons m-2 s-1, such that photosynthetic rate does not increase beyond this light intensity. The curve transitions from a lineal trend at low light where light itself is a limiting factor, to a plateau at high light where light is no longer a limiting factor.
When NaHCO3 was added under full light, O2 production increased from 3.2 to 7.4 µg O2 L-1 s-1. Similarly, when Diuron inhibitor was added under full light, photosynthesis was reduced to zero.


Discussion
With minimal light, photosystems are not performing optimally as there are a large number of chlorophyll molecules that are not absorbing photons. As light is increased, more electrons are cycled and thus more water is split into oxygen. At low light intensity, photosynthesis is limited by light itself. Increase light and photosynthetic rate will also increase. When photosystems reach maximum capacity, additional light does not increase photosynthesis.
Between 45 and 120 µmoles photons.m-2.s-1 light intensity, rate of photosynthesis increases linearly. This relationship suggests that light is the limiting factor at low intensities. The linear trend will only continue with increasing light when NADPH and ATP molecules are used quickly and efficiently by the Calvin cycle.
At increasing light intensities, oxygen evolution begins to plateau such that light is no longer a limiting factor. The intensity of light at which this occurs is known as the light saturation point. The capacity for the plant to absorb light is no longer possible; additional light does not increase oxygen output as occupied chlorophyll molecules cannot absorb additional photons (Thornley, 2004).
Similar to results collected by Chalker (1981) and Thornley (2004), the initial photosynthetic rate is directly proportional to light intensity. With increasing intensity the rate transitions, and approaches a horizontal (light-saturated) asymptote which denotes maximum photosynthetic capacity, Pmax. When light intensity exceeds this point of saturation, the rate of photosynthesis no longer increases.
When oxygen evolution equals 0 µg O2 L-1 s-1, the light compensation point is reached. At this point mitochondrial respiration rate is equal to photosynthetic rate. Light intensity above this will result in photosynthetic rate to increase steadily. Below this light intensity, respiration rate will exceed that of photosynthesis and thus result in oxygen consumption (negative rate value).
In reference to Figure 1, two trend lines have been established. Rate of O2 evolution, indicated in blue, represents oxygen produced by the entire leaf. Indicated in red, the true rate of photosynthesis represents oxygen produced by the chloroplasts alone. To determine true photosynthetic rate, the rate of oxygen evolution is added to the rate of dark respiration. For this trend line, in zero light conditions there is no photosynthesis and thus no oxygen production.
Upon adding NaHCO3, photosynthetic rate increased from 3.2 to 7.4 µg O2 L-1 s-1. This increase suggests that at maximum light, photosynthesis was limited by carbon dioxide concentration. As such, CO2 substrate is required for optimal photosynthetic rate. A CO2 deficiency will prevent photosynthesis from occurring efficiently. An excess CO2 concentration will indirectly produce more oxygen by increasing carboxylation activity of RuBisco and recycling ADP and NADP+ for the light reactions. (Makino and Mae, 1999).
The addition of Diuron, or DCMU, resulted in photosynthesis been impeded. DCMU is known to inhibit the light-dependent reactions. The chemical has high specificity; its structure is complementary in shape to the plastoquinone binding site on photosystem II. Once DCMU binds, it inhibits the flow of electrons to the plastoquinone molecule, preventing NADP+ reduction into NADPH (Allen et al., 1983). Effectively, this disrupts the continuity of the electron transport system, reducing rate of photosynthesis.
At zero light, a negative oxygen production rate of -1.506 µg O2 L-1 s-1 was observed. With the elimination of light, photosynthesis cannot occur. The spinach slices are now consuming more O2 than they are producing. At this point, mitochondrial respiration rate is faster than photosynthetic rate.

References
Allen M, Turnburke A, Lagace A, Steinback K., (1983). Effects of Photosystem II Herbicides on the Photosynthetic Membranes of the Cyanobacterium Aphanocapsa 6308. Department of Biological Sciences, Wellesley College, Massachusetts. Plant Physiol. 71: 388-392
Chalker B., (1981). Simulating Light-Saturation Curves for Photosynthesis and Calcification by Reef-Building Corals. Department of Zoology-Entomology, Auburn University; Alabama, USA. Marine Biology 63: 135-141
Kohler J., (1998). Measurement of photosynthetic oxygen production. Institute of Freshwater Ecology and Inland Fisheries Berlin, Berlin. Rostock. Meeresbiol. Beitr 6: 17-21
Makino A, Mae T.. (1999). Photosynthesis and Plant Growth at Elevated Levels of CO2. Department of Applied Plant Science, Graduate School of Agricultural Sciences, Tohoku Uni, Japan. Plant Cell Physiol. 40(10): 999-1006
Ogren E., (1993). Convexity of the Photosynthetic Light-Response Curve in Relation to intensity and Direction of Light during Growth. Department of Plant Physiology, University of Umea, Sweden. Plant Physiol. 101: 1013-1019
Thornley J., (2004). Acclimation of Photosynthesis to Light and Canopy Nitrogen Distribution: an Interpretation. Centre for Ecology & Hydrology, Bush Estate, UK. Annals of Botany 93: 473-475
Cite This Work
To export a reference to this article please select a referencing stye below:
Related Services
View all


DMCA / Removal Request
If you are the original writer of this essay and no longer wish to have your work published on UKEssays.com then please click the following link to email our support team:
Request essay removal