Effect of Sugar Concentration on Respiration in Yeast
| ✅ Paper Type: Free Essay | ✅ Subject: Biology |
| ✅ Wordcount: 3130 words | ✅ Published: 23 Sep 2019 |
APPLIED SCIENCE-Biology
RATE OF RESPIRATION
Respiration is the set of which processes and metabolic reactions take place in cells of organisms; these metabolic reactions and processes can also be the core of producing adenosine triphosphate (ATP) rather than breaking it down.
The simpler word equation can be written as:
Glucose + Oxygen Carbon Dioxide + water + ATP
The balanced equation for cellular respiration can be written as:
C6H12O6 + 6O2 6CO2 + 6H2O + ATP
This ATP synthesised during respiration can be used in a plethora of ways within organisms such as; growth and repair in cells, nerve impulses, active transport of molecules or ions and even muscle contraction.
The two types of respiration are aerobicandanaerobic.
Aerobic respiration is the process of which 36 ATP is produced due to multistep processes (Glycolysis, Citric Acid Cycle and the Electron Transfer Chain).This type of respiration is key as it takes place in the presence of Oxygen, produces large amounts of useful energy but Carbon dioxide and water are produced as waste products. A prime example of aerobic respiration is a long distance race, this is because a large amount of energy will be produced during key stages of a race rather than one quick burst, which would leave the athlete tired. The long distance race in summary is a cardio exercise so the heart must maintain a steady rate of roughly 60%to 80% of it maximum to sustain oxygen for shared muscle power. Glucose + Oxygen Carbon Dioxide + water + ATP
Anaerobicrespiration is the process by which only 2 ATP is produced due to the process of only glycolysis due to the absence of Oxygen. It also is the process of which glucose is broken down without oxygen, this results in the production of lactic acid rather than Carbon Dioxide and water. A Prime example is an athlete completing a short distance sprint, this means they’ll needed to contract and release muscles really quickly, as a result, due to the lack of oxygen, anaerobic respiration takes place. In most cases the heart rate would increase to a significantly high number but only for a short period of time. Glucose + Enzymes Carbon Dioxide +Ethanol
|
Aerobic |
Anaerobic |
|
|
As you may have noticed in the anaerobic word equation, ethanol is produced. This can also take place in microorganisms such as yeast cells. This can also be referred to as fermentation.
Ways of measuring the rate of respiration
A respiratory meter can be used to measure the rate of respiration of an organism by keeping track of its exchange of Carbon dioxide and Oxygen. It also considers factors such as age, and the effect of light.
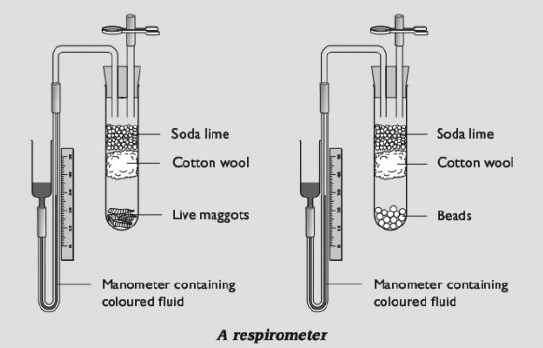 Figure 1 is an example of the use of a respiratory meter to measure the rate of respiration. In summary, as the organism’s intake oxygen from the air available, they give out Carbon Dioxide, this results in the manometer fluid rising towards the organisms as the pressure and volume is decreased. The manometer with no organisms would be expected to not move but it could due to temperature changes. By measuring the distance moved by the liquid in the manometer in a period of time, it can give you the rate of respiration of an organism, repeating this multiple times can result in a more precise and accurate verdict.
An investigation of the effect of sugar concentration on respiration in yeast.
Introduction
Yeast is a single-celled fungus. It can respire aerobically and anaerobically. During aerobic respiration, CO2is produced. In bread-making, the yeast starts off respiring aerobically, producing water and also carbon dioxide to make the dough rise. When the air runs out, the yeast begins to respire anaerobically producing ethanol and continuing to produce CO2.
My group carried out the experiment with the given sugar concentrations three times in total.
Sugar Carbon Dioxide + Alcohol + Energy to make ATP
Materials Needed
• Glucose to dissolve to the correct concentrations of solutions (0, 10, 20, 30, 40, 50, 60, 70, 80, 90 and 100/ litre)
• Dry yeast (7g per repetition).
• Measuring Cylinder.
• Conical flask 100ml.
• Gas syringes to measure CO2 production.
• Marker pen.
• Timer.
Safety precautions.
Contains small parts. Do not allow children under the age of seven to have access to any kit components.
Never taste or ingest any materials provided.
Do not eat, drink, and apply make-up or contact lenses while performing experiments.
Wash your hands before and after performing experiments.
Goggles and gloves should be worn.
Variables
- Dependent variable: Total vol of gas produced
- Independent variable: Glucose concentration
- Fixed (or control) variables: Mass of Yeast
Hypothesis
As the concentration of glucose increases within a conical flask, the volume of gas produced will increase gradually.
Method
During this experiment we worked collectively, each individual repeated a maximum of two glucose concentrations 3 times and shared the results with the class – others relied heavily on our results Method.
1. Dissolve the correct amount of glucose into 100ml of water. Label your conical flask your glucose concentration (= ……..g/l).
2. Set up your equipment as shown below in the diagram but do not connect up the rubber bung.

3. Start your timer as you add the 7g of dried yeast directly to the sugar solution in the conical flask (yeast 7%) after 3 minutes seal with the bung and continue timing for 10 minutes. Remember to check the temp of the water bath ~35oC.
4. Measure the gas produced in 10 minutes recording the volume every minute. If the syringe fills quickly, carefully remove the bung push the syringe back and replace the bung. Remembering the volume produced previously.
5. Record the total volume of gas produced in your table.
6. Repeat steps 2-5 for the 2nd and 3rd repeats
7. Collect data from the other class members to complete the table of results.
Individual results
|
Sugar concentration ……….. (g/l) |
Vol of gas produced (cm3) each minute |
Total vol of gas produced (cm3) |
|||||||||||
|
0 |
1 |
2 |
3 |
4 |
5 |
6 |
7 |
8 |
9 |
10 |
|||
|
rep 1 |
0 |
0 |
0 |
0 |
0 |
0 |
0 |
0 |
0 |
0 |
0 |
0 |
0 |
|
rep 2 |
0 |
2 |
2 |
2 |
2 |
2 |
2 |
2 |
2 |
2 |
2 |
2 |
0 |
|
rep 3 |
0 |
3 |
3 |
3 |
3 |
3 |
3 |
3 |
3 |
3 |
3 |
3 |
0 |
|
Average vol of gas produced |
0 |
||||||||||||
|
Sugar concentration ……….. (g/l) |
Vol of gas produced (cm3) each minute |
Total vol of gas produced (cm3) |
|||||||||||
|
0 |
1 |
2 |
3 |
4 |
5 |
6 |
7 |
8 |
9 |
10 |
|||
|
rep 1 |
50 |
1 |
2 |
2 |
10 |
19 |
19 |
32 |
35 |
43 |
48 |
55 |
54.00 |
|
rep 2 |
50 |
4 |
9 |
14 |
22 |
30 |
36 |
54 |
69 |
76 |
89 |
98 |
94.00 |
|
rep 3 |
50 |
2 |
5 |
9 |
14 |
14 |
24 |
30 |
36 |
47 |
55 |
64 |
62.00 |
|
Average vol of gas produced |
70.00 |
||||||||||||
 Class pool Results
Conclusion & Evaluation
In conclusion, the data provided by this experiment proves the hypothesis correct and conveys that as the concentration of glucose increases within a conical flask, the volume of gas produced will increase gradually. The total volume of gas produced indicates that there were some flaws during the experiment as if a graph was produced, the data points wouldn’t be mainly situated around the line of best fit but would still display a positive correlation. However, based on the results provided, it is clear that the data provided does not support the hypothesis to a great extent, this is because the initial assumption would be that the volume of gas produced in cm3 would be directly proportional to the glucose concentration. It is very clear that the outcomes weren’t expected.
The graph provided in the following text conveys that yeast respires more in higher concentrations of glucose, thus producing a higher volume of gas produced. In addition, the graph reveals that the optimum glucose concentration that yeast respired effectively in is 60g/l. This is because the yeast organisms were provided with not too little but not too much oxygen. It  is clear that adding too much glucose can have detrimental effects on the respiration of a yeast organism as from a concentration of 60g/l to 100g/l of glucose, the mean volume of gas produced decreases by 36.67cm3. This is because the excess sugars have inhabited the yeast, resulting in osmosis reactions of the sugar becoming so great that the yeast becomes unable to get a sufficient amount of water for growth and ends up drying out.
Before the peak at a concentration of 60g/l, from 0g/l to 10g/l, there is a rapid increase with a steep gradient, the rapid increase shows that the yeast are beginning to respire anaerobically as they are using the quick burst of energy, the steep gradient from a concentration of 50g/l to 60g/l further reinforces the peak rate of respiration as a steeper line indicates a faster rate of reaction. As you may have noticed, the results have immense variations within various concentrations, this could be due to a variety of other factors, the first being temperature, different temperatures at different concentrations can alter the results drastically as scientific research shows that temperature correlates with the rate of respiration within a yeast organism. Moderately higher temperatures give a greater rate of respiration.
The second factor that could have altered the results is the fact that within the group, due to a limited amount, different individuals used yeast of different ages, one batch being dated from a ‘couple of years back’, to a fairly new batch; this could have altered the results of individuals and produced anomalous results as the old yeast dating from a ‘couple years back’ could have been contaminated with water or other liquids, creating a void in our results. Furthermore, while doing the experiment, some individuals, including me, came to conclude that the yeast had to be stirred in order for it to respire to a measurable amount, this had a huge impact as when students began to stir their flasks, they noticed huge differences in the volume of gas produced in cm3(an increase).
Other factors include:
- Type of respirator meter holder
- How clean the conical flasks were
- How accurate the stopwatch keepers were
Despite the ambiguity of our results, we as a class were able to conclude that the optimal value of respiration within a yeast cell was efficient at glucose concentrations of 60g/l.
As an effort to create an experiment with better results that support the hypothesis to a great extent, we could perform alternative experiments or even standardise certain variables. For example, we could still use the variable of sugar concentration, however we could standardize the temperature, condition of yeast cells and the way the conical flask is held.
Despite the results not being strong enough, if we were able to alter the experiment and find valid support for our hypothesis, we could infer that since yeast are hungry for carbohydrates, similar to glucose, then by increasing the respiration rate of yeast yet still controlling variables such as temperature and concentration, we could be closer to replacing fossil fuels with biofuels and reduce the rate of climate change.
In summary, as the methods of increasing faster rates of respiration increase, the closer we are to conduct fermentation to produce alcohol, more rapidly and efficiently by growing more plants and grain to obtain more glucose for yeast to metabolise.
Blood pressure
 When blood pressure is measured, it expressed as “the top number” and “the bottom number”, the top number in fact is the systolic number and the bottom number is the diastolic. The systolic refers to the pressure in arteries during the contraction of your heart muscle (systolic pressure) and the diastolic refers to the blood pressure between heart beats (Diastolic pressure). Significantly large numbers can indicate that your heart is working too hard to pump blood to the rest of your body. Blood pressure readings are expressed in millimetres of mercury e.g. 120/80mm Hg
Keeping a stable blood pressure is important as a high blood pressure can lead to a severe stroke as it can weaken you brains vessels causing them to leak or weaken, it can cause blood clots to form in major arteries that could potentially cause a heart attack and in some cases, dementia. Low blood pressure can also have a great negative impact as the inadequate flow of blood to certain areas can also lead to strokes, heart attacks and kidney failure. High blood pressure is referred to as hypertensive, whereas low blood pressure is referred to as hypotension. There are a plethora of preventive measures that can be taken to prevent a hypertensive or a hypotensive crisis, some include:
- Reducing/Managing Sodium intake.
- Regular Exercise.
- Managing Stress.
- Reducing alcohol intake.
- Maintaining.
- Reduce caffeine intake.
Basal Metabolic Rate
 When you’re at rest, not digesting any food and at a stable temperature, the basal metabolic rate is the amount of energy used to maintain life. It is the measurement of an organism’s expenditure at rest. 67% of energy consumption in everyday life by a human is due to organ function, 21% is energy needed for physical activity and 12% is broken down into digestion of food(thermogenesis). Mammals are endotherms, this means that we regulate our temperature based on our environment in order to keep it at a constant (37.5) for our body to function at an optimum. This regulation of energy takes energy. A key example is the warming of an individual, a receptor will sense a decrease in temperature, this sends impulses to the thermoregulatory centre in order to cause a reaction such as shivering. BMR can be calculated by using the formula:
BMR = 66.5 + ( 13.75 × weight in kg ) + ( 5.003 × height in cm ) – ( 6.755 × age in years )
 A method used to calculate energy expenditure in the industry is Direct Calorimetry, this is the continuous measurement of heat output by an individual. This method requires the isolation of an individual in a specially designed room for 24 hours. Heat output is monitored during various activities such as eating and sleeping to measure how much energy these activities use. In industry, direct calorimetry is a power full tool in metabolic research studies, allowing research in many fields, from fundamental research to Diabetes, type 2 and how temperature influences human metabolism. Researchers need reliable, validated results and a system that allows them to easily conduct various studies. It is complete and accurate, tailored to research needs such as how a sportsman uses energy or at what points in a race.
 Another method that can be used to measure the energy expenditure of an individual is Indirect Calorimetry, this estimates the heat production of an individual by measuring the amount of Oxygen used and the amount of Carbon Dioxide produced (Gaseous Exchange). Indirect Calorimetry Assumes that the metabolic rate of an individual can be estimated by measuring the transformation of chemical energy into heat. In industry, as shown above, this method can be used to determine energy requirements and response to nutrition over time, this is benefitial for an athlete as knowing how to distribute energy over a period of time can help them peform at their optimum.In addition, calculation of energy expenditure allows determination of nutritional requirements meaning that they can prepare for an even at maximum health, not only physically but mentally.
The breath-by-breath method is used to measure indirect calorimetry in most cases. Gas composition and respiratory flow are measured continuously at a high frequency. However, there are some disadvantages to this method
- Difficult to use with children
- Over or underfeeding may occur based on results
- No strong evidence of clinical benefit
- Can create a divide within sport as some associations can’t afford the equipment.
|
Indirect |
Direct |
|
Estimation of heat produced by mean of the respiratory differences of Oxygen and Carbon Dioxide in the inspired and expired air. |
Measurement of heat actually produced by an organism confined in a sealed chamber or calorimeter. |
|
Measured by O2 and CO2 production. |
Measured by heat output. |
|
Requires 12 hours fasting in some cases but only takes 10 minutes |
24 hours |
|
Occurs in a portable hood and stationary equipment in hospitals |
Occurs in an isolated chamber |
Most people have different BMRs, this variation is due to age, mass and weight. Men have a higher BMR than females on average as men tend to have more muscle. Older adults usually have a lower BMR than younger people since their muscle mass tends to decrease and wear away with age.
Heart Rate
 Heart rate is the number of times your heart beats per minute (BPM). It can be used as a fitness indicator as a low resting heart rate suggests your heart is stronger with aerobic respiration. In addition, it can be measured in beats per minute. Adults average a heart rate of 60 to 100BPM whereas athletes average a maximum of 48bmp. Exercise can affect your heart rate as the demand for oxygen will increase as you exercise, as a result, more blood will pump, meaning more frequent heat beats. By doing so more energy is produced in required areas. In industry, the idea of heart rate can be used for a plethora of reasons. In sport using a heart rate monitor is a good way to determine the effectiveness of an athlete’s workout because as the individual strengthens their body through exercise, they also strengthen their heart. Measuring the rate of their heart during exercise can help determine when an athlete is pushing their body too hard or need if there is a need to push it harder to achieve the level of fitness you are seeking. Heart rate can be measured using a heart rate monitor, modern and accurate HRM devices use light to track your blood by illuminating your capillaries with an LED, a sensor adjacent to the light measures the frequency at which your blood pumps past. However heart rate monitors are reliable to certain degrees as variables such as sweat patches on the area being measures, movement during measurement and uneven or thickness of skin can give variation within the results.
Peak flow
Peak flow is a simple measurement of how quickly you can blow air out of your lungs. It’s often used to help diagnose and monitor asthma. A peak flow test involves blowing as hard as you can into a small device called a peak flow meter. By blowing into the device for a period of time you can measure how much or if your airways have narrowed. The peak expiratory flow (PEF) is  given in litres of air breathed out per minute (l/min). What’s considered a normal score depends on your age, height and gender. In industry, peak flow is used commonly in private and government hospitals to measure how fast an individual is able to breathe out, the peak flow score can indicate whether an individual’s airways are narrowed. Also, it is used in the development of asthma drugs during human trials, this is beneficial as it ensures that the drug being developed shows clear signs of improving the user’s lungs.
Sources
- http://www.softschools.com/difference/aerobic_respiration_vs_anaerobic_respiration/438/
- http://biology4alevel.blogspot.com/2015/08/95-using-respirometers.html
- https://www.healthline.com/health/high-blood-pressure-hypertension/blood-pressure-reading-explained#prevention
- https://study.com/academy/lesson/what-is-basal-metabolic-rate-calculation-lesson-quiz.html
- https://www.nhs.uk/conditions/peak-flow-test/
- GCSE COLLINS REVISION BOOK
Cite This Work
To export a reference to this article please select a referencing stye below:
Related Services
View all


DMCA / Removal Request
If you are the original writer of this essay and no longer wish to have your work published on UKEssays.com then please click the following link to email our support team:
Request essay removal