Decolorizing Agar Cubes with NaOH | Experiment
| ✅ Paper Type: Free Essay | ✅ Subject: Biology |
| ✅ Wordcount: 1298 words | ✅ Published: 30 May 2018 |
- Hamsika Iyer
Research question:
How will changing the surface area to volume ratio affect the time taken to completely decolorize the agar cubes with NaOH, thereby affecting the rate of diffusion?
Introduction:
The simplest way in which a molecule could move in and out of a cell is by diffusion. No energy is required, and movement occurs by way of a simple concentration gradient. For example, as carbon dioxide concentration builds up in cells because of respiratory activity, it begins to diffuse through the plasma membrane to an area where the concentration is lower. Diffusion occurs where the membrane is fully permeable to the substance or where protein channels in the membrane are large enough for it to pass through.
People also often wonder how the size of the cell is so small that build up the body of a human. But its
Well understood by many that a large surface area is more considerable with many small cells. They have many functions to carry out which leads to immense release of heat was waste produce. Also, many chemical reactions also happen within the cell and thereby its size does affect the rate of the reactions. It is also seen that most cells are small due to surface area to volume ratio, which limits the size and volume of the cell. Thereby it leads to the hypothesis that the smaller the cell, the faster will be its diffusion or vice-versa.
Hypothesis:
As the smallest agar cube has the largest surface to volume ratio, the rate of diffusion will be more.
Variables:
Independent and Dependent Variables
|
S.NO |
Independent Variable |
Dependent Variable |
|
1) |
Surface area to Volume Ratio. |
The rate of diffusion. |
|
2) |
Ì„ |
Time |
Table 1: Showing the Independent and Dependent Variables
Controlled Variables
|
S.NO |
Controlled Variable |
How to control |
Effect is not controlled |
|
1. |
Size of the cubes. |
The selected size of the cubes will be kept constant by cutting the cubes with a sharp knife. |
The depth of penetration will be more or less. |
|
2. |
Time |
Time given to the cubes in the NaOH solution will be kept constant for 2 minutes, with the help of a stopwatch. |
If the time is not maintained, it will affect the results. |
|
3. |
Temperature |
The temperature will be kept constant by keeping the air conditioner switched on throughout the process. |
If temperature is not controlled, it will affect the results. |
Table 2: Showing the controlled variables, methods to control and the possible effects if not controlled.
Apparatus:
- Ruler (30 cm)
- 5 Petri dishes
- NaOH solution (200 ml)
- Phenolphthalein dye (10 ml)
- Agar (20 gm)
- C1- 1 cm
- C2- 1.5 cm
- C3- 2 cm
- C4- 2.5 cm
- C5- 3 cm
- 5 large beakers (250 ml)
- Knife(s)
- Stopwatches – 5 Units
- Blotting paper
- Measuring cylinder (100 ml)
Procedure:
- A large agar block with phenolphthalein dye was prepared 12 hours before, till it turned into jelly.
- After it turned into jelly, it was removed and cut into cubes of 5 different sizes (1cm, 1.5cm, 2cm, 2.5cm, and 3cm), 5 cubes of each size.
- Three beakers with labels of sizes of agar cubes were taken 5 agar cubes of each size were immersed in the respective beakers.
- In each beaker, 30 ml of NAOH (Sodium Hydroxide) solution was added and the cubes were made to soak in the solution.
- Stop watch was used to keep a track of the time taken for it to completely turn colorless.
- As the NaOH solution penetrates inside the cube, the Phenolphthalein in the agar cubes will release and the agar cube will turn colorless.
- The time for the agar cubes to completely turn colorless was noted.
- After the cubes completely turned colorless, they were placed on a blotting paper and were left to remove excess solution.
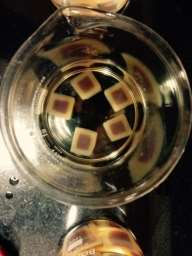


Images showing different sized agar cubes in NaOH solution turning colorless.
Data Collection and Processing:
The following measurements were taken into consideration:
|
CUBE SIZE (±0.5 CM) |
DEPTH OF PINK COLOUR PENETRATION (±0.05 MM) |
|
SIZE- (1 CM) |
1 mm |
|
2 mm |
|
|
2 mm |
|
|
1 mm |
|
|
0.5 mm |
|
|
SIZE- (1.5 CM) |
2 mm |
|
2.5 mm |
|
|
2 mm |
|
|
2.5 mm |
|
|
1.5 mm |
|
|
SIZE- (2 CM) |
4 mm |
|
2.5 mm |
|
|
2 mm |
|
|
3 mm |
|
|
3.4 mm |
|
|
SIZE- (2.5 CM) |
4.5 mm |
|
4 mm |
|
|
3.5 mm |
|
|
4.5 mm |
|
|
3 mm |
|
|
SIZE- (3 CM) |
5 mm |
|
4.5 mm |
|
|
4.5 mm |
|
|
3.5 mm |
|
|
4 mm |
Table 3: Showing the measurements of the depth to which the pink color penetrated in the agar cubes.
|
CUBE SIZE (±0.5 CM) |
TIME TAKEN TO COMPLETELY TURN COLOURLESS (±0.3 sec) |
|
SIZE- (1 CM) |
1080 s |
|
SIZE- (1.5 CM) |
1680 s |
|
SIZE- (2 CM) |
2776 s |
|
SIZE- (2.5 CM) |
3601 s |
|
SIZE- (3 CM) |
4008 s |
Table 4: Showing the time taken by agar cubes of each size to turn completely colourless.
Calculations:
Average depth to which the color has penetrated
The calculations are as follows –
- The average of Size-2.5 cm is
2mm+2mm+2.5mm+2.5mm+2mm/5 = 2.2
- The average of Size 3 cm is
5mm+4.5mm+4.5mm+3.5mm+4/5 = 4.3
- The average of Size 2 cm is
4mm+2.5mm+2mm+3mm+3.4mm/5 = 2.92
- The average of Trial 1.5cm is
4.5mm+4mm+3.5mm+4.5 mm+3mm/5 = 3.9
- The average of Trial 1 cm is
1mm+2mm+2mm+1mm+0.5mm/5 = 1.3
Percentage of diffusion
2.92/20mm* 100 = 14.6%
2.2/15mm*100 = 14.4%
1.67/10mm*100 = 16.7%
3.9/25mm*100 = 15.6%
4.3/30mm*100 = 14.3%
DATA TABLE:
|
Trial(s) (±0.5 mm) |
Total cube volume (cm3) [side]³ |
Surface area of cube (cm2) [6×side²] |
Surface area to volume ratio |
Percentage of diffusion |
|
1cm |
1cm×2cm×2cm×1×0.5= 2 cm3 |
6×1cm×1cm= 6cm² |
6/4= 1.5 |
16.7% |
|
1.5cm |
4.5cm×4cm×3.5cm×4.5cm×3cm=850.5 cm3 |
6×2.5cm×2.5cm = 37.5cm² |
37.5/25=1.5 |
15.6% |
|
2cm |
4cm×2.5cm×2cm×3×3.4=204 cm3 |
6×2 cm×2cm= 24cm² |
24/20= 1.2 |
14.6% |
|
2.5 cm |
2cm×2.5cm×2cm×2.5×2= 50 cm3 |
6×1.5cm×1.5cm=13.5cm² |
13.5/10= 1.35 |
14.4% |
|
3 cm |
5cm×4.5cm×4.5cm×3.5cm×4cm= 1417.5cm3 |
6×3cm×3cm = 54 cm² |
54/30= 1.8 |
14.3% |
Table 5: Showing the calculations of the percentage of diffusion within the agar cubes of different sizes.
Graph:

Graph 1: Showing the percentage of NaOH release from the Agar cubes.
Conclusion:
This experiment was mainly intended to check the rate of diffusion with regards to surface area and volume ratio inside the cell. From the results calculated in Table 5 and the result-based Graph 1 drawn, we can conclude that the hypothesis is supported and that the cell with the smallest surface area to volume ratio will have the highest rate of diffusion. Results in Table 5, show that the agar blocks of 1 cm have the highest percentage of diffusion that is 16.7% and the agar blocks with 3 cm have lowest rate of diffusion that is 14.3%.
Within the cell, the surface area to volume ratio is high which results in allowing more solution to flow in and out of the cell. With the increase in the surface area and volume of the agar cubes, there will be a decrease in the surface area to volume ratio.
If we apply this concept in real life one key evidence of the surface area to volume ratio is the unicellular and multicellular animals. Unicellular cells have to carry out different functions like taking in food, water and let out several chemicals and gases. As within the unicellular organisms, all the cell organelles are near the cell membrane, so with the growth of the cell, the organelles will increase in size, causing difficulty in every organelle to work together. So with high surface area to volume ration in unicellular cells, there will be less surface area to volume ratio.
The hypothesis according to the experiment conducted has been supported. According to the surface area and volume ratio and the graphical representation, the rate of diffusion in the smaller cube is more as the release of NAOH is more in the smaller agar cube than that in the larger agar cube. This is evident in the data table and the graph above where the results ranges between 14-16% of diffusion in the agar cubes with respect to the surface- area volume ratio.
Evaluation:
- There could be an error in measuring the depth at which the pink color penetrates by ±0.5mm
- Phenolphthalein concentration in each cube could differ.
- There could be uncertainty in the dimensions of the cube by ±0.5mm
Bibliography:
* Osmosis Transport Mechanisms, and 43. Diffusion, Osmosis, Transport Mechanisms 43(n.d.): n. pag. Web.
Viau, Elizabeth A. “The Sizes of Living Things.”World Builders 1– Chapter 9 The Size of Organisms E Viau CSULA. N.p., n.d. Web. 23 Mar. 2015.
Cite This Work
To export a reference to this article please select a referencing stye below:
Related Services
View all


DMCA / Removal Request
If you are the original writer of this essay and no longer wish to have your work published on UKEssays.com then please click the following link to email our support team:
Request essay removal