Break-even analysis guide
Info: 3352 words (13 pages) Study Guides
Published: 15 Apr 2026
Whether it’s a break-even analysis or any other business assignment, our expert writers can help you create work that stands out. Visit our business assignment help page for more information.
In business, break-even analysis is a key financial tool. It determines the point at which total revenue equals total costs, resulting in neither profit nor loss (EBSCO, 2021). This point, known as the break-even point, indicates the level of sales needed to cover all expenses. Break-even analysis helps managers and entrepreneurs understand the viability of a business or product by clarifying how much must be sold to avoid losses (EBSCO, 2021). It is widely applied in business planning and decision-making. This guide provides a comprehensive overview of the concept, including its formula, advantages, limitations, and practical applications.
What is break-even analysis?
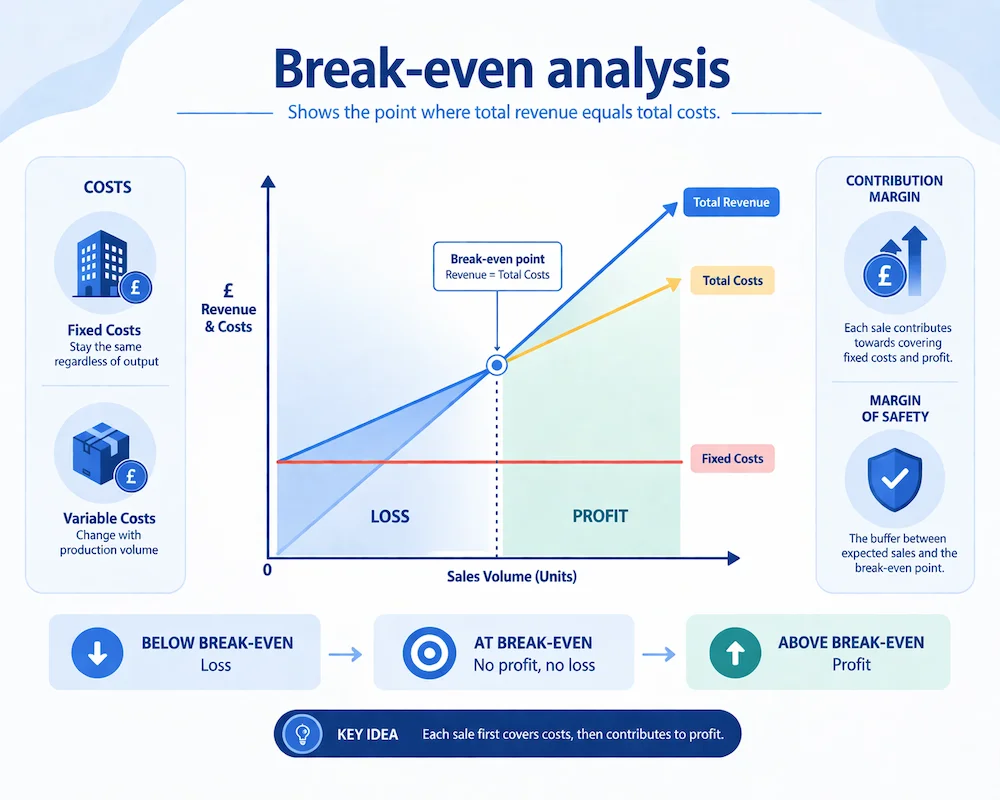
Break-even analysis identifies the sales volume at which a business covers its costs exactly, with zero profit remaining (EBSCO, 2021). In simple terms, it shows the point where total revenue equals total costs.
Any sales above this break-even point generate profit, whereas sales below it incur a loss. This makes break-even analysis a useful tool for understanding when a product, service, or business becomes financially viable.
Example: If a bakery has a break-even point of 500 pastries per month, it must sell at least 500 pastries to cover its costs. Selling more than 500 generates profit, while selling fewer leads to a loss.
Fixed and variable costs:
A clear understanding of costs is central to break-even analysis. Fixed costs (also called overheads) are expenses that remain the same regardless of output, such as rent, salaries, or insurance. Variable costs, by contrast, change with production volume, such as raw materials, packaging, or shipping.
At the break-even point, total revenue is exactly equal to fixed costs plus variable costs (Tutor2u, 2021). By calculating this point, businesses gain insight into the interplay between cost structure and profitability.
Contribution margin:
Break-even analysis also relies on the contribution margin. This is the difference between the selling price per unit and the variable cost per unit. It shows how much each sale contributes towards covering fixed costs.
Once the break-even point has been reached, any further contribution from additional sales becomes profit.
Margin of safety
Another related concept is the margin of safety. This measures how far actual or expected sales are above the break-even point. It indicates the buffer a company has before it would start incurring losses, thus reflecting the level of risk
For example, if break-even is 500 units and expected sales are 800 units, the margin of safety is 300 units, or 60%. A larger margin of safety generally signifies a lower risk of dropping into losses, whereas a small margin signals that sales targets are optimistic and leave little room for shortfall.
How to conduct a break-even analysis
Break-even analysis can be conducted using a straightforward formula. To calculate the break-even point in units, divide the total fixed costs by the contribution margin per unit (SBA, 2024). In formula terms:
Break-even point (units) = Fixed Costs ÷ (Selling price per unit – Variable cost per unit)
Here, the denominator (price minus variable cost) is the contribution per unit toward fixed costs and profit. For reference, if a product sells for £50 per unit and its variable cost is £30 per unit, then £20 is the contribution margin from each sale. Dividing fixed costs by this contribution margin tells us how many units must be sold to cover those fixed costs entirely. This calculation is a fundamental part of cost–volume–profit analysis in managerial accounting (Schmidt, 2023).
To perform a break-even analysis in practice, one can generally follow these steps:
1. Compile variable costs per unit:
List all costs that vary with each unit produced or sold (e.g. raw materials, direct labour, packaging, shipping per product).
2. Sum up fixed costs:
Determine all fixed costs over the period (rent, salaries, utilities, insurance, etc.) that must be paid regardless of output. This typically involves calculating the total overheads for a month or year.
3. Determine the unit selling price:
Identify the price at which the product or service will be sold per unit.
4. Calculate the break-even point:
Plug the values into the formula above. Divide total fixed costs by the difference between unit price and unit variable cost. The result is the number of units that need to be sold to break even.
5. Analyse scenarios:
It can be useful to repeat the calculation under different assumptions. For instance, consider how changes in price, cost, or sales volume would affect the break-even point. This what-if analysis helps in planning for different business scenarios.
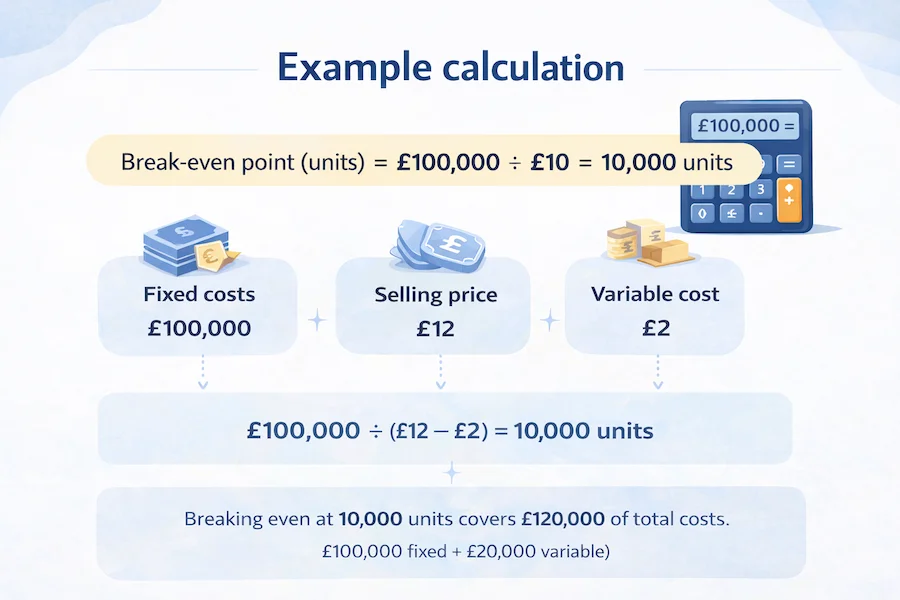
Example calculation: Suppose a company has £100,000 in fixed costs, a product selling price of £12, and a variable cost of £2 per unit. The contribution margin per unit is £12 – £2 = £10. Using the break-even formula, the break-even volume = £100,000 ÷ £10 = 10,000 units. In other words, selling 10,000 units would generate £120,000 in revenue, which exactly covers the £120,000 of total costs (£100,000 fixed + £20,000 variable). At that point the business “breaks even,” earning zero profit. Selling additional units beyond 10,000 will produce a profit, while selling fewer will result in a loss.
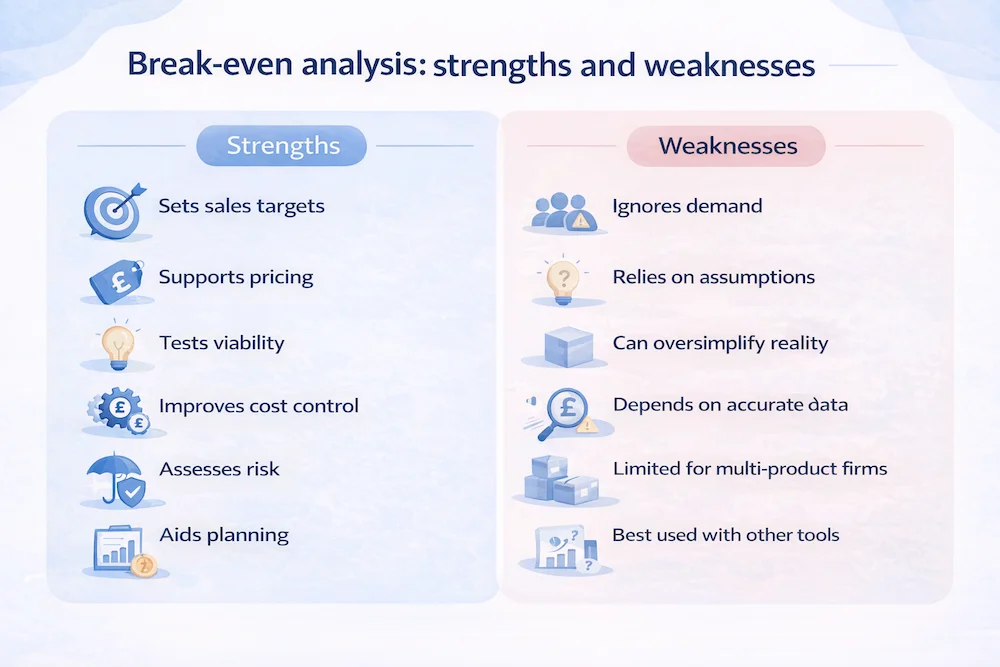
Advantages of break-even analysis
Break-even analysis offers several benefits for business planning and financial decision-making:
Clear profit target:
It focuses attention on the level of sales needed to start making a profit. Managers know exactly how many units they must sell (or how much revenue they must earn) to cover costs. This clarity helps in setting concrete sales targets and timelines for reaching profitability (Tutor2u, 2021).
Feasibility check for new ventures:
For start-ups and new projects, break-even analysis indicates whether a business idea is viable. It shows if the required sales volume is realistic in the market, which aids entrepreneurs and investors in evaluating the profit potential of a venture (SBA, 2024). Potential lenders or investors will also examine the break-even projections in a business plan to assess when they might see returns, as many new ventures lose money initially before breaking even.
Pricing strategy support:
The analysis provides a fact-based foundation for pricing decisions. By understanding the minimum sales volume and price needed to cover costs, businesses can set prices more intelligently (GoCardless, 2022). Rather than relying solely on intuition or market norms, managers use break-even data to ensure pricing will at least cover costs and contribute to profit goals. Using break-even figures in this way ensures that managers set prices with full awareness of their cost structure and profit goals (GoCardless, 2022).
Cost control insights:
Break-even calculations highlight the impact of cost structure on profitability. They illustrate, for instance, that higher fixed costs will raise the break-even point. This insight encourages keeping fixed costs as low as possible and controlling variable costs per unit. Managers can see how reducing expenses would lower the break-even threshold. For example, finding cheaper suppliers or lowering overheads will improve the margin of safety (Tutor2u, 2021). The analysis underscores the importance of cost management – e.g. it shows that if fixed costs increase, the business must achieve higher sales to break even, whereas reducing fixed expenses lowers the break-even point and risk.
Margin of safety analysis:
Break-even analysis allows computation of the margin of safety – the cushion between expected sales and the break-even sales. This is valuable for risk assessment. It shows how much sales could fall short of forecasts before the company would start losing money (Tutor2u, 2021). A large margin of safety can reassure management. In contrast, a small margin of safety signals that projections are optimistic and leave little room for error.
Quick and simple tool:
The break-even point is relatively easy to calculate and understand. The methodology involves basic arithmetic, making it accessible and quick to perform for different scenarios (Tutor2u, 2021; Gallo, 2014). Managers appreciate that they can perform such analysis swiftly to obtain rough estimates. For example, they might ask what would happen if the price is cut by 10% – how many additional units would need to be sold to break even? Rapid calculations like these enable quick “what-if” analysis for decision-making.
Objective decision-making:
Break-even analysis adds quantitative rigour to decisions that might otherwise be based on gut feeling. It grounds discussions about projects or investments in concrete figures. This can reduce emotional or biased judgements because the analysis clearly shows the financial conditions for viability. In practice, break-even analysis can serve as a warning. It may prevent entrepreneurs from pursuing ideas that are unlikely to ever become profitable by revealing an unachievable break-even point. Overall, the technique encourages data-driven decisions and helps avoid wishful thinking.
Supports financial planning and funding:
Incorporating break-even metrics into financial plans helps align goals across the business. Break-even analysis is often required when seeking financing. Demonstrating a reasonable break-even point can increase investors’ confidence in the business plan (SBA, 2024). Showing a clear path to break-even (and how soon it can be reached) is often key to convincing stakeholders that a venture can succeed.
Limitations of break-even analysis
While useful, break-even analysis has several limitations and managers should apply it with care. Some of the main limitations include:
Ignores market demand:
Break-even calculations are a supply-side analysis – they indicate the required sales volume but not whether achieving that volume is realistic (EBSCO, 2021). The model does not incorporate actual market demand or consumer behaviour. Suppose the calculations show that breaking even requires 10,000 units. If the market will only buy 5,000 units, a break-even analysis alone won’t highlight that gap. Likewise, break-even charts do not account for competition. They also omit changes in consumer preferences that can affect actual sales volumes. The analysis only tells you what you need to sell, not how much customers will actually buy.
Unrealistic cost and price assumptions:
The basic break-even model assumes the unit selling price and unit variable cost remain constant at all levels of output. In reality, this is not always true. Businesses may lower prices to boost sales at high output volumes. They might also benefit from bulk-purchase discounts on inputs that reduce the variable cost per unit (Tutor2u, 2021). By treating the unit selling price and unit cost as fixed values, the analysis simplifies reality. It may misestimate the break-even point if economies of scale or price elasticity come into play.
Fixed costs can change over time:
The analysis treats fixed costs as a given constant. In practice, fixed costs can step up when a business expands capacity. For example, beyond a certain output level a factory might need new equipment or a larger facility. Such changes would raise the fixed cost base. Thus, break-even analysis is valid only within a certain range of output. Beyond that scale, fixed costs are no longer truly fixed. Inflation and other external factors can also increase fixed costs over time, altering the break-even point.
Production versus sales:
A standard assumption is that everything produced is sold at the same price. In real businesses, production and sales can diverge. Inventory might build up if goods do not sell immediately, or some output could go unsold. Break-even analysis does not handle such scenarios well; it effectively assumes inventory is zero and that all units produced are sold. If a company produces 10,000 units but can only sell 8,000, it has not actually broken even – unsold inventory means the company is still incurring a loss even though the break-even formula might suggest 10,000 units. Managers must be mindful of this gap between production and sales when using break-even models.
Single-product focus:
Break-even analysis is easiest applied to a single product or service. For companies with multiple products (each with different margins), determining an overall break-even point becomes complex. It typically requires assuming a constant product sales mix, which introduces potential error. The simple formula doesn’t accommodate changes in sales mix – if the mix of products sold shifts, the break-even calculation for the business as a whole can change. In multi-product firms, break-even analysis is often done for each product line separately, or simplified by using a weighted-average contribution margin, both of which have limitations.
Static model – no time dimension:
Break-even analysis provides a snapshot based on certain inputs and does not inherently consider dynamic or time-based factors. It should be viewed as a planning aid rather than a definitive predictor of success (Tutor2u, 2021). It doesn’t account for profitability beyond the break-even point. Nor does it consider factors like cash flow, return on investment, or changing market conditions. Because of this simplicity, it should remain only one tool among many. In practice, actual performance can diverge from break-even forecasts if underlying assumptions do not hold.
Data sensitivity and accuracy:
The quality of a break-even analysis is only as good as the accuracy of the data and assumptions used. If a business underestimates certain costs or overestimates the likely selling price, the calculated break-even point will be wrong. Costs that are hard to classify (or semi-variable costs) can also be problematic to allocate properly in the model. This sensitivity means managers must be cautious – break-even results are indicative estimates, not guarantees. It is best to use break-even analysis alongside other financial metrics to get a full picture.
Not a decision-maker on its own:
Importantly, break-even analysis should complement, not replace, other financial analysis. It doesn’t cover all aspects of financial viability. For example, it does not evaluate how profitable a project could become after breaking even, nor the time it takes to reach break-even. Other analytical methods (such as net present value or scenario analysis) are needed to assess broader performance and risk. For instance, a project might have a reasonable break-even volume. However, if achieving that volume takes too long or requires an unrealistic market share, other analytical methods (such as net present value or market analysis) could reveal problems that a simple break-even perspective might miss. Thus, break-even analysis is one useful lens, but it should be applied alongside broader market research and financial planning.
Applications of break-even analysis
Break-even analysis is applied in various planning and decision-making contexts in business. Key applications include:
Business planning for new ventures:
Entrepreneurs use break-even analysis in the startup phase to evaluate business ideas. By calculating how many units need to be sold (and by when) to cover all costs, they can judge whether the projected sales seem feasible. This is a critical part of a business plan. Potential investors or banks will examine the break-even point to assess when the business might become profitable (SBA, 2024). For example, if a startup’s break-even sales volume appears extremely high, that may signal the business model is not viable without changes to pricing or costs. Conversely, a low break-even point can indicate a relatively safer proposition.
Pricing decisions:
Companies often perform break-even calculations when setting prices for a product or service. It helps identify the minimum price or sales volume required to avoid losses. Alongside market research, break-even analysis shows the trade-off between price, volume, and profit. Businesses might ask: if we set a certain price, how many units must we sell to break even, and is that sales level attainable? Answering such questions with data ensures that managers set prices with full awareness of their cost structure and profit goals (GoCardless, 2022).
Product launch and investment evaluation:
Before launching a new product or making a significant investment, managers use break-even analysis to understand the required sales to recoup the investment. For instance, if a company invests £200,000 in new machinery, break-even analysis can determine how many units must be sold to recover that cost. This aids in go/no-go decisions and in setting targets for the new product line. Break-even analysis is also used to compare strategic alternatives. Managers might weigh producing in-house (with higher fixed costs) versus outsourcing (which makes costs more variable) by examining how each option’s break-even point differs. In addition, companies use the technique to estimate how long it will take for a new project to become profitable, which is crucial for planning and investor communications.
Budgeting and target-setting:
Established businesses integrate break-even calculations into their budgeting and forecasting process. Managers set quarterly or annual sales targets that at minimum exceed the break-even volume, ensuring the company remains safely profitable. Break-even analysis also helps in evaluating the impact of cost changes on the bottom line. For example, if a company is considering a cost-cutting initiative, it can calculate a new break-even point after the cost reduction. This will show how much sooner the firm could reach profitability at the lower expense levels. In general, break-even models allow management to perform sensitivity analysis – examining how changes in costs or prices would affect profit targets.
“What-if” scenario analysis:
Break-even tools are valuable for scenario planning. Companies can model different scenarios by adjusting key variables and recalculating the break-even point. This allows decision-makers to gauge the robustness of their business under various conditions. For instance, a firm might consider: if our variable costs rise by 10%, how many more units would we need to sell to break even? They might also consider the impact of expansion; for example, if fixed costs increase by £50,000, what sales volume would they need to break even then? Such insights help inform strategic choices, such as whether to enter a new market or how to respond to cost fluctuations. Management can thus use break-even analysis to test the financial viability of different strategies (e.g. changing suppliers, altering pricing, or expanding capacity) before committing to them.
Crisis management and turnaround plans:
In difficult times – for example, after a sharp drop in sales or in the aftermath of an economic shock – break-even analysis is used to plan a path back to profitability. Management can recalculate the break-even point to determine the minimum sales needed to avoid losses. This informs decisions on cost cuts or sales initiatives needed to survive. This approach has proven useful in cases like disaster recovery. In such situations, firms demonstrate to stakeholders that they have a path back to breaking even and beyond. By showing how and when the business can get back to break-even, managers can create realistic turnaround strategies and set short-term goals (such as “reduce costs by X to lower the break-even point to current sales levels”). This application helps businesses navigate crises by focusing on the critical threshold of cost versus revenue.
Conclusion
Break-even analysis is a fundamental analytical tool in business that ties cost information with revenue projections to answer a simple but crucial question: at what point will operations become profitable? Its strength lies in clarity and simplicity – it distills complex cost and revenue data into a single, digestible figure (the break-even point). By doing so, it provides a starting point for entrepreneurs designing business models and for managers making decisions on pricing, budgeting, and investments.
However, it is important to remember that break-even analysis is built on simplifying assumptions. Real-world business dynamics – changing costs, fluctuating demand, multiple products, competitive actions – mean that the theoretical break-even point calls for cautious interpretation. Wise practitioners treat break-even analysis as a framework in conjunction with other financial metrics and market analysis. When applied appropriately, break-even analysis offers valuable insight into cost behaviour and profitability thresholds. It helps decision-makers navigate toward sustainable business outcomes, but it should always be used alongside broader analysis and sound judgment.
Whether you need help with break-even analysis or any other business assignment, our expert writers are here to help you produce work that stands out. Visit our business assignment help page for more information.
References
- Amy Gallo (2014) “A Quick Guide to Breakeven Analysis.” Harvard Business Review, 2 July 2014. [Online]. Available at: https://hbr.org/2014/07/a-quick-guide-to-breakeven-analysis
- Corporate Finance Institute (2023) “Break Even Analysis.” Corporate Finance Institute (CFI) Resources. [Online]. Available at: https://corporatefinanceinstitute.com/resources/accounting/break-even-analysis/
- EBSCO (2021) “Break-even Analysis.” EBSCO Research Starters: Business (published 2021). [Online]. Available via EBSCOhost database (Business Source Ultimate)
- GoCardless (2022) “What Is Break-Even Analysis? Definition, Calculation, Pros & Cons.” GoCardless Online Guides, last edited May 2022. [Online]. Available at: https://gocardless.com/guides/posts/what-is-break-even-analysis/
- Tutor2u (2021) “Breakeven Analysis – Strengths and Limitations.” Tutor2u Business Reference Library, updated 22 March 2021. [Online]. Available at: https://www.tutor2u.net/business/reference/breakeven-analysis-strengths-and-limitations
- U.S. Small Business Administration (2024) “Break-even point.” SBA Business Guide: Calculate Your Startup Costs, updated 3 October 2024. [Online]. Available at: https://www.sba.gov/business-guide/plan-your-business/calculate-your-startup-costs/break-even-point
Cite This Work
To export a reference to this article please select a referencing stye below:


