SaaS for Customer Analysis
| ✅ Paper Type: Free Essay | ✅ Subject: Technology |
| ✅ Wordcount: 2349 words | ✅ Published: 27 Mar 2018 |
Abstract
Software as a Service (SaaS) provides software application vendors a Web based delivery model to serve large number of clients with multi-tenancy based infrastructure and application sharing architecture. With the growing of the SaaS business, data mining in the environment becomes achallenging area. In this paper, we suggest a new metric along with a few existing metrics for customer analysis in a Software as a Service environment.
Keywords: Software as a Service, SaaS, Customer Behavior analysis, Data mining in SaaS Environment
Introduction
With the rapid development of Internet Technology and the application software usage, SaaS (Software as a Service) as a complete innovative model of software application delivery model is attracting more and more customers to use SaaS for reducing the software purchase and maintenance costs as it can provide on-demand application software, and the users can adjust the functions provided by services to meet changes in demand. SaaS is gaining speed with the considerable increase in the number of vendors moving into this space[1]. The SaaS model is different from a regular website model. In a regular website model, users of the software directly interact with the software application. But in the case of a SaaS model, users interact with the application through the service provider. The difference between a regular website model and a SaaS model can be shown in figure 1.
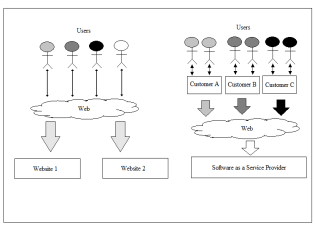
Figure: 1
Motivation
Software as a Service (SaaS) is being adopted by more and more software application vendors and enterprises [2].SaaS is beneficial for the customers in such a way that, a customer can unsubscribe from the services whenever he wants which makes it a challenge to manage customer relationships. One of the characteristics of the SaaS business model is that one SaaS service needs to serve a large number of customers, among which considerable portion are customers for whom services are offered on trial basis. As there is competition in the market, both trial and paying customers may move their business to another service provider based on their requirements. It is essential for a service provider to retain the customers from migrating to another service provider. Previous studies show that a small increase in retention rate would lead to a considerable increment in the new present value of the customers. To withstand the competition in the market, a service provider should satisfy the customers by understanding their current behavior and predicting their next move like if they are having any problems in using the services, how much are the customers satisfied based on the seriousness and activeness of the customers.
Related Works
A lot of work has been done in the area of analyzing the customers’ behavior on website model. Various methodologies are stated by various authors on various processes in mining the web. In [3] Sindhu P Menon and Nagaratna P Hegde, analyzed the views and methodologies stated by various authors on various processes in web mining.
In [4] R. Suguna and D. Sharmila listed out work done by various authors in the web usage mining area.
In [5] the authors Jiehui Ju. Et.al, gives a quick survey on SaaS. It covers key technologies in SaaS, difference between Application Software Provider and Software as a Service Provider, SaaS architecture and SaaS maturity model and the advantages that SaaS offers to small businesses.
In [6], the authors Espadas et. al, presents the analysis of the impart of a set of requirements and proposes guidelines to be applied for application deployment in Software as a Service (SaaS) Environment.
In [7], the authors Ning Duan, et. al, proposed an algorithm and two metrics which work with the collaboration among the users of a customer in a Software as a Service environment.
Problem Definition
In a SaaS Environment, an effective relationship with the customer depends on how much the status of each customer is understood. In order to understand the status of a customer, it is necessary to study the behavior of ehte customer form time to time. It is necessary to predict the customers’ seriousness and activeness in using the service. This prediction may help the service providers in improving their business strategies. In a business to customer website model, the mining is done based on selected metrics like visit frequency, average depth, average stay time etc. In the case of SaaS model, there is another level of users who actually use the service. So, regular user behavior metrics may not yield accurate results in the case of SaaS model. If individual customer’s user’s behavior is studied, then the difference between the customers may be identified.
A lot of research is done on user behavior analysis in regular website model but those methods used for user behavior analysis may not guarantee accurate predictions. So an extra parameter or metric is to be considered. As in the SaaS model, a tenant is the direct customer of the service provider and the actual users of the service are the users of the customers, one way to study the behavior of the customers may be by summing up the individual user’s metrics of a customer to evaluate the customer’s behavior. But this way ignore the individual differences of the behaviors of the users of a customer. In addition to these regular web usage mining metrics if collaboration among the users is also considered in the analysis of customer behavior, it may yield better results than just using the regular metrics. But previous works done in user behavior analysis in SaaS uses only collaboration metrics in the analysis which ignores almost half of the analysis data.
The experiment done aims at using collaboration metrics along with another metric which works with the data not considered in the collaboration metric calculation so that all the available data is considered in user behavior prediction.
Experiment
The experiment is done in two phases, namely Data Collection Phase and Data Processing Phase. In the Data collection phase, the necessary data (like server log files, transaction history, etc) are collected. In the second phase i.e. in Data Processing phase, the actual analysis takes place. This phase is further divided into individual modules like preprocessing, pattern discovery, and pattern analysis.
Preprocessing is a process of refining the sever log data and transaction history removing noise in data (if any) and populating database for further use in next modules. It includes data cleaning, user identification, session identification, transaction identification.
Pattern Discovery is the process of discovering the usage patterns from the cleaned raw log data. As in this experiment, it is not regular usage patterns that are to be considered, collaboration patterns are to be considered. Regular usage patterns are the sequences of activities that are performed by the users individually. But, collaboration patterns are those that are performed by users by interaction. Collaboration patterns are not the transaction patterns rather they are the patterns of users that collaborate to perform a transaction.
Definition of Collaboration: Collaboration is defined to happen when different users of a customer work on the same business object during a certain period of time. For example, in a Human Resource management SaaS service, the vacation request is submitted by a regular employee user of a customer and then is approved/rejected by manager user of the same customer. Here two users of a customer are involved in the process of granting a leave. This is called collaboration.
After the raw data is cleansed, the data used for collaboration discovery may contain details of the transactions performed by the users of any tenant with tenant id(tid), user id (uid), transaction id (transaction_id) (may also be called business object id), date, time, service id (sid). In this table more than one user may be involved in the completing of a transaction.
Algorithm: Collaboration User Set Identification
Input: Table 1 that consists of the transaction details
Output: Collaboration_Table with collaboration transaction details
Initially Collaboration_Table is empty
- Get first record from Table 1
- Insert details into Collaboration_Table
- While end of table 1 not reached
- Get next record from table 1
- Search for transaction_id in collaboration_Table
- If found, update collaboration user set and no_of_users
- Else Add details to collaboration_table as new record
Table 1: Sample table showing the contents of Table 1
|
Transaction Id |
Tenant Id |
User Id |
Date |
Time |
Activity |
|
101 |
T001 |
Cus306 |
12/01/2010 |
8:00 |
Upgrade |
|
102 |
T001 |
Cus021 |
12/01/2010 |
8:30 |
Booking |
|
101 |
T001 |
Emp05 |
12/01/2010 |
8:35 |
Upgrade |
|
103 |
T001 |
Cus06 |
12/01/2010 |
9:00 |
Booking |
Table 2: Sample Collaboration Table
|
Transaction_id |
Tenant_id |
User set |
No. of Users |
|
101 |
T001 |
Cus306, Emp05 |
2 |
|
102 |
T001 |
Cus021 |
1 |
|
103 |
T001 |
Cus06 |
1 |
Pattern analysis plays vital role in the experiment. This module deals with the behavior analysis based on the collaboration patterns extracted above.
From [7], there are two type of collaboration. They are random collaboration and repeated collaboration by certain group of users. The first type of collaboration can indicate the activeness of the customer no matter which users are involved in the collaboration process. It can be called as Active Collaboration Index (ACI). The second type of collaboration can be described by the usage patterns among the users of a customer. It can be called Patterned Collaboration Index (PCI). A high ACI value tells that a customer is actively using the SaaS service and if such a customer is still a trial customer, it probably shall be the high priority target to get it converted into paying customer. A high PCI value tells that a tenant is seriously using the SaaS service with relatively strong loyalty, cross-selling or up-selling opportunity can be explored for such a customer. The formula to calculate ACI and PCI are as follows


The AppCNorm is the normalizing factor indicating collaboration characteristic of SaaS service. While some SaaS service are rich with collaborations and others may not be. In order to balance the difference among different SaaS services, this normalization factor is employed.

Where Pni denotes the collaboration pattern i of customer n, N is the total number of customers, and m is the total number of patterns in customer n. supp(pni) is the support value of pattern Pni, and len(Pni) is the length of the pattern.
These collaboration metrics works only with the collaboration data and neglects the remaining data which is almost half of the data. Hence another metric can be added along with the above metrics which considers the non-collaboration transactions. As the new metric is for non-collaboration transactions of a tenant, it can be called Average Usage Index (AUI). This can be calculated using the formula


This AUI increases the accuracy of prediction of activeness of the customer along with ACI.
RESULTS
For this experiment, the data created is for 100 customers of a Software as a Service provider who is providing 6 different components of an application as different services. Among these 100 customers, first 50 are taken as paid customers and the other 50 are taken as trial customers.
Table 3: Summary of transactions
|
Customer type |
Collaboration user set length distribution |
|||
|
Length of pattern |
1 |
2 |
3 |
4 |
|
Paid Customer |
43158 |
23102 |
14411 |
8647 |
|
Trial Customer |
34241 |
17940 |
11357 |
6789 |
Table 4: Sample pattern list
|
Type of customer |
Customer id |
Collaboration pattern |
||
|
Pattern |
Support |
Length |
||
|
Paid |
T0 |
Emp Ta,emp Emp,emp,emp Cus,emp,cus,emp |
0.31873200 0.04553314 0.06167147 0.01095100 |
1 2 3 4 |
|
T01 |
Cus Cus, emp Emp, ta, emp Ta,emp,cus,emp |
0.07826087 0.04347826 0.00489130 0.00815217 |
1 2 3 4 |
|
|
Trial |
T50 |
Cus Emp, ta Emp,cus,emp Emp,ta,emp,ta |
0.09480676 0.01449275 0.01570048 0.00120772 |
1 2 3 4 |
|
T51 |
Ta Emp,emp Cus,emp,emp Emp,ta,emp,emp |
0.09698276 0.02101293 0.01131465 0.00215517 |
1 2 3 4 |
Table 5: Sample Calculated Metrics
|
Type of customer |
Customer id |
ACI |
AUI |
PCI |
|
Paid |
T0 |
0.00150 |
1.99625 |
0.33214 |
|
T45 |
2.96354 |
1.80213 |
4.55162 |
|
|
Trial |
T50 |
1.04676 |
0.95008 |
2.56944 |
|
T89 |
0.0 |
0.03214 |
0.00231 |
From the above calculated values, we can observe that though T0 is a paid customer, less ACI and PCI values indicate that this customer is not using the services to the full and hence revenue generated from this particular customer is not appreciable. Rather, this customer may be planning to unsubscribe from the service and hence is an important target for the service provider to retain the customer. In the case of T45, it has high ACI value, high AUI value indicating active usage of the services and high PCI indicating that this customer is completely migrating his business onto the SaaS service generating the service provider more revenue. Among the sample trial calculated values, customer T50 is active and serious and hence, there is a high probability for this customer to convert into paid customer. On the other hand, customer T89 is not very active and is not serious indicating that he may be facing technical difficulties in using the services and hence should be helped with or is thinking to unsubscribe from the services.
Table 6: Summary of Calculated metrics
|
Type Ofcustr |
ACI |
AUI |
PCI |
||||||
|
Min |
Max |
Avg |
Min |
Max |
Avg |
Min |
Max |
Avg |
|
|
Paid |
0 |
3.665 |
1.346 |
0 |
3.015 |
1.765 |
0 |
4.878 |
2.66 |
|
Trial |
0 |
1.325 |
0.661 |
0 |
1.865 |
0.394 |
0 |
3.774 |
1.26 |
From the above table, for any tenant to be considered active in using the services, minimum ACI and AUI values needed are 1 and 1 respectively and minimum PCI value needed is 2.
Conclusion
The metrics ACI and PCI are introduced in previous works done by Ning Daun, et. al in [7] which works with collaboration data and leaving the non collaboration data. In our work, a new metric is introduced AUI which considers the non collaboration data also in customer behavior analysis. Still further, frequent pattern analysis can be applied on this non collaboration data to get usage patterns and so the analysis can be further improved.
References
[1] Wei Sun, Xing Zhang, Chang Jie Gou, Pei Sun, Hui Su, IBM China Research Lab, Beiing 100094, “Software as a Service: Configuration and Customization Perspective” IEEE Congress on Services Part II, IEEE 2008.
[2] E. Knorr, “ Software as a Service: The Next Big Thing”, http://www. infoworld.com/article/06/03/20/76103_12FEsaas_1.html”
[3] Sindhu P Menon, Nagaratna P Hegde, “Requisite for Web Usage Mining – A Survey”, Special Issue of International Journal of Computer Science & Informatics: 2231-5292, Vol-II, Issue-1, 2, pp. 209-215.
[4] R. Suguna, D. Sharmila “An Overview of Web Usage Mining”, International Conference of Computer Applications (0975 – 8887), Vol. 39, No, 13, February 2012, pp. 11 – 13.
[5] Jiehui, et. al, “Research on Key Technologu=ies in SaaS”, International Conference on Intelligent Computing and Cognitive Informatics, 2010, pp. 384-387.
[6] Espadas et. al, “Application Development over Software-as-a-Service platforms”, The Third International Conference on Software Engineering Advances, 2008, pp. 87-104.
[7] Ning Duan, et. al, “Tenant Behavior analysis in Software as a Service Environment”: Service Operations, Logistics and Informatics (SOLI), 2011 IEEE International Conference, pp 132-137, July 2011.
Cite This Work
To export a reference to this article please select a referencing stye below:
Related Services
View all


DMCA / Removal Request
If you are the original writer of this essay and no longer wish to have your work published on UKEssays.com then please click the following link to email our support team:
Request essay removal