Analysis Of Multidimensional Data Using Various Methods
| ✅ Paper Type: Free Essay | ✅ Subject: Technology |
| ✅ Wordcount: 1163 words | ✅ Published: 15 Sep 2017 |
Nikhil Deshmukh
Abstract– Data is exponentially increasing every year, business wants to analyze data more accurately and efficiently. Analyzing huge amounts of data is tedious tasks that involve considerable challenges, commitments and organizational expense. This paper provides an overview of different methods and tools to analyze data in the data warehouse. We will analyze the six dimensional data using both relational database and multidimensional method and compare the performance by calculation using actual data.
Keywords- Data Warehouse; Analysis; OLAP; Relational; Multidimensional.
Data warehouses contain data consolidated from several databases and are large in magnitude (sometimes in terabytes). Data warehouses are used mainly for decision ssupport applications and provide the summarized data than detailed, individual records for analyzing purpose. Some organizations are using data marts because data warehouse construction is a complicated process. Data marts contain information in the form of subsets for any specific department. On data warehouse and data marts, different data analytical methods can be used. In section II, two methods of data analysis is explained first is conventional query method or using simple SQL and second method is Multidimensional analysis and its different types. In the next section we have shown the incapability of conventional query method by taking the real world example and by comparing the performance of both on the basis of time taken to execute the operation and disk space used.
A. Query and Reporting
These are data query tools, this type of tool formulate stand alone query and after analyzing statically it gives result in the form of graphs. Such type of tools does not support multidimensional analysis and can execute only simple queries, they do not offer aggregation and consolidation concepts. These tools are optimum to generate request like “How many number of articles do we have in
the stock” [1]. That is why these types of tools are called soft analysis tools.
B. Multidimensional analysis
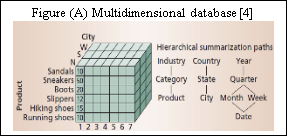
In multidimensional database data is stored in the form of array table which allows fast visual representation of accumulated data. Sometimes it is necessary to model data multidimensional for complex analysis and visualization, especially in decision support system. Multidimensional view or structure can be considered as cubes, we can also call it cubes within cubes where each side of the cube is a dimension as shown in the fig (A) [4]
To analyze multidimensional data OLAP (On-line analytical processing) is used. Types of OLAP are Multidimensional OLAP (MOLAP), Relational OLAP (ROLAP), Hybrid OLAP (HOLAP) and Spatial OLAP (SOLAP).
1) OLAP: This type of server enables analysts to deep dive into performance through variety of view of the data. It shows multidimensional phase of the business data through different views. OLAP operations include Pivot (change of orientation of the multidimensional view), slice and dice (selection and projection), rollup (increasing or decreasing the aggregation level) along one or more dimensions. Conceptual model of OLAP stress on aggregation as one of the key operation e.g., computing the total production by each state (or by each month) and give the ranking accordingly. Some important characteristics of OLAP is summarization, projected data, fast interactive analysis, multidimensional view, Frequently changing business model and medium to large data sets. [2]
2) MOLAP: Multidimensional OLAP directly supports the multidimensional view of the data through storage engine. This provides very good indexing properties and speed but bad utilization of space, especially in case of sparse data; example is ESSBASE (ARBOR). [4][7]
3) ROLAP: Relational OLAP are the intermediate server sits between backend server and client. It supports multidimensional OLAP query on-the-fly. It utilizes transaction and scalability feature of relational system but mismatch between both queries can create performance issue. [4][6]
4) HOLAP: Combination of MOLAP and ROLAP is HOLAP. ROLAP server gives better performance when data is not very dense and performance of MOLAP improves when data is dense. Many vendors such as Speedware and Microsoft are thus using HOLAP, storing dense regions of the cube using MOLAP and storing the rest using a ROLAP approach [3].
5) SOLAP: This is the category of OLAP which explores the data related to space (spatial data).SOLAP integrates concept from Geographic information system (GIS) and OLAP. It is a visual platform built especially to support fast and convenient temporal analysis and analysis of data following a multidimensional approach consist of different aggregations levels available in the form of graph and tabular display. [5]
To illustrate we will take 6 dimensional business model of Beverage Company. The relational schema consists of a Fact table and one table per dimension. It contains one row for each – Channel (6 members), Product (1500), Market (100), Time (17), Scenario (8) and Measures (50). A simple OLAP scenario in which we need to get the actual profit and compare with the budget.[8]
A. Relational Approach
The number of rows in fact table is = product of dimensions =122 million, with 80 % sparsity no of rows is 24 million. If we assume 4k block size total size id 17 GB including joins. To retrieve variance between actual and budget 6 ways joins and 17 I/O will be used which will take approximate 237 hours of I/O time. This process should be repeated for all the values, It is clearly impractical to do this with relational approach.[8]
B. Multidimensional Approach
We will use the same model with Multidimensional database such as ESSBASE. In the Beverage company example a block will consist of time*scenario*measure*8 bytes per cell = 55k with 80% sparsity block size will be 10 GB. 55k with 80% sparsity block size will be 10 GB.s
C. Comparison
Table -1: Performance comparison between relational and multidimensional approach [8]
|
Relational approach |
Multidimensional approach |
Improvement in performance |
|
|
Disk Space (GB) |
17 |
10.2 |
1.7 |
|
The calculation of variance (Hours) |
237 |
2 |
110 |
After calculation on 6 dimensional business model using both the approaches it can be concluded that conventional relational data base approach takes more time and disk space than multidimensional approach. It is not feasible for relational approach where requirement is complex and many dimensions have been used because of the high operating cost of processing different joins and restriction across huge number of tables. In such cases multidimensional approach should be used, Query tools can only be used in case of simple database requirements. In this paper we also looked up at the different types of multidimensional analysis methods.
References
- M.-P. Nachouki, V. Lambert, R. Lehn, “Data warehousing tool’s architecture: from multidimensional analysis to data mining”, vol. 00, no. , pp. 636, 1997
- Surajit Chaudhuri, Umeshwar Dayal, “An overview of data warehousing and OLAP technology” ACM SIGMOD Record: Volume 26 Issue 1, March 1997
- Kaser, Owen, Lemire, Daniel, ” Attribute value recording for efficient Hybrid OLAP”, Information Sciences, 2006, Volume 176, Issue 16
- S. Chaudhuri; U. Dayal; V. Ganti, “Database technology for decision support systems” IEEE Year: 2001, Volume: 34, Issue: 12
- Rosa Matias; Joao Moura-Pires “Spatial On-Line Analytical Processing (SOLAP): A Tool the to Analyze the Emission of Pollutants in Industrial Installations” portuguese conference on artificial intelligence 2005
- Agrawal S. et.al. “On the Computation of Multidimensional Aggregates” Proc. of VLDB Conf., 1996.
- S. Sarawagi, “User Adaptive Exploration of OLAP Data Cubes,” Proc. VLDB Conf., Morgan Kaufmann, San Francisco, 2000, pp. 307-316.
- George Colliat, “OLAP, relational, and multidimensional database systems”,ACM SIGMOD Record: Volume 25 Issue 3, Sept. 1996
Cite This Work
To export a reference to this article please select a referencing stye below:
Related Services
View all


DMCA / Removal Request
If you are the original writer of this essay and no longer wish to have your work published on UKEssays.com then please click the following link to email our support team:
Request essay removal