Statistical Analysis of Train Arrival Times
| ✅ Paper Type: Free Essay | ✅ Subject: Statistics |
| ✅ Wordcount: 2367 words | ✅ Published: 07 Sep 2017 |
Introduction
In carrying out this project, the Researcher will be able to provide the reader with the findings of the project works through the use of Class Material and Statistical Data collected which was conveyed using the real-time analysis and Irish Rails Annual Report. In doing so, this will establish “in short” the output response by way of the train’s arrival time. In addition, producing regression analysis graphs in terms of Null and Alternative Hypotheses being asked and relayed through the workings of Minitab (ANOVA – (one way factor) will determine the P-value by way of the design of the experiment (DoE)
The project will be focusing on the requirements set under the “Public Service Contract” between the National Transport Authority and Iarnród Éireann – Concerning Compensation for Public Service Obligations pursuant to Dublin Transport Authority Act 2008 (as amended by the Public Transport Regulation Act 2009) and EC Regulation 1370/2007, Schedule B – Performance Obligations of Iarnród Éireann to complete this project (Irish Rail 2017).
This report will provide key information to be documented and relayed throughout this project, such as:
- Describing the process you are analysing, generically and technically.
- Designing an experiment that will allow you to determine the effect of the factor on the output response, run the experiment and gather the data appropriately and taking into account Sample size, Randomization, Independence and Previous results available.
- Providing statistical analysis of the experiment and describing the statistical evidence collected, in terms of Null and Alternative Hypotheses
- Show results of your experiment. In particular, does the factor affect the output response? Does your assumption, statistical and technical, seem reasonable for these data collected?
- Identify one area of weakness in your study and/or your results and suggest how a new study could investigate it to improve the performance of the process.
(Luu ,2017)
In completion of this project the research hopes to reach an agreement based on the train time performance obligations against the researchers real-time data collected. This in turn has given rise to the question being asked by way of the Null and Alternative Hypotheses. In doing so it produces findings by way of graphs which focus on the residual analysis produced and P-value based on Irish rails 95% confidence requirement.
Thereafter, determining the level of compliance being corresponded by Irish rail against real-time analysis output response carried out over a two week period. Results were achieved through the use of Irish Rail real time software application.
Finally, the researcher himself has an added interest in the findings as he has spent the last 5 years using the service from Dublin to Galway and Galway to Dublin collectively and is fully aware of post -arrival time delays and their add -on effects that he has endured on arriving at his final destination and the knock on effects interlinked.
Irish Rail – company profile Iarnród Éireann is a service that provides passengers and freight rail services both intercity and regional services. Operating between Dublin, Belfast, Sligo, Ballina, Westport, Galway, Limerick, Ennis, Tralee, Cork, Waterford and Rosslare, Europort and Iarnród Éireann jointly operates the Dublin to Belfast Enterprise service with Northern Ireland Railways.( Irish Rail 2017)
In addition the DART service operates between Greystones and Howth/Malahide. It also runs a commuter service in the Dublin area between Gorey, Drogheda, (Irish Rail 2017)
Performance obligation punctuality and reliability & Track Records
Punctuality is set by the National Transport Authority (NTA) for all routes which regulates Irish Rails performance rates. Punctuality is defined as on time or within 10 minutes of arrival times. Delays outside of Iarnród Éireann’s control are trucks hitting bridges or extreme weather conditions such as snow or fog (Irish Rail 2017). The NTA performance reports under the Public Service Obligation contract is measured against Iarnród Éireann punctuality records. This excludes delays as stated above and figures are independently verified by the NTA. Reliability simple put is whether the train operates or not.
Train performance in terms of punctuality and reliability Galway to Dublin track performance results 2016
|
Period |
Dates |
Punctuality |
Reliability |
|
01 |
Jan 01 to Jan 31 |
95.1% |
100% |
|
02 |
Feb 01 to Feb 28 |
96.4% |
100% |
|
03 |
Feb 29 to Mar 27 |
96.8% |
100% |
|
04 |
Mar 28 to Apr 24 |
94.9% |
100% |
|
05 |
Apr 25 to May 22 |
95.4% |
100% |
|
06 |
May 23 to Jun 19 |
95.5% |
99.38% |
|
07 |
Jun 20 to Jul 17 |
94.4% |
100% |
|
08 |
Jul 18 to Aug 14 |
94.3% |
100% |
|
09 |
Aug 15 to Sep 11 |
96.7% |
100% |
|
10 |
Sep 12 to Oct 09 |
97.9% |
100% |
|
11 |
Oct 10 to Nov 06 |
93.4% |
100% |
|
12 |
Nov 07 to Dec 04 |
92.6% |
99.70% |
|
13 |
Dec 05 to Dec 31 |
0.00% |
0.00% |
Galway to Dublin track performance results 2015 (Irish Rail 2017)
|
Period |
Dates |
Punctuality |
Reliability |
|
01 |
Jan 01 to Jan 25 |
92.2% |
99.83% |
|
02 |
Jan 26 to Feb 22 |
98% |
100% |
|
03 |
Feb 23 to Mar 22 |
95.2% |
100% |
|
04 |
Mar 23 to Apr 19 |
95.8% |
100% |
|
05 |
Apr 20 to May 17 |
92.6% |
100% |
|
06 |
May 18 to Jun 14 |
96.9% |
100% |
|
07 |
Jun 15 to Jul 12 |
95.5% |
100% |
|
08 |
Jul 13 to Aug 09 |
93.3% |
100% |
|
09 |
Aug 10 to Sep 06 |
94.9% |
100% |
|
10 |
Sep 07 to Oct 04 |
96.3% |
100% |
|
11 |
Oct 05 to Nov 01 |
88.8% |
99.07% |
|
12 |
Nov 02 to Nov 29 |
80.2% |
99.69% |
|
13 |
Nov 30 to Dec 31 |
91.5% |
100% |
Galway to Dublin track performance results 2014 (Irish Rail 2017)
|
Period |
Dates |
Punctuality |
Reliability |
|
01 |
Jan 01 to Jan 26 |
95.2% |
99.83% |
|
02 |
Jan 27 to Feb 23 |
91.2% |
100% |
|
03 |
Feb 24 to Mar 23 |
94.3% |
100% |
|
04 |
Mar 24 to Apr 20 |
97.7% |
100% |
|
05 |
Apr 21 to May 18 |
96.1% |
100% |
|
06 |
May 19 to Jun 15 |
96.5% |
100% |
|
07 |
Jun 16 to Jul 13 |
94.3% |
100% |
|
08 |
Jul 14 to Aug 10 |
94.8% |
100% |
|
09** |
Aug 11 to Sep 07 |
98.6% |
100% |
|
10 |
Sep 08 to Oct 05 |
95.8% |
100% |
|
11 |
Oct 06 to Nov 02 |
90.4% |
100% |
|
12 |
Nov 03 to Nov 30 |
89.8% |
100% |
|
13 |
Dec 01 to Dec 28 |
96.6% |
99.71% |
(Irish Rail 2017)
Design of Experiment
In the undertaking of this project the design of the experiments (DoE) objective was to discover if the punctuality (Train Delay) of real time analysis meets the requirements set and if the tasks could be repeated would we get the same results or could the process be improved to achieve better results. In carrying out this experiment the topic choice untaken was to be of significant value to achieve the right information which in turn helps to design the experiment in the right manner otherwise this information could be mixed up with something else such as an observational study (Reilly 2017, pg 109). To differentiate from the above, a design of experiments was sets out to identify causes that may enable us to change the behaviour pattern and help improve the process.
In achieving my final results this experiment considered the effect of a factor (Time of Day) on an output response (Different times of the Day). Additionally this experiment placed emphasis on a number of different train times (factor levels) which were randomly selected beforehand consisting of Peak and None peak times during the week.
Hypothesis Testing
To get a true value one can only assume that what is being relayed by the company is accurate. This should not be taken as being accurate until otherwise proven but one can only assume that the null hypothesis is true. In order to get a true reflection in statistics the theory of testing is called the null hypothesis (H0). ‘Hypothesis’ is another word for ‘theory’, and it is ‘null’ because at the outset it is neither proven nor disproven (Reilly 2017, pg. 68).
In the task being carried out the objective is to prove or disprove that Irish rails punctuality clams mean is at 95% and to show how close or far from the 95% it is. Then you have to ask the question. ‘What is the probability of the data, assuming that the null hypothesis is true, this probability is called the p-value (Reilly 2017, pg. 68).Then using the standard α = 0.05 cut-off, the null hypothesis is rejected when p < .05 and not rejected when p > .05 also known as type one and two errors.
The Null Hypothesis being asked.
The null hypothesis (H0) Different times of the day does not affect the time of day. This means that all the factor levels according to the null hypothesis, that random variation is only present.
The alternative hypothesis (H1) Different times of the day does have effect on the time of day. This means that the factor does have an effect on the response and that some of the variation in the response is explained by the factor.
Single-Factor Experiments and ANOVA by software
For the purpose of this project, A single-factor experiment was to be carried out, which considered the effect of one factor on a response as stated prior. Furthermore, other factors that could affect the arrival time, such as accidents on bridges and extreme weather conditions, where kept constant during this experiment by applying the principles of experiment design.
Principles of Experimental Design in this case
Replication
To get a true measurement for each response three test was carried out for each factor level over two weeks. This then allows you to see how much random variationoccurs in the response even when the factor level remains the same, otherwise known as the “error variance” (Reilly 2017, pg 109). It must be noted that The term ‘error’ does not convey as a mistake in this instance but simply takes into account impacts that could affect the overall result such as environmental impacts along with other underling facts for example driver error, trains not leaving stations on time, other trains impacts and peak travel times. Furthermore, it also must be noted that the “learning effect” should have no effect on the over final results in this case.
The learning effects in this instance should not be correlated with random variation as this only amounts to unexplained variation and not with explained variation such as driver training which should be carried out under prior supervision in order to eliminate the learning effect.
Randomisation
In order to achieve a true reflection of the project in hand, the researcher projects logistics required the experiment to be performed in a random run and not that of fixed method. In order to achieve a fare random selection the researcher randomly picked days of the week Monday to Friday and every first to third day or second to fourth day simultaneously. This in turn allowed each train time on the track equal status over the project phase and not allowing any factor to be more prominent over another during the test regardless of the time permitted by the company Principles of Experimental Design in this case. The reason for this is that there may be some progressive change as stated prior addressing any concerns.
Blocking
Blocking was taken into account in this case but after the fact and not prior to the random section. This only became apparent to the researcher as the different days of the week could have an effect on the output response, as can be seen in the data below in some small part in this case. To get a true reflection of this the researcher would repeat the test again in a different blocking manner to see if the start of the week output response is greater than the end of the week over a longer period of time as the number of people travelling declines as the week progresses. This is one element of the test if repeated the researcher would look at in more detail.
Data Collected from Real- time Analysis
|
Different Time of Day (response) |
||||||
|
Time Of Day (Factor Levels) |
MON |
WED |
FRI |
MON |
WED |
FRI |
|
06:30 – 08:41 |
5 |
4 |
5 |
0 |
5 |
4 |
|
09:30 – 12:00 |
12 |
6 |
8 |
2 |
4 |
3 |
|
13:05 – 15:43 |
7 |
6 |
3 |
0 |
2 |
8 |
|
15:05 – 17:42 |
8 |
14 |
1 |
9 |
7 |
3 |
|
19:20 – 21:47 |
4 |
-2 |
8 |
16 |
4 |
1 |
RESULTS
Descriptive Statistics: Different time of the day
Variable Levels N N* Mean SE Mean StDev Minimum Q1 Median
Different time of the day 06:30 – 08:41 4 0 4.500 0.289 0.577 4.000 4.000 4.500
06:30 – 08:41 2 0 2.50 2.50 3.54 0.00 * 2.50
09:30- 12:00 2 0 7.00 5.00 7.07 2.00 * 7.00
09:30 – 12:00 4 0 5.25 1.11 2.22 3.00 3.25 5.00
13:05 – 15:43 6 0 4.33 1.28 3.14 0.00 1.50 4.50
15:05 – 17:42 4 0 5.25 1.93 3.86 1.00 1.50 5.50
15:05 -17:42 2 0 10.50 3.50 4.95 7.00 * 10.50
19:20 – 21:47 6 0 5.83 2.26 5.53 1.00 1.75 4.00
One-way ANOVA: Different time of the day versus factor Levels 4 in 1 overview
Method
Null hypothesis All means are equal
Alternative hypothesis At least one mean is different
Significance level α = 0.05
Equal variances were assumed for the analysis.
Factor Information
Factor Levels Values
Levels 8 06:30 – 08:41, 06:30 – 08:41, 09:30- 12:00, 09:30 – 12:00, 13:05 – 15:43,
15:05 – 17:42, 15:05 -17:42, 19:20 – 21:47
Model Summary
S R-sq R-sq(adj) R-sq(pred)
3.98672 19.61% 0.00% 0.00%
Means
Levels N Mean StDev 95% CI
06:30 – 08:41 4 4.500 0.577 (0.366, 8.634)
06:30 – 08:41 2 2.50 3.54 (-3.35, 8.35)
09:30- 12:00 2 7.00 7.07 ( 1.15, 12.85)
09:30 – 12:00 4 5.25 2.22 ( 1.12, 9.38)
13:05 – 15:43 6 4.33 3.14 ( 0.96, 7.71)
15:05 – 17:42 4 5.25 3.86 ( 1.12, 9.38)
15:05 -17:42 2 10.50 4.95 ( 4.65, 16.35)
19:20 – 21:47 6 5.83 5.53 ( 2.46, 9.21)
Pooled StDev = 3.98672
Regression Analysis
Analysis of Variance
In carrying out the Regression Analysis it is important to understand that the first hypothesis in regression formula is: (H0: β = 0) or more importantly it accounts for the P-Value (Levels) in this case. In addition the null hypothesis states that X is not a useful predictor of Y, or graphically Meaning the H0: β = 0 regression line is horizontal. Subsequently, If the null hypothesis is accepted, it may then indicate that there might be no predictive relationship at all between X and Y, and the analysis is over. But if this null hypothesis is rejected, it indicates that there is a predictive relationship between X and Y, and so it is useful to construct a regression equation for predicting values of Y. The second hypothesis is: H0: α = 0 is not accounted for in this case as there is no constant present in results as stated below (Reilly 2017, pg. 97).
Alternatively, If the null hypothesis is accepted, this means that the regression line may pass through the origin or that Y is directly proportional to X, so that any change in X would be matched by an identical percentage change in Y (Reilly 2017, pg. 98). Minitab by software output results as stated bellow.
Source DF Adj SS Adj MS F-Value P-Value
Levels 7 85.30 12.19 0.77 0.621
Error 22 349.67 15.89
Total 29 434.97
The p-value for levels is 0.621, which is less than 5%, so we reject the hypothesis that the regression line is horizontal in this case.
One-way ANOVA individual Observational Data
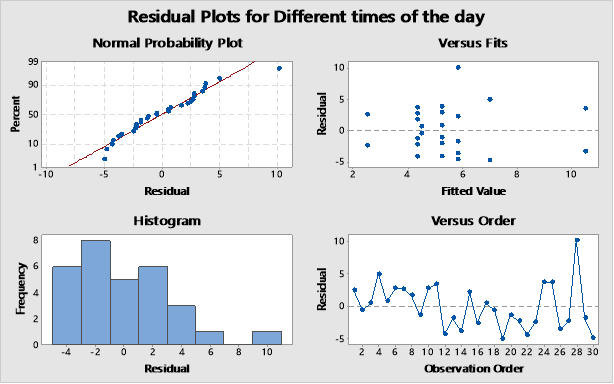
Residuals vs Fits for Different time of the day
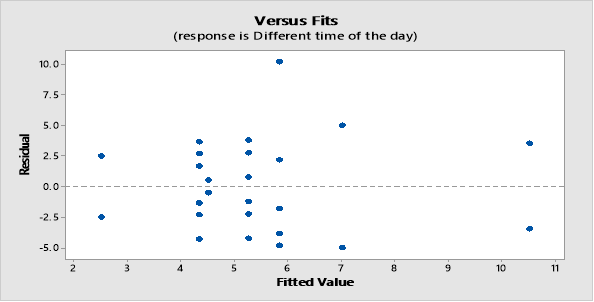
In this case you can notice that on-peak times have consistently lower scores than the other train times. You also notice that the x-axis marks are unequally spaced. The length between the ticks is proportional to the number of scores (observations) for each arrival time
The following observations Noted:
- The lines near the centre of each line represent the arrival mean. At a glance, you can see that the mean for each arrival looks significantly different.
- The vertical span of each line represents the 95% confidence interval for the mean of each arrival.
Additional Observational Data
Normal plot of Residuals for Different time of the day
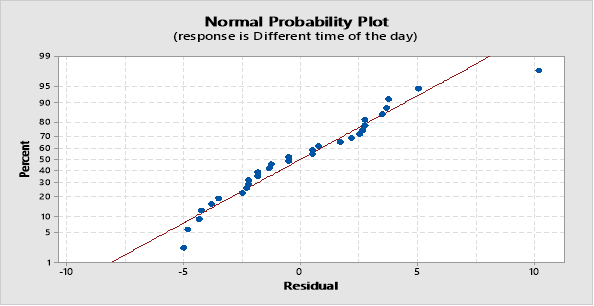
In this case the plot above indicates that the arrival times are reasonably normal. There is some scatter with one outlier; however the points are roughly speaking linear in this instance.
Residual Histogram for Different time of the day
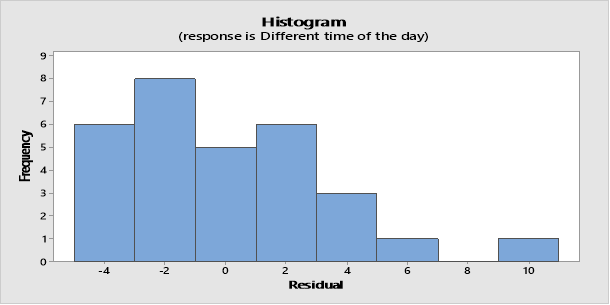
In this case the result shows that the data are positively skewed (To The right). This means that the trains delay times might be much longer than expected, but could not be much earlier than expected, because the train cannot leave the last station prior to its scheduled time.
Residuals vs Order for Different time of the day
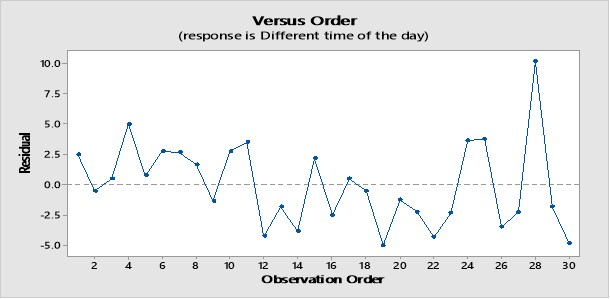
In this case the time series plot shows a spike, this shows where there was a late arrival outside the expected arrival time before returning to expected level again. This correlates with outlier in the additional data stated above.
Conclusion
References
http://www.irishrail.ie/about-us/train-performance
Cite This Work
To export a reference to this article please select a referencing stye below:
Related Services
View all


DMCA / Removal Request
If you are the original writer of this essay and no longer wish to have your work published on UKEssays.com then please click the following link to email our support team:
Request essay removal