Statistical Analysis of Cricket Matches
| ✅ Paper Type: Free Essay | ✅ Subject: Statistics |
| ✅ Wordcount: 3431 words | ✅ Published: 07 Sep 2017 |
Abstract
The effect of playing “home” or “away” and many other factors, such as batting first or second, winning or losing the toss, have been hypothesised as influencing the outcome of major cricket matches. Anecdotally, it has often been noted that Subcontinental sides (India, Pakistan, Sri Lanka and Bangladesh) tend to perform much better on the Subcontinent than away from it. In 2009, Joshi published an article in the Royal Meteorological Society Journal Weather which suggested that the prevailing weather conditions were more important to the results of the Ashes test series in Australia than were the relative strengths of the teams.
In this paper, focusing on results of men’s One Day International (ODI) matches involving England, I investigate the extent to which a number of factors – including playing home or away (or the continent of the venue), batting or fielding first, winning or losing the toss, the mean temperature and humidity during the game, the condition of the pitch, and the strength of each team’s top batting and bowling resources – influence the outcome of matches. I employ a variety of Statistical techniques, and conclude that the continent of the venue does appear to be a major factor affecting the result, but winning the toss does not. In the second part of this study, I will use any significant factors to attempt to build a Binary Logistic Regression Model that will predict the chance of England winning at different stages of a game. The study also looks at using this model to consider different gambling techniques to see which would have created the most profit for past games.
- Introduction
1.1 Understanding the Basics of ODI’s
A One-Day International (ODI) is a game of cricket between two International teams. The team that wins a coin toss has the choice to either bat or bowl in the first innings. The team batting first have a maximum of 50 overs or 10 wickets to score as many runs as they can, this is more commonly known as setting a total. An over consists of 6 balls from one bowler and the following over must be 6 balls from a different bowler from the opposite end of the pitch. Each bowler is allowed a maximum of 10 overs each. The first innings will be complete when either all 300 legitimate deliveries have been bowled or all 10 wickets have been lost. The team batting second then have 50 overs and 10 wickets to score more runs than their opponents, this is referred to as chasing a total.
1.2 History of cricket formats
Cricket has been a game played in England for hundreds of years, and it is believed that it may date back to 1500. However, the earliest records available are from the early 17th century. There are currently 3 popular formats of the sport played at International level and below. The longest format of the game is either called a ‘Test Match’ in International cricket or a ‘first-class match’ in domestic cricket. Test matches are played between two nations which have reached ‘Test status’. This is determined by the International Cricket Council (ICC). In a test match, both teams have two innings each to accumulate more runs than their opponents. Test matches have a maximum time allowance of 5 days, if the result of the game is not already decided at the end of day 5, then the match ends as a draw. Throughout history, there have been games that have lasted more than 5 days, however in recent years this has been a strict guideline. The most famous case of an extended test match was when England toured South Africa in 1939; the game was extended to the 9th day to produce a result, however when England required only 41 more runs to win, the England players had to leave the ground to catch the last ferry home and the match ended in a draw. (sahistory, 2014) First-class is a term that describes the highest level of domestic cricket played within each of the cricketing nations. Each nation has a first-class competition which must also consist of two innings each and last at least 3-days. In England, first-class cricket is a 4-day competition played between 18 counties. This was the only format of the game throughout the 17th, 18th and 19th centuries. County cricket is where all England cricketers develop their game, and Moores and Tickner (2016) say that “The key to improvement is not to radically overhaul our county system. It is to embrace it.” This is regarding ongoing controversy towards the argument that the English county system is at fault for England’s failures. A 2015 article written by Kevin Pietersen entitled “Broken county system is damaging our national side” is a key example of this, where Pietersen argues that “bowlers aren’t quick enough” and “too much cricket makes county players fatigued”. However, Moores and Tickner are stating that there are many talented cricketers in the county circuit, who are overlooked due to their lack of international experience, and the only way for them to gain experience is to be given a chance. They argue that the blame for England’s failures often comes through not using the top county cricketers, rather than the county system itself.
The first ever official Test match was in 1877, when England narrowly lost to Australia at the Melbourne cricket ground. Then 5 years later, when England lost to Australia at home, The Sporting Times printed “a mock obituary of English cricket which concluded that “The body will be cremated and the ashes taken to Australia.” (Lords, 2016). This was the start of the infamous Ashes series that is still contested today between the 2 nations.
Limited Overs cricket was first introduced in 1951 in a small town in Kerala, India. KV Kellappan Thampuran formed the Tripunithura Cricket club before coming up with the idea of playing a one-day game. (Kerala Cricket Association, 2016). It was adopted into County Cricket in England in 1962 when the “Midlands knock-out cup” took place between Northamptonshire, Leicestershire, Derbyshire and Nottingham and was 65 overs per side. In 1969, there was a change in the law which allowed “more sporting events to take place on a Sunday.” (Miller and Tickner, 2016). This was an opening for Sunday League cricket, where counties would play a limited overs game on the Sunday following a first-class match in the week. The number of overs per side have since been reduced to 60, 50, 45 and 40. (BBC cricket, 2006).
The first ODI was played on 5 January 1971 when the first 3 days of a test match between Australia and England were washed out, so a one-off 1-day game consisting of 40 8-ball overs was arranged. This game was played with white kits and a red ball. Soon after this, ODI cricket caught on and became increasingly popular towards the end of the 1970’s, the World Series Cricket was organised and the 1979 season saw the start of coloured kits with a white ball and 50 6-ball overs in ODI’s. This was an unpopular decision at the time as it was only done to fit in more advert breaks. (Jackson, 2014). However, these advert breaks allowed more money to come into the game to be spent on, not only player development, but player’s wages to make cricket a more appealing profession. Until these advert breaks came in, most cricketers would be working two jobs and now that cricket could be their main priority, there was a big increase in terms of fitness, technique and overall development of the game.
ODI’s have changed a lot since the 1970’s; there are now fielding restrictions, powerplays and other factors that have led to scores increasing within 50 overs. In the 1980’s a score of 250 in 60 overs was thought of as a good total, but whilst this study is taking place, in 2017, teams are looking to set a total of 300 in most matches. Below is a table taken from howstat.com showing the top 20 ODI scores in history.
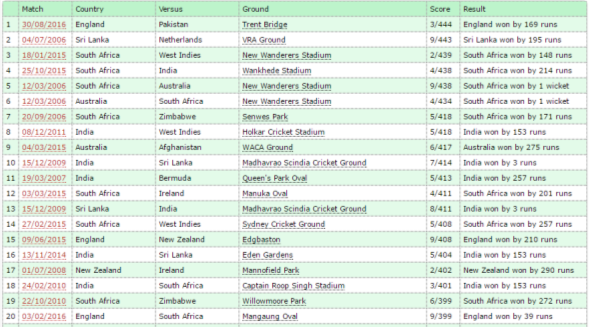
Table: Top 20 ODI team totals. Taken from howstat.com
Here you can see that all the top 20 scores have been in the last 11 years, even though ODI’s have been around for 46 years and ODI’s in the 20th Century were often 55 or 60 overs. For this reason, when I investigate factors that influence the chance of England winning an ODI, I only take data from the 21st Century as I believe the statistics from earlier ODI’s are almost irrelevant to today’s game.
Twenty20 (T20) cricket is the newest cricket format. Each side has just 20 overs each to score more runs than their opponents. However, the number of resources (wickets) stays the same, allowing for a more attacking style of play throughout the whole game since losing wickets is not as harmful to the team. “The cricketing authorities were looking to boost the game’s popularity with the younger generation in response to dwindling crowds and reduced sponsorship.” (Cricketnext, 2009).
1.3 Why ODI’s?
There are several reasons I have chosen to use ODI statistics rather than Test matches or T20s. The overall aim of the study is not only to find significant factors that influence the outcome of cricket matches, but also to use these factors to be able to predict the chance of England winning a game. I believe that Test matches end in a draw too often to build a win predictor, and Frank Duckworth (2001) said “one of the great weaknesses of first class cricket is that the most usual result is a draw. This doesn’t mean that the two sides have performed equally, but that the game was unfinished when time ran out.” Through collecting data from cricinfo.com and taking the means of draws per country in test match history tells us that there is a 32.07% chance that a Test match will end in a draw. This could be due to defensive tactics as the game lasts much longer than other forms of cricket. Bad weather conditions can also take a whole day or more out of the match and this coupled with the more defensive style can make it harder to get a result. From the first ODI game up until the 19th July 2016, 33 out of 3764 games resulted in a tie, meaning that less than 1% (0.87%) of matches have been tied. This is clearly a much lower percentage than in test matches. Also, when an ODI produces this result, it is usually because the game deserves to be a tie as the two sides have performed equally rather than any other factors. The less ties result will allow me to build a win predictor more accurately.
T20 is a relatively new format of cricket where teams go away from typical tactics and playing ‘proper’ cricket shots and instead use a ‘hit out or get out’ style of play. This means that it is much harder to predict who will win a T20 game as one good individual performance can all but win the game. For example, if one batsman scored 100 in a T20 match, even if the rest of the team only gained another 30 runs, a total of 130 could still win the game. Comparatively, in ODI’s much more of a team effort is required, and a sustained performance is needed to win the game. There are also not as many patterns in T20 games, as usually, the whole 20 overs are spent attacking. Whereas ODI’s require defence, patience, tactical field settings and tactical batting in terms of when to ‘up the run rate’. In an ODI series usually the ‘better’ or higher ranked team will come out on top. However, in T20 matches this is much more unpredictable, and countries such as Afghanistan and the Netherlands have had success in T20 format, despite the latter not being in the 2017 ICC ODI rankings (ICC 2017).
1.4 D/L Method
One issue which has always been present in cricket is that bad weather conditions, especially rain, will often affect games, especially in limited overs cricket. For the first 30 minutes of delay there are no overs lost, then every 5 minutes after this there is 1 over lost per side. For an ODI to be completed there must be at least 20 overs per side played. There is usually no reserve day for a game that ends as a no result, due to tight scheduling. To minimalise the impact of weather factors that cannot be controlled, the Duckworth-Lewis (D/L) method is used to calculate the target scored for the team batting second where the rain has interrupted the game. It is a mathematical formulation that takes in to consideration how many overs and wickets remain so the game has a higher chance of ending in a result. “The fundamental basis of the Duckworth/Lewis (D/L) method is that we do not correct the target by the proportion of overs lost, but by the proportion of the total run-scoring resources lost.” (Duckworth 2001)
There have been many previous attempts at creating a system to set a total so that games can be completed, including the average run rate (ARR) method and the most productive overs (MPO) method. The average run rate method was used to set a total, and it did this by taking the average number of runs scored per over x the reduced innings. The problem with ARR is that it is too simplistic, and gave an unfair advantage to the team batting second if there was rain. The most productive overs method was introduced by the Australians and it set the target to chase by reducing the total based on the number of runs scored in the most productive overs. However, this did not take in to account when the overs were lost and could result in a very unfair target. (Duckworth and Lewis 2012)
As an aside, a way to solve the problems of weather affected matches could be coming in the form of indoor cricket. The first indoor match to be played was an ODI between Australia and South Africa on the 16th August 2000 (Ramaraj 2013). However, this has not caught on around the world despite the promise of a full days play. Jonty Rhodes (Grunill and Lillywhite 2005), a South Africa player in the game, said there were problems to overcome, namely the fact that players were looking up at the lights even when the ball was at head height as the lighting was not on pylons.
1.5 Initial Variables
- Winning the Toss
The coin toss is contested between the home and away captain 30 minutes prior to the first ball being bowled. The captains will go out onto the pitch and before contesting the toss they will assess the conditions to help them make their choice of batting or bowling first. Some of the conditions they consider are also variables I have looked at in this study. In the 17th century it is believed that the winning captain also got to choose which pitch was used for the game, a job that is now left to the umpires.
Hypothesis 1: Winning the toss will significantly increase the chance of winning an ODI.
- Batting or bowling first
Upon winning the toss, the captain is left with the strategic decision between batting first or second. “Some people believe that a team should bat first and produce a psychological hurdle for the second team to overcome. Other people believe that there is an advantage in batting second as the score required has already been produced.” (de Silva and Swartz, 1998). Some people also believe that it is best to look at several factors before making the choice of batting or bowling first.
Hypothesis 2: There will be no significant increase in the chance of winning an ODI by always batting or bowling first.
- Home or Away
Home team advantage is believed to be a significant factor in most, if not all sports. In a 2008 study Measurement and Interpretation of Home Advantage, Stefani says that the biggest factors believed to lead to home team advantage are travel fatigue, home team spectator support and home team familiarity. In ODI cricket, travel fatigue should not be too much of a factor as teams will usually arrive at the opposition country a week or 2 before the series. Morley and Thomas (2005) find that attendance figures at English cricket matches do not give any significant advantage to the home team. They do however state that in certain venues this may not be the case. This leaves us with home team familiarity, and I believe this factor weighs heavily in the outcome of ODI matches.
The average score at a ground in England can be very different from a ground in another continent. For example, the average run rate in ODI’s at the Kia Oval in London, United Kingdom is 4.84 and the average run rate in Lahore, Pakistan is 5.24. (howstat, 2017). Both grounds have been hosting ODI’s since the 1970’s. This means that teams must change their mindset about what is a ‘good 1st innings total’ when they play away from home. Weather conditions and cricket pitches also vary in different countries and continents. There are 9 official test teams in the ICC rankings and each of these countries has a usual ‘type’ of pitch.
The term ‘dead pitch’ is used to describe pitches that are flat and offer little help for bowlers. Dead pitches are “the most common wickets that are prepared these days…. the most common pitch type in ODI’s.” (cricketequipmentusa, 2017). These pitches are often found in Australia, South Africa and the West Indies. English pitches are usually encouraging for fast bowlers; pitches are often referred to as ‘green tops’. These pitches are also found in New Zealand and sometimes South Africa, they have a thin layer of grass which helps to produce swing and seam. Overcast and windy conditions are often present in England, which can correspondingly assist the ball to swing. Pitches on the subcontinent are often the opposite, where wickets are dry and dusty. The subcontinent is a term used to describe a large part of Asia, and includes the 4 big cricketing nations; India, Pakistan, Sri Lanka and Bangladesh. The lack of rain in the subcontinent means no green on the pitches and the dryness creates a lot of spin and uneven bounce. This is undoubtedly the reason why subcontinent teams have produced some of the best spin bowlers and why teams like England seem to struggle when playing away there.
Hypothesis 3: England perform significantly better at home than anywhere else.
Hypothesis 4: England perform significantly worse in the subcontinent than anywhere else.
The first section of my study will test the variables mentioned above using a three-way ANOVA table. I test for statistical significance (<0.05) of the variables in relation to the winning or losing margin of victory. Instead of simply “home” or “away” I have split this variable into 3 categorical, independent groups; “home”, “rest of the world” and “subcontinent”. My reason for this is to firstly test whether England are significantly better at “home” or “away”. Secondly I want to investigate if playing on the subcontinent, specifically, downgrades England’s chance of winning.
After finding that playing in the subcontinent does significantly decrease England’s chance of winning, I investigate matches between England and subcontinental sides and look at some of the factors that I believe may cause this decrease. These factors include the number of wickets falling to spin bowlers on a certain pitch and the average temperature and humidity on the day of play. Joshi found in 2009 that England have a much better chance of winning an Ashes series in Australia when it is a La Niña year compared to an El Niño year. I wanted to see if I could generalize this and test whether hot and dry conditions significantly affect the outcome of England matches. To do this I put these factors into a Binary Logistic Regression Model, and calculate log odds of each variable to see the significance of each. I also look at whether the top 3 batsmen and top 3 bowlers from each team (per ICC player rankings) prior to the game, can help you predict the outcome of the game. After I have found the significance of these variables, I look at different stages of past games and compare scores between teams to try and find the best time in the 2nd innings to place an “in-play” bet in an ODI.
Now that I have an optimal regression model, the final part of my study looks at past and present games to see whether my model is accurate enough to make a profit from a pot of £100. I compare various betting techniques including Kelly’s criterion, and test to find which would have been the most successful method.
Cite This Work
To export a reference to this article please select a referencing stye below:
Related Services
View all


DMCA / Removal Request
If you are the original writer of this essay and no longer wish to have your work published on UKEssays.com then please click the following link to email our support team:
Request essay removal