Trueness and Precision of Die Spacer Thickness of Zirconia Single Crown
| ✅ Paper Type: Free Essay | ✅ Subject: Sciences |
| ✅ Wordcount: 3328 words | ✅ Published: 23 Sep 2019 |
Trueness and precision of die spacer thickness of zirconia single crown made by CAD/CAM milling technology
ABSTRACT
Statement of Problem. There is an inability to control die spacer thickness, which has been reported in the literature. In addition, information on the congruency between the computer aided design parameters for die spacer thickness and milling technology is lacking.
Purpose. The purpose of this study was t investigate both the truness and the precision of die spacer thicknesses achieved by using both computer aided design as well as milling technology.
Material and Methods. An ivorine maxillary central incisor tooth was prepared for an all-ceramic crown. Digital impressions were performed with a chair side intraoral scanner and crowns were fabricated by CAD/CAM technology. For the milled crowns, the die spacer setting was divided into 5 groups with the thicknesses of 25 µm, 45 µm, 65 µm, 85 µm, and 105 µm. A total of 25 zirconia milled crowns were fabricated (n=5/group). The zirconia milled crowns and dentoform tooth were digitized with a structured light scanner and saved in STL format. All STL records were superimposed by a modified best-fit method to achieve a best object-to-object penetration. The internal surfaces of the milled crowns were compared to the reference tooth for trueness and precision by quantitative (RMS in µm) and qualitative (color-coded images) data analysis. A one-way analysis of variance (ANOVA) was conducted to assess the overall statistical significance of differences among groups at a significance level of α = .05. Tukey’s HSD test was used for post-hoc multiple comparisons. Linear regression analysis was also performed to evaluate the relationship between programmed die spacer thickness and measured die spacer thickness. Coefficient of variation was used to determine the precision for each group.
Results. The mean values of the trueness, expressed in terms of the RMS as differences between the internal surface of the milled crown and the reference surface (standard deviation), were 32.6 µm (4.9 µm) for the 25 µm group, 36.8 µm (13.5 µm) for the 45 µm group, 45.6µm (5.6 µm) for the 65 µm group, 46.8µm (6.1µm) for the 85µm group, and 66.8µm (3.1µ) for the 105µm group. For the trueness evaluation, statistically significant differences were found for all the groups. For the precision evaluation, all groups showed low precision except the group of 105 µm.
Conclusions. Within the limitation of the study, CAD/CAM milled zirconia crowns with a 25µm die spacer setting appeared high in trueness. The group of 105 µm indicated the highest precision compared with other groups.
CLINICAL IMPLICATIONS
The incongruence between the CAD program setting and actual milling will negatively affect the clinical fit of the definitive dental prostheses.
INTRODUCTION
In order to allow space for the luting agent between the fixed restoration and the prepared tooth, clearance is needed. One of the most popular methods to accomplish this is to apply paint-on die spacer before waxing. Die spacers have been used as a popular method for providing internal space for a number of years.1-4
Previous literature has shown that the use of die spacers improves marginal fit between the restoration and the tooth preparation and decreases the risk for plaque accumulation and recurrent caries.5 In addition, the thickness of the die spacer affects the fracture strength of a ceramic restoration, as well as its retention and marginal gap.6, 7 One study showed that ceramic crowns showed a higher fracture strength when the mean internal gap was less than 73 µm, while a lower fracture strength was indicated when the mean internal gap was greater than 122 µm at the axial wall.6 Interestingly, the literature is inconclusive with regards to the influence of die spacer thickness and retention. Eames and colleagues7 used an experimental design involving extracted human teeth and fabricated crowns by using a technique that closely resembled clinical and laboratory procedures in order to improve the seating of castings. Their findings showed that casting which had four layers of die spacer were 25% more retentive than similar crowns, which did not have spacer applied. However, Hembree and Cooper8 designed a study to investigate the effect of die spacer thickness on the retention of cast crowns and inlays. Their results showed that there was no statistical significance between crowns made with or without four layers of die spacer after cementation with three different cements. Vermilyea et al9 also investigated the effect of die spacer relief on retention of full coverage crowns cemented onto extracted human molars. They noted that there was a 32% decrease in retention of gold copings constructed on dies which were coated with two layers of 20-25 µm layers of die spacer, compared with the copings constructed on dies with no spacer after cementing with zinc phosphate cement. Despite these findings, Marker et al10 found that 55% of castings constructed on dies coated with four layers of spacer showed an increase in retention over unspaced copings. There is more regularity in the literature when assessing the effect of die spacer thickness on marginal gap.1, 11, 12 Grajower et al1 noted that the magnitude of marginal gap without die spacer was 649 µm. This gap was significantly improved from 479 µm to 38 µm as the die spacer thickness was increased from a single layer to eight layers.1, 7, 11
Even though there has been another problem related with inconsistency of the ideal die spacer thickness, 4, 11, 13, 14 the most difficulty is there is still an inability to control die spacer thickness by the manual application method. Computer-aided design (CAD) technology allows for virtual design of restorations and programming of die thickness. The virtually created coping can be produced by milling and 3D printing. Internal gaps obtained from CAD/milling technology have been investigated by a number of authors.15-17 Hoang et al 18 investigated the die spacer thickness reproduction by CAD and 3D printing technology with resin printed copings. The copings were cemented onto their respective dies and the internal gap was measured at five different locations after the die was sectioned. The study showed the inability of the 3D printer to reproduce a uniform internal gap for all samples within the assigned group.
However, little information is available on the congruency between the computer aided design parameters for die spacer thickness and milling technology. The purpose of this study was to evaluate trueness and precision of the die spacer thickness achieved by the combination of CAD and milling. The primary objective of the research was to test the accuracy of CAD/milling by comparing various measured internal gap thicknesses with the prescribed values of 25 µm, 45 µm, 65 µm, 85 µm, and 105 µm. Trueness was defined as the closeness of the internal surface of the milled crowns to the reference dies spacer thicknesses.18 Trueness was quantitatively evaluated by the root mean square (RMS) and the resulting internal gap thicknesses were compared to the reference values. The secondary objective of the research was to measure the precision, the milling’s ability to reproduce the same die space thickness within an assigned group. Precision was defined as the ability of the CAD/milling combination to reproduce the same die spacer thickness for each of the samples in the assigned group by using the coefficient of variation (CV). Using the CV, 10% has been widely accepted as the cutoff to define high precision.18-20
The trueness null hypothesis was that there was no overall difference between the CAD/milling achieved internal gap thicknesses and the programmed die spacer thicknesses. The precision null hypothesis was that there was no difference in the reproducibility of the milling machine among varying die spacer thicknesses.
MATERIAL AND METHODS
An ivorine maxillary central incisor (T1560; Columbia Dentoform Corp) was prepared for an all ceramic crown. Then, a digital impression technique was performed with an intra-oral scanner (Lava Chairside Oral Scanner; 3M ESPE). Without making physical casts, the scanned data was transferred to a commercial dental laboratory in order to fabricate CAD/milled crowns. For the milled crowns, the die spacer setting was divided into 5 groups with the thicknesses of 25 µm, 45 µm, 65 µm, 85 µm, and 105 µm. A total of 25 zirconia milled crowns were fabricated (n=5/group). The zirconia milled crowns and dentoform teeth were digitized by a light scanner developed by the Fraunhofer Institute for Applied Optics and Precision Engineering IOF (Flex 3A; Otto Vision Technology GmbH). The scanner featured a measurement-uncertainty of <5 µm and a homogenous measuring-point-distance of 5 µm (data according to manufacturer) and saved in stereolithography (STL) format. All STL records were superimposed by using a modified best-fit method. The internal surfaces of the milled crowns and the prepared surfaces of the dentoform tooth were compared for accuracy and precision (Qualify 12; Geomagic GmbH). A recently introduced method allows the quantitative and qualitative three-dimensional analysis of dental materials, including restorations, impressions, or casts.21 Dimensional differences between both crowns and the reference tooth were computed. The mean deviation root mean square (RMS) of the virtual reference object (prepared tooth) in comparison to the test objects (crowns) was used to estimate the congruency of two superimposed records by the following formula 21
 , where x1,i is measuring point i on reference, x2,i is measuring point i on duplicate, and n is total number of measuring points per specimen. Means (RMS), standard deviations, and 95%-confidence intervals were calculated for marginal and internal discrepancies. Levene’s test was performed to verify departures from basic assumptions about equal variances. A one-way analysis of variance (ANOVA) was conducted to assess the overall statistical significance of differences among groups. Precision was calculated by using the CV= SD/mean x 100% to determine how reliable the CAD/milling technology was in producing the same die spacer thickness for every sample in a group. Tukey’s HSD test was used for post-hoc multiple comparisons. Linear regression analysis was also performed to evaluate the relationship between programmed die spacer thickness and measured die spacer thickness. All statistical analyses were performed in SAS (SAS 9.3; SAS Institute Inc.) A sample size calculation by recently published data resulted in a sample size per group of n = 5.21
RESULTS
The result of Levene’s test showed that the data did not violate the assumption of equal variances (P=0.183). Table 1 shows the results of ANOVA and Tukey’s HSD test. The values of mean (standard deviation) of accuracy for each group were 32.6 µm (4.9 µm) for the 25 µm group, 36.8 µm (13.5 µm) for the 45µm group, 45.6 µm (5.6 µm) for the 65 µm group, 46.8 µm (6.1 µm) for the 85 µm group, and 66.8 µm (3.1 µm) for the 105 µm group. For the accuracy evaluation, there were statistically significant differences (P<.001). In terms of mean difference (standard deviation), the 25 µm group showed significantly higher accuracy (mean 7.6 ± 4.93 µm) than other groups.
Table 1 also demonstrates the CV values for all 5 groups. The CV expressed in percentages ranged from 4.67 – 36.78%. For the precision evaluation, all groups showed low precision except the group of 105 µm (4.67%). This means the die spacer setting of 105 µm can reproduce constant die space. However, other setting values of die spacer thickness cannot reproduce the consistent space whenever the restoration is milled. The 45 µm group indicated the lowest precision (36.78%).
For qualitative evaluation, color-coded difference images were compared (Fig. 1), where yellow-red indicates contact areas and blue indicates gaps. The 65 µm group demonstrated the most balanced distribution followed by the 85 µm group, However the 25 µm group showed larger inner spaces.
DISCUSSION
The primary purpose of this study was to evaluate trueness and precision of the die spacer thickness achieved by the combination of CAD and milling. The overall statistical analyses rejected the accuracy null hypothesis of no difference for the groups of 25 µm, 45 µm, 65 µm, and 105 µm that were assessed. This study demonstrated that the programmed die spacer thickness values differed from the measured internal gaps of all groups. The CAD/milling system was unable to produce the same die spacer thickness for all groups. However, the 25 µm die spacer group demonstrated the highest trueness among the groups.
Many authors have previously studied the average internal gaps obtained from CAD/milled crown. Moldovan et al investigated the internal gap of zirconia copings made by CAD/Cercon and CAD/Cerec technologies.15 The programmed die spacer thickness for CAD/Cercon was 10 – 20 µm and CAD/Cerec was -100 µm; the mean values of the internal gaps obtained were 100 – 130 µm and 60 -70 µm, respectively.Kokubo et al investigatedthe internal gaps of In-Ceram crowns made by CAD/milling technology ranged from 165.9 – 200.3 µm which were 3 – 4× greater than the programmed die spacer thickness (50 µm).16 Several studies regarding CAD/printing technology and internal gap exist within the literature. Bhaskaran et al reported on the marginal and internal gap of Co-Cr copings cast from 3D printed resin patterns to be 27.22 µm and 36.15 µm.17 Hoang et al showed the average internal gaps was 75 µm, which was 3× greater than the programmed die spacer thickness value (25 µm). In this present study, the average of internal gaps of CAD/milled zirconia crowns ranged 32.6 – 66.8 µm, which indicated much smaller internal gaps were produced in comparison with previous studies.
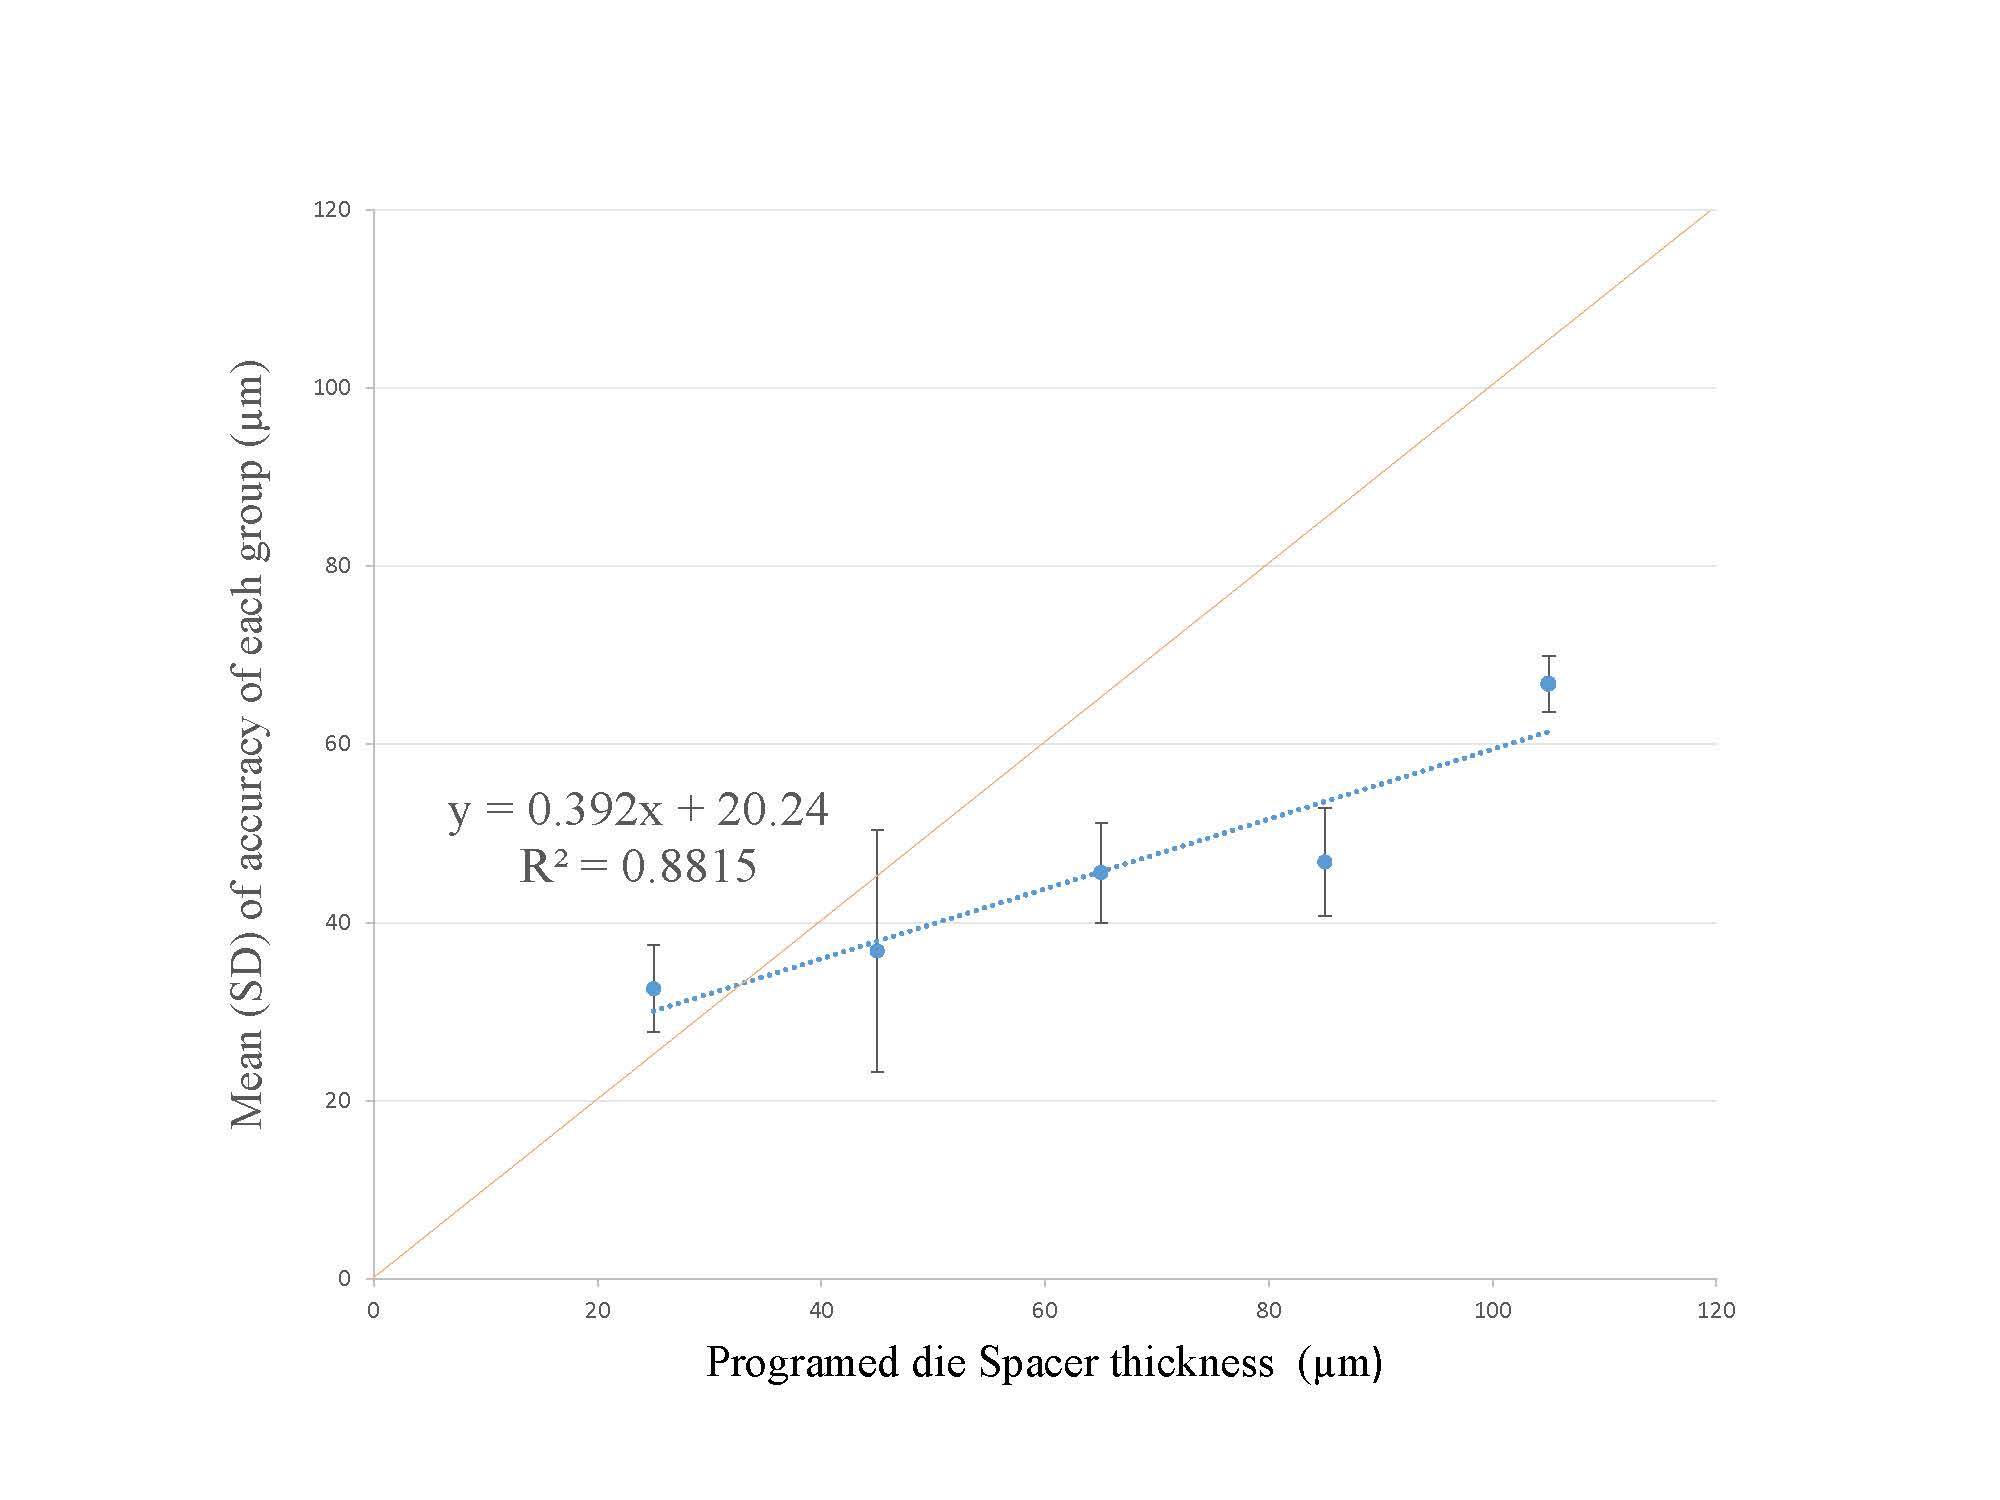
Figure 2 demonstrates the relationship between the programmed die spacer setting and measured internal gap (accuracy) of each group. It also shows the trend line equation (y=0.392x+20.24), which indicates, at a setting of no die spacer thickness (x = 0 µm) in the CAD system, a 20 µm internal gap would be produced. In addition, the trend line indicates that the value of the internal gap looks skewed down with the setting of die spacer thickness increasing. If 25 µm (y = 25) is intended to produce the internal gap, 12 µm of die spacer setting should be programmed based on the trend line. In addition, the graph indicates the average values of measured internal gap skewed down. It means that 25 µm group showed that actual measured value (32.6 µm) of the internal gap was greater than 25 µm, while 45 µm group showed that actual measured value (36.8 µm) of the internal gap was smaller than 45 µm. The graph shows the actual internal gap will become less than programmed setting value over the point of around 30 µm.
From the qualitative analysis (Fig. 1), it can be concluded that the 25 µm die spacer setting resulted in a non-fitting crown. The dark blue area which represents an internal gap of more than 100 µm at the cusp suggests that the crowns were not completely seated. In the settings 45 µm and greater, the contact area (yellowish colors) increases which may correlate with better fitting of the respective crowns.
Precision, expressed as CV in percentage, was used to determine the reproducibility of the internal gaps. A large CV value indicates low precision. Since a precision value less than 10% is considered reasonable,19 the precision of the CAD/milling combination used in this study was low except the group of 105 µm. The precision null hypothesis was rejected for all the groups except the group of 105 µm. Hoang et al18 explored the precision of CAD/printing combination; the precision (CV) for all printed resin copings was within the range 14 – 33%, which relates to a low precision. In addition, Campagni et al4 reported on the precision of manual application of die spacer material; the CV ranged from 25.6 – 53.2% for 6 layers and 2 layers, respectively. In the present study, the precision for all groups were within the range 4 – 36%, which can be compatible with CAD/printing method and manual method.
There are several limitations of this research with respect to measurement, materials, and technology used. Errors may have occurred in any step of the process chain beginning with the lab scanning and milling process. In addition, it is prudent to understand that the measurements obtained were specific to this software/hardware combination (CAD and milling). The results may not be applicable to other software/hardware combinations. Thus, further studies will be needed to investigate the accuracy and precision for other comparative technologies. In the future, we predict that there will be further advancement in technologies with improved accuracy for both the scanning and printing systems.
CONCLUSIONS
Within the limitation of the study, for the trueness evaluation, the programmed die space thickness of CAD/ milled zirconia crown showed statistically significant and different values from the measured internal gaps of the all groups. Among the 5 groups, CAD/ milled zirconia crowns with a 25 µm die spacer setting appeared highest in trueness. For the precision assessment, the coefficient of variation (CV) was above 10% for all groups except the 105 µm group, indicating the milling’s inability to reproduce the uniform internal gap within the same group.
REFRENCES
- Grajower R, Zuberi Y, Lewinstein I. Improving the fit of crowns with die spacers. J Prosthet Dent 1989;61:555-63.
- Passon C, Lambert R, Lambert R, Newman S. The effect of multiple layers of die-spacer on crown retention. Oper Dent 1992;17:42-9.
- Gegauff AG, Rosenstiel SF. Reassessment of die-spacer with dynamic loading during cementation. J Prosthet Dent 1989;61:655-8.
- Campagni W, Preston J, Reisbick M. Measurement of paint-on die spacers used for casting relief. J Prosthet Dent 1982;47:606-11.
- Psillakis JJ, McAlarney ME, Wright RF, Urquiola J. Effect of evaporation and mixing technique on die spacer thickness: a preliminary study. J Prosthet Dent 2001;85:82-7.
- Tuntiprawon M, Wilson PR. The effect of cement thickness on the fracture strength of all‐ceramic crowns. Aus Dent J 1995;40:17-21.
- Eames WB, O’Neal SJ, Monteiro J, Miller C, Roan JD, Cohen KS. Techniques to improve the seating of castings. J Am Dent Assoc 1978;96:432-7.
- Hembree Jr J, Cooper Jr E. Effect of die relief on retention of cast crowns and inlays. Oper Dent 1979;4:104.
- Vermilyea SG, Kuffler MJ, Huget EF. The effects of die relief agent on the retention of full coverage castings. J Prosthet Dent 1983;50:207-10.
- Marker VA, Miller AW, Miller BH, Swepston JH. Factors affecting the retention and fit of gold castings. J Prosthet Dent 1987;57:425-30.
- Carter SM, Wilson PR. The effect of die-spacing on crown retention. Int J Prosthodont 1996;9;21-9.
- Wang C-J, Millstein PL, Nathanson D. Effects of cement, cement space, marginal design, seating aid materials, and seating force on crown cementation. J Prosthet Dent 1992;67:786-90.
- Hollenback GM. Precision gold inlays made by a simple technic. J Am Dent Assoc 1943;30:99-109.
- Campbell SD. Comparison of conventional paint-on die spacers and those used with the all-ceramic restorations. J Prosthet Dent 1990;63:151-5.
- Moldovan O, Luthardt RG, Corcodel N, Rudolph H. Three-dimensional fit of CAD/CAM-made zirconia copings. Dent Mater 2011;27:1273-8.
- Kokubo Y, Nagayama Y, Tsumita M, Ohkubo C, Fukushima S, Steyern P. Clinical marginal and internal gaps of In‐Ceram crowns fabricated using the GN‐I system. J Oral Rehabil 2005;32:753-8.
- Bhaskaran E, Azhagarasan N, Miglani S, Ilango T, Krishna GP, Gajapathi B. Comparative Evaluation of Marginal and Internal Gap of Co–Cr Copings Fabricated from Conventional Wax Pattern, 3D Printed Resin Pattern and DMLS Tech: An In Vitro Study. J Indian Prosthodont Soc 2013;13:189-95.
- Hoang LN, Thompson GA, Cho S-H, Berzins DW, Ahn KW. Die spacer thickness reproduction for central incisor crown fabrication with combined computer-aided design and 3D printing technology: An in vitro study. J Prosthet Dent 2015;113:398-404.
- Oehman C, Baleani M, Viceconti M. Repeatability of experimental procedures to determine mechanical behaviour of ligaments. Acta Bioeng Biomech 2009;11:19-23.
- Goussard J, Lechevrel C, Martin P-M, Roussel G. Comparison of monoclonal antibodies and tritiated ligands for estrogen receptor assays in 241 breast cancer cytosols. Cancer Res 1986;46(8 Suppl):4282s-7s.
- Schaefer O, Watts DC, Sigusch BW, Kuepper H, Guentsch A. Marginal and internal fit of pressed lithium disilicate partial crowns in vitro: a three-dimensional analysis of accuracy and reproducibility. Dent Mater 2012;28:320-6.
- Subrahmanya Nairy K, Aruna Rao K. Tests of coefficients of variation of normal population. Commun Stat Simul Comput 2003;32:641-61.
TABLES
Table I. Mean, SD (standard deviation) of differences and CV(correlation variance) of 5 groups
|
Group |
Mean measurement |
Mean difference |
SD |
CV |
|
25 |
32.6 |
7.6 A |
4.93 |
15.12 |
|
45 |
36.8 |
8.2 B |
13.54 |
36.78 |
|
65 |
45.6 |
19.4 B |
5.59 |
12.27 |
|
85 |
46.8 |
38.2 C |
6.06 |
12.94 |
|
105 |
66.8 |
38.2 C |
3.11 |
4.67 |
Groups with the same letters are not significantly different by Tukey’s HSD test for multiple comparisons with a confidence level of 95%.
LEGENDS
Fig. 1. Color-coded images.
Note: Yellow denotes contact areas, blue indicates gap areas and green is ideal
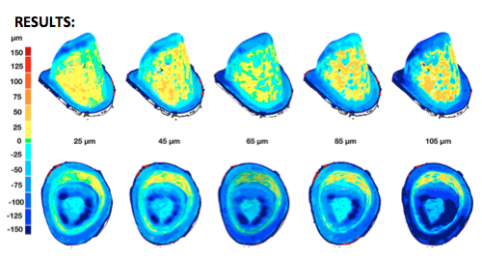
Fig. 2. Scattered graph of measured means for each group and standard deviations. Trend line equation and R2 value.
Cite This Work
To export a reference to this article please select a referencing stye below:
Related Services
View all


DMCA / Removal Request
If you are the original writer of this essay and no longer wish to have your work published on UKEssays.com then please click the following link to email our support team:
Request essay removal